World Journal of Condensed Matter Physics
Vol.2 No.2(2012), Article ID:19088,9 pages DOI:10.4236/wjcmp.2012.22012
First-Order Studies of Nanometric Biferroic
![]()
1Materials Science Lab (1), Physics Department, Faculty of Science, Cairo University, Giza, Egypt; 2Physics Department, Nuclear Research Center, Atomic Energy Authority, Cairo, Egypt.
Email: *moala47@hotmail.com
Received February 22nd, 2012; revised March 26th, 2012; accepted April 6th, 2012
Keywords: Biferroic; Nanocomposite; Nickel-zinc ferrite; Barium titanate; Dielectric; Hysteresis; First-order transition
ABSTRACT
Magnetoelectric biferroic nanocomposite with composition 0.5Ni0.5Zn0.5Fe2O4 + 0.5BaTiO3 was synthesized by ceramic technique. The structural and electrical characterizations of the investigated nanocomposite are discussed and reported. The formation of nanosized composite with two separate phases was confirmed by X-ray diffraction, scanning electron microscopy (SEM) and Fourier transform infrared spectroscopy (FT-IR). The variation of dielectric constant (ε'), dielectric loss factor (ε") and the ac conductivity (σac) of 0.5Ni0.5Zn0.5Fe2O4 + 0.5BaTiO3 was investigated as a function of both frequency and temperature. Thermal hysteresis (first-order transition) was obtained during heating (300 - 830 K) and cooling runs (830 - 300 K). The exact transition temperature and the amount area of the thermal hysteresis depend on applied ac electric field. The delay (lagging) time between heating and cooling processes was estimated from the hysteresis loop area versus frequency. The conduction mechanism in the investigated samples was explained according to different models. This study enhances the use of this prepared system in memory applications.
1. Introduction
Ferroic materials are those which display spontaneous magnetization (ferromagnetic), polarization (ferroelectric) and strain (ferroelastic). Materials that possess two “ferro” properties simultaneously are called “biferroics”. There are three kinds of biferroic materials namely, Electroelastic, Magnetoelastic and Magnetoelectric materials [1]. Possible applications of magnetoelectric materials include magnetic-electric energy converting components, solid state nonvolatile memory, multi-state memory which can find application in quantum computing area and electric/optical polarization components which can find applications in communication, light computing and solid state memories based on spintronics [2]. Another attempt to the magnetoelectric material was to replace certain cations in the ferroelectric perovskite by magnetic cations. However, due to the dilution of the magnetic ions, these materials have Curie temperatures far below room temperature. If the materials with magnetostriction and electrostriction were coupled together mechanically, the mechanical interaction between the magnetostriction phase and the electrostriction phase can lead to a functional magnetoelectric material [3]. If a magnetic field is applied to such a composite the ferromagnetic phase deforms due to the magnetostriction effect as well as the mechanical coupling between electrstrictive phases with the magnetostriction phase. The electrostriction phase is also deformed to adapt to the strain. The major advantage of the composite approach over the single crystal approach in the engineering side is that the Curie temperatures of the material are expected to stay close to their bulk values. From the reported experimental data, the coupling coefficient is much higher than that of single phase crystals. The selection of ferrite and ferroelectric materials depends on various factors like high magnetostriction coefficient and piezoelectric coefficient, high dielectric permeability and poling strength [4]. The size of unit cell, the force constant of the ions in the lattice of a crystal and dielectric properties are temperature dependent. As the temperature increases, there is a particular structure changes from unstable to stable one at the transition temperature. Although the transition involves only small ionic movements, they cause a marked change in the properties. Transition from one crystal structure to another is usually accompanied by a change in the entropy and volume. It is well known that, there are two different orders of transition. When the spontaneous polarization goes from zero to a finite value, or from one value to another, the change in polarization may be continuous or discontinuous. If there is discontinuity in the change of the polarization, the transition is referred to as a first-order transition, as in BaTiO3. In this case, the entropy changes at a constant temperature (e.g., T = Tc), and consequently the latent heat also changes. If the change of the polarization is continuous, the transition is referred to as a second-order transition, as in KH2PO4 and Rochelle salt. By heating the sample through the Curie point, the polarization changes discontinuously to reach the paraelectric nonpolar phase. In the first-order transition, the sample suddenly loses all the energy associated with the polarization at the Curie point, indicating a big change in its latent heat [5]. In the present study BaTiO3 (BTO) is used as the ferroelectric phase with high dielectric permittivity and Ni0.5Zn0.5Fe2O4 as the ferrite phase with interesting magnetic properties [6]. We aimed to build up the fundamental knowledge base necessary to accelerate the development of magneto-electric materials (ME) (0.5Ni0.5Zn0.5Fe2O4 + 0.5BaTiO3) nancomposite towards practical applications.
2. Experimental Procedures
2.1. Preparation
In this work, Nickel zinc ferrite-Barium titanate biferroic nanocomposite system (0.5Ni0.5Zn0.5Fe2O4 + 0.5BaTiO3) was synthesized by standard double sintering technique [7]. As a first step, the ferromagnetic phase was prepared by mixing the raw materials NiO, ZnO, and Fe2O3 in appropriate molar proportions where all chemicals were in analar grade 99.99% (Aldrich). The component oxides were mixed and grounded in agate mortar for 3 hours manually and then transferred to agate ball mill for another 3 hours, then pre-sintered at 950˚C for 5 hrs with heating rate of 4˚C/min. The piezoelectric phase was also prepared following the same route by mixing BaCO3 and TiO2 in appropriate molar proportions, grounded similarly to the ferromagnetic phase and pre-sintered at 950˚C for 5 hrs. As a second step the magnetoelectric (ME) nanocomposite was synthesized in a second step by mixing 50 wt% of BaTiO3 phase and 50 wt% of Ni0.5Zn0.5Fe2O4, respectively and good mixed by grinding. The samples were compressed into pellets form with a diameter of 10 mm and thickness of 1.5 mm using uniaxial press of pressure 105 N/m2. The nanocomposite mixture was finally sintered at 1150˚C for 5 h with a heating rate of 4˚C/min to yield the final products and then cooled down to the room temperature with the same rate as that of heating. The pre and final sintering were carried out using a UAF 16/5 (UK) furnace with microprocessors to control both heating and cooling rates.
2.2. Characterization
The crystal structure of the prepared nanocomposite and their constituent phases were determined by X-ray diffractometer model Proker D8 with CuKa radiation (l = 1.5418 Å) in a wide range of Bragg’s angle (2q) ranging from (20˚ - 80˚) at room temperature. The average particle size (L) was calculated from X-ray line broadening using (311) peak and Debye-Sherrer’s equation [8], L = 0.89 l/b cosq, b is the full width at half maximum (FWHF) and l is the wavelength of the radiation. Scanning electron microscope (SEM) was carried out by using JEOL JSM-5600LV. FT-IR spectroscopy (Perkin Elmer System 2000) was used to identify the chemical structure of the composite using KBr technique. The two surfaces of each pellet of the investigated nanocomposites were prepared for dielectric constant measurements by coating with silver paste and checked for good conduction. The ac conductivity and dielectric parameters were measured at different frequencies (10 kHz - 5 MHz) from room temperature up to about 830 K using Hioki LCR meter 3532 (Japan) with shielded cables. The data were collected using a computer software (Labview based) connecting the RLC bridge to the computer via a GPIB interface [9]. The temperature of the samples was measured using a Digi-sense thermometer with K-type thermocouple. The junction of the thermocouple was in contact with the sample to prevent any temperature gradient. The accuracy of measuring temperature was better than 1˚C.
3. Results and Discussion
3.1. Structural Characterization
The XRD patterns of 0.5Ni0.5Zn0.5Fe2O4 + 0.5BaTiO3 ME nanocomposites is shown in Figure 1. From the figure it is clear that, there are two phases: cubic structure NiZnFe2O4 ferrite (piezomagnetic PM) and perovskite tetragonal crystal structure BaTiO3 (piezoelectric PE). No third phase coexists in the prepared nanocomposites. This means that, no significant chemical reaction takes place during sintering of the mixed powders. The pattern revealed that, the highest peak value of XRD intensity corresponding to perovskite phase of PE which occurred at 2q = 31.53˚. The value of lattice constant (a) for the PM phase is 8.3885 Å, while those of (ac) for tetragonal PE phase are 4.0049 Å and 4.0048 Å respectively. The calculated crystallite sizes (L) of the PM and PE phases using Debye-Sherrer’s equation are 69 nm and 100 nm respectively.
The typical SEM micrograph is shown in Figure 2 for the prepared nanocomposite. It is observed that there are two dissimilar particle shapes corresponding to the two different phases forming the nanocomposite. Energy dispersive X-ray (EDX) was used to distinguish between the two phases. It is found that, white contrast is corresponding to BaTiO3 phase whereas the dark contrast is the Ni0.5Zn0.5Fe2O4 one. It was observed also that, ferromagnetic particles are dispersed at the piezoelectric matrix grain boundaries. SEM was used to determine the particle size of the two particle phases with different shapes by using counting method [10]. The results revealed that the particle size determined by SEM is larger than that obtained from XRD measurements.
Fourier Transform Infrared Spectroscopy (FT-IR) spectra, Figure 3, shows that, in the Ni0.5Zn0.5Fe2O4 systems Ni2+ is stabilized in the octahedral crystal field whereas

Figure 1. XRD pattern of 0.5Ni0.5Zn0.5Fe2O4 + 0.5BaTiO3 Biferroic System.
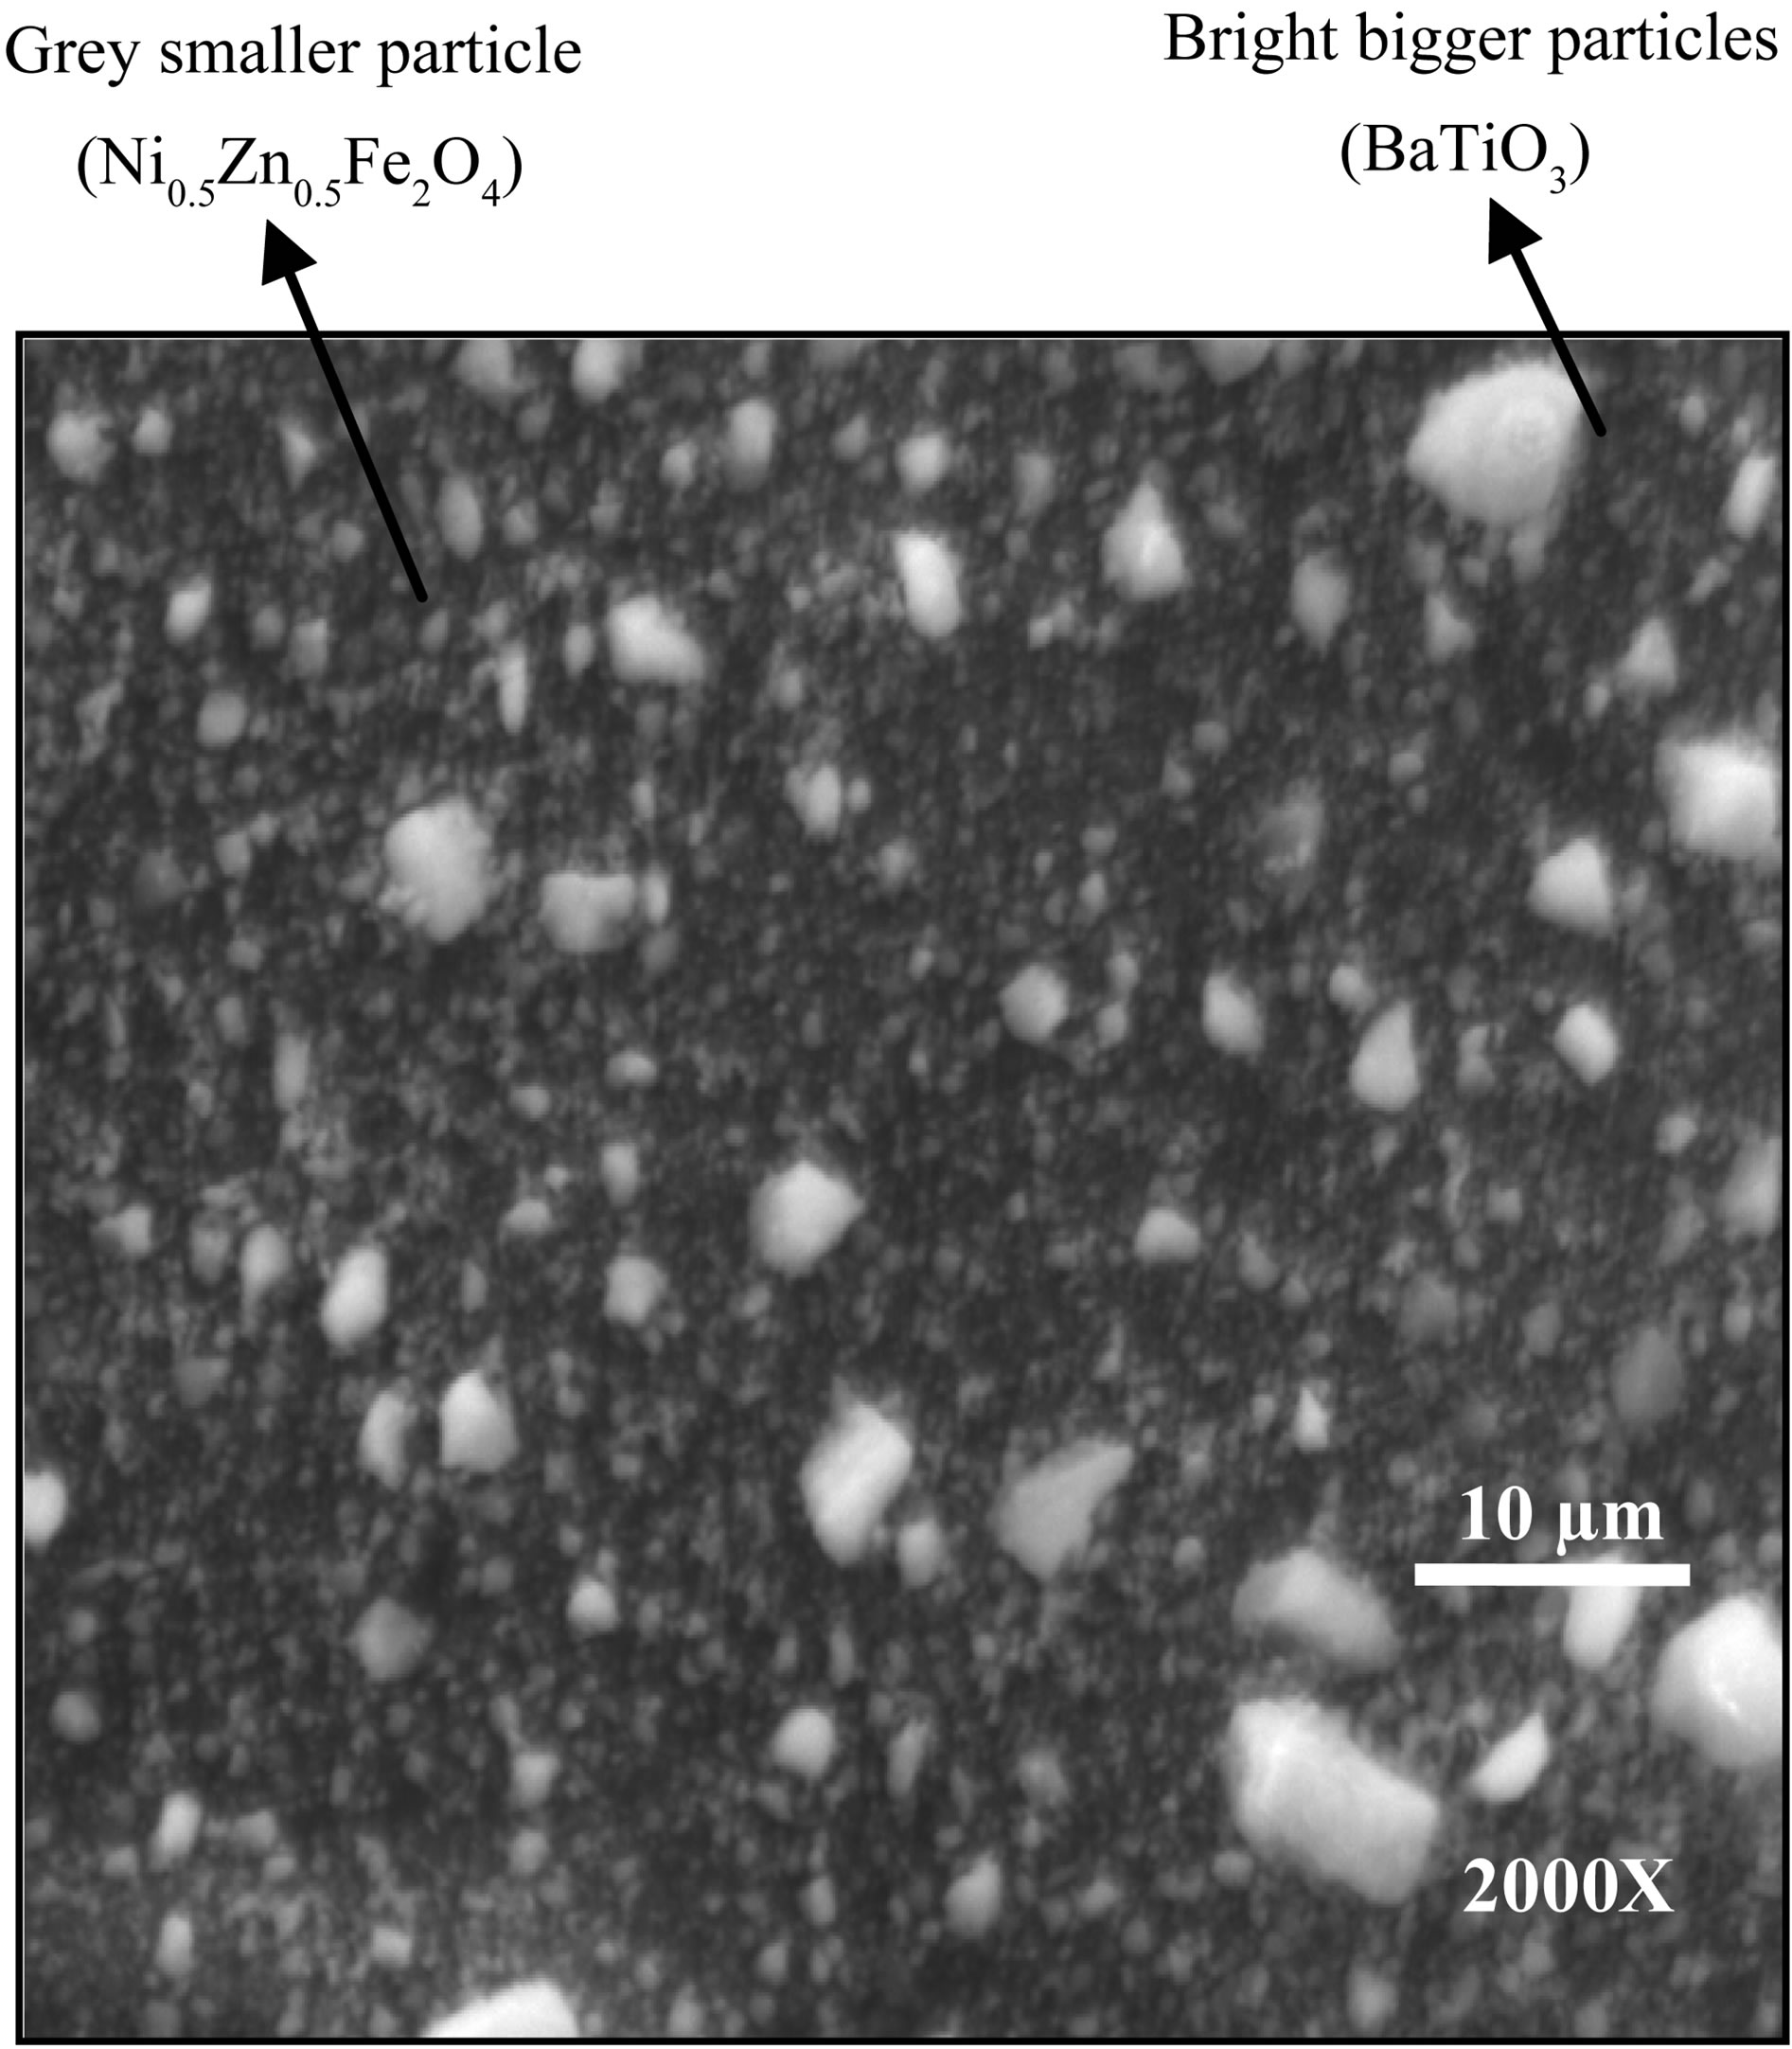
Figure 2. SEM of 0.5Ni0.5Zn0.5Fe2O4 + 0.5BaTiO3 Biferroic system in the powder shape.
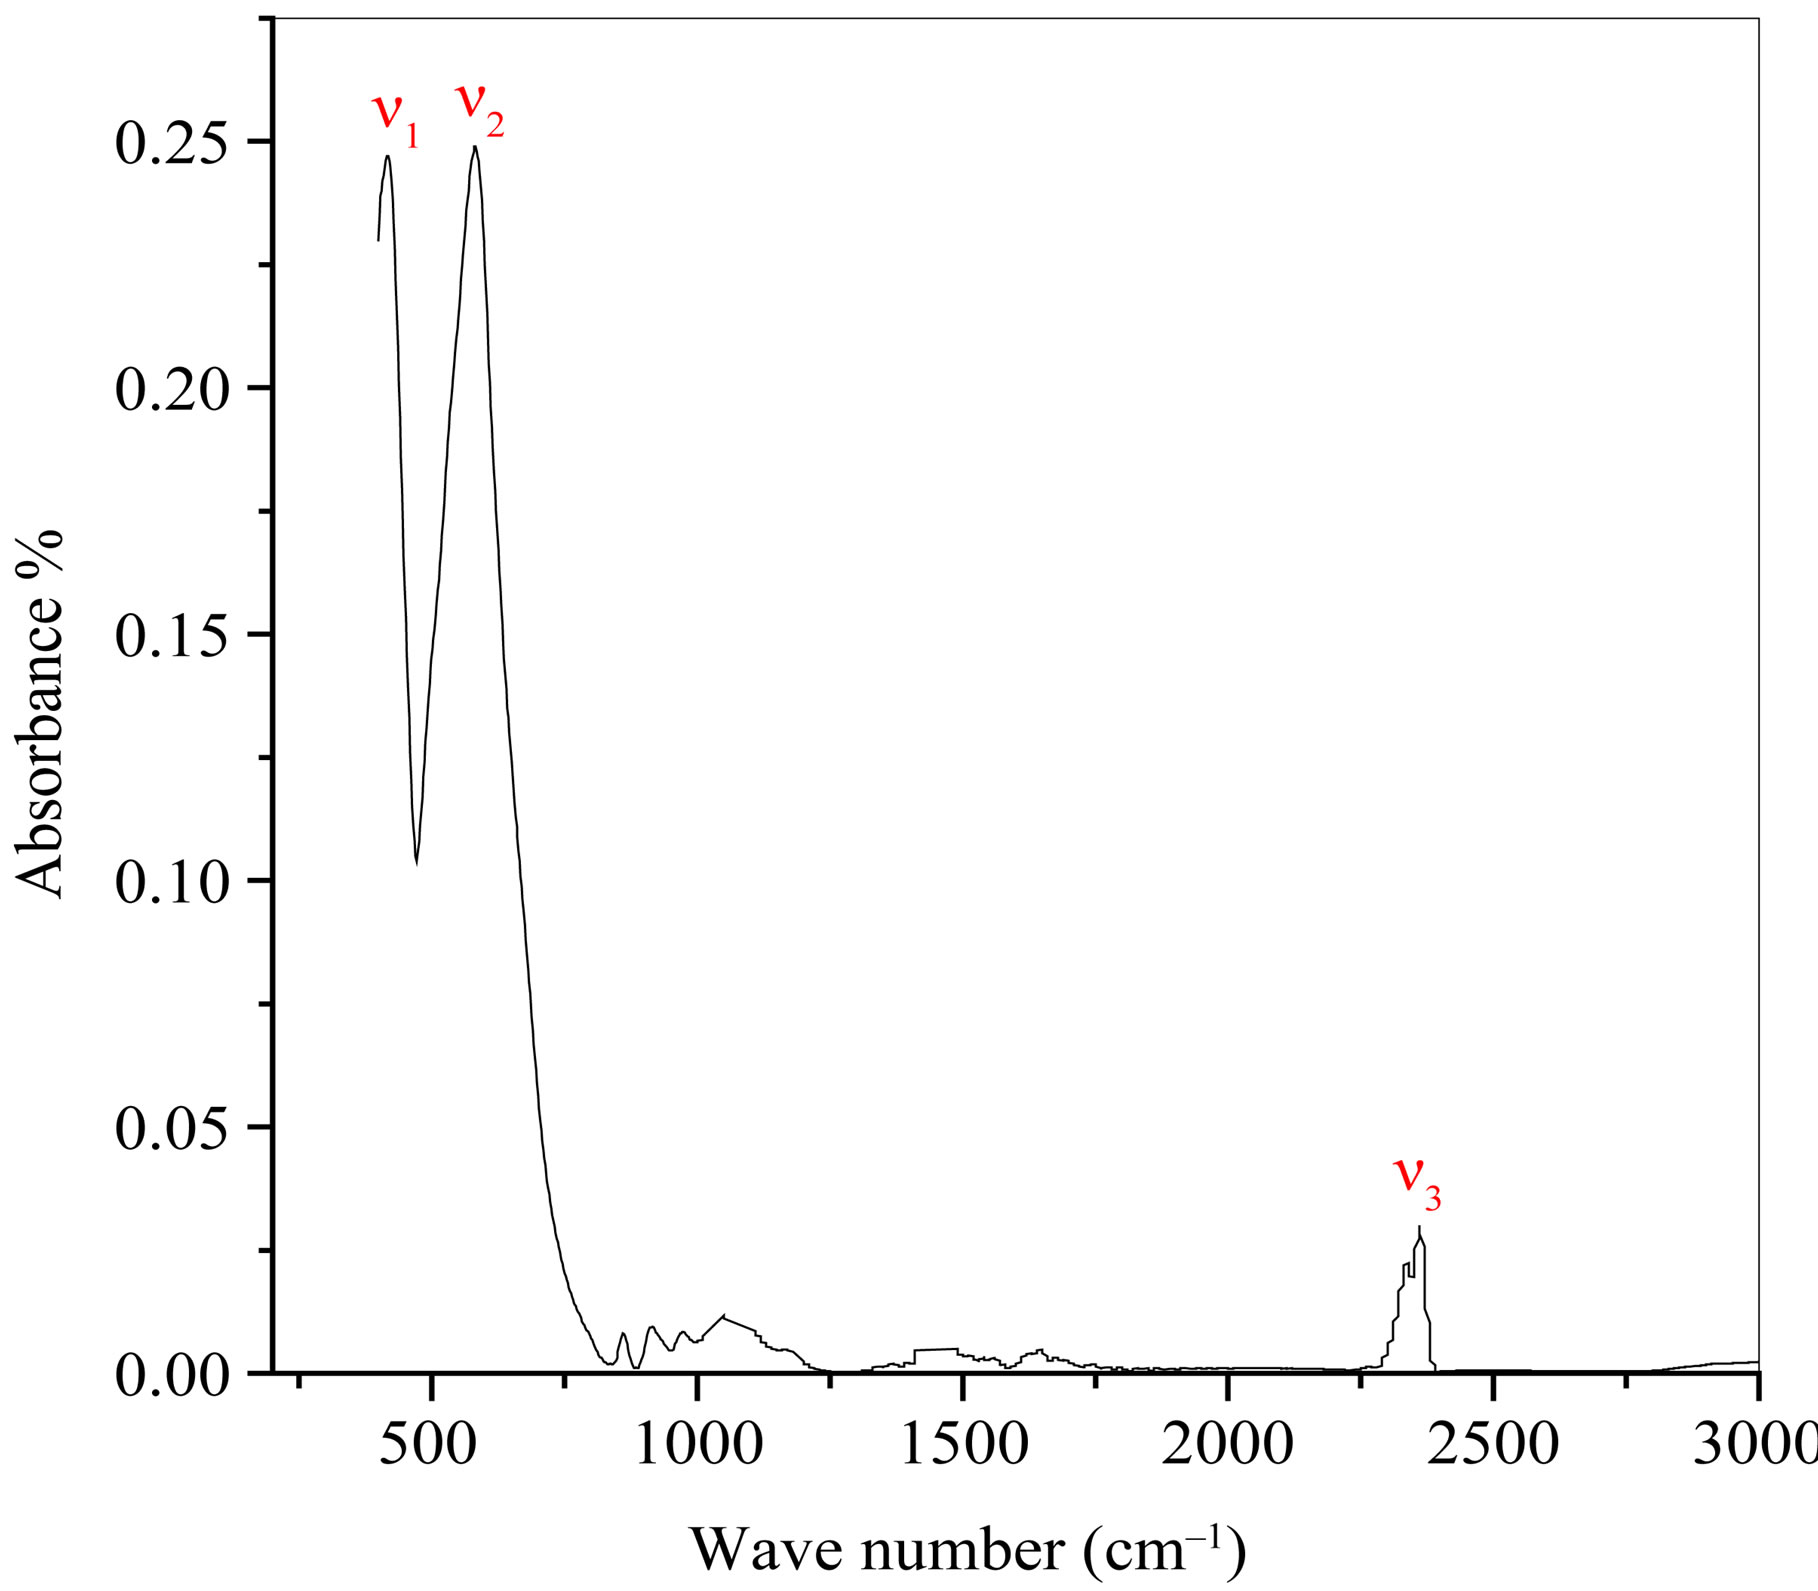
Figure 3. FTIR of 0.5Ni0.5Zn0.5Fe2O4 + 0.5BaTiO3 Biferroic material.
Zn2+ prefers tetrahedral sites because of its facility to form covalent bonds involving sp3 hybrid orbitals. The ν1 band observed at ~579 cm–1 can be assigned to the stretching vibration of (Fe3+ + O2− ) on tetrahedral site and the ν2 band observed at ~420 cm–1, involves the stretching vibration of (Fe3+ + O2− ) on the octahedral site. These results are in agreement with that published earlier [11]. One of the fingerprint stretches for BaTiO3 was also observed at ~480 cm–1, while it appears at ~420 due the exchange interaction between Ni0.5Zn0.5Fe2O4 and BaTiO3 within the nanocomposite. The band at 2360 cm−1 indicates the presence of OH group [12].
3.2. Dielectric Properties
3.2.1. Dielectric Constant
Figure 4 Correlates, the real part of dielectric constant (ε') and absolute temperature as a function of frequencies for the nanocomposite 0.5Ni0.5Zn0.5Fe2O4 + 0.5BaTiO3. The data clarify that the dielectric constant increases with increasing temperature and decreases with increasing frequency. The data in Figure 4 show that, there are two humps around the temperatures 420 K, 520 K and one maximum at 600 K for each frequency. These transitions represent the resonance of the nanocomposite system takes place at the transition points [13].
The variation of the dielectric constant with frequency reveals dispersion due to Maxwell-Wagner type interfacial polarization which is in good agreement with Koop’s phenomenological theory [14]. According to this model the nanocomposite structure is supposed to be composed of the fairly well conducting grains, separated by ultra thin insulating layer of grain boundaries. These grain boundaries could be formed either in each phase separately, due to the superficial reduction or oxidation of crystallites in the porous materials as a result of their direct contact with the firing atmosphere during the sintering process [15].
Figures 5(a)-(c) correlate the real part of dielectric constant (ε') and absolute temperature during heating and cooling runs, in the temperature range (from R.T ↔ 830 K) at selected frequencies for the composite 0.5Ni0.5Zn0.5Fe2O4 + 0.5BaTiO3. These curves indicate that, the: 0.5Ni0.5Zn0.5Fe2O4 + 0.5BaTiO3 nano-composite posses a thermal hysteresis loop behavior which could be attributed to a first-order transition [16]. At this transition the physical properties such as dielectric constant, polarization, etc. change discontinuously with temperature [6], where the two runs gives hysteresis curve with different areas depending on the applied frequency. This hysteresis behavior confirms that, BaTiO3 has dual effects namely piezoelectric and pyroelectric properties. When heating the prepared nanocomposite, BaTiO3 undergoes a structural phase transition from tetragonal to cubic phase.
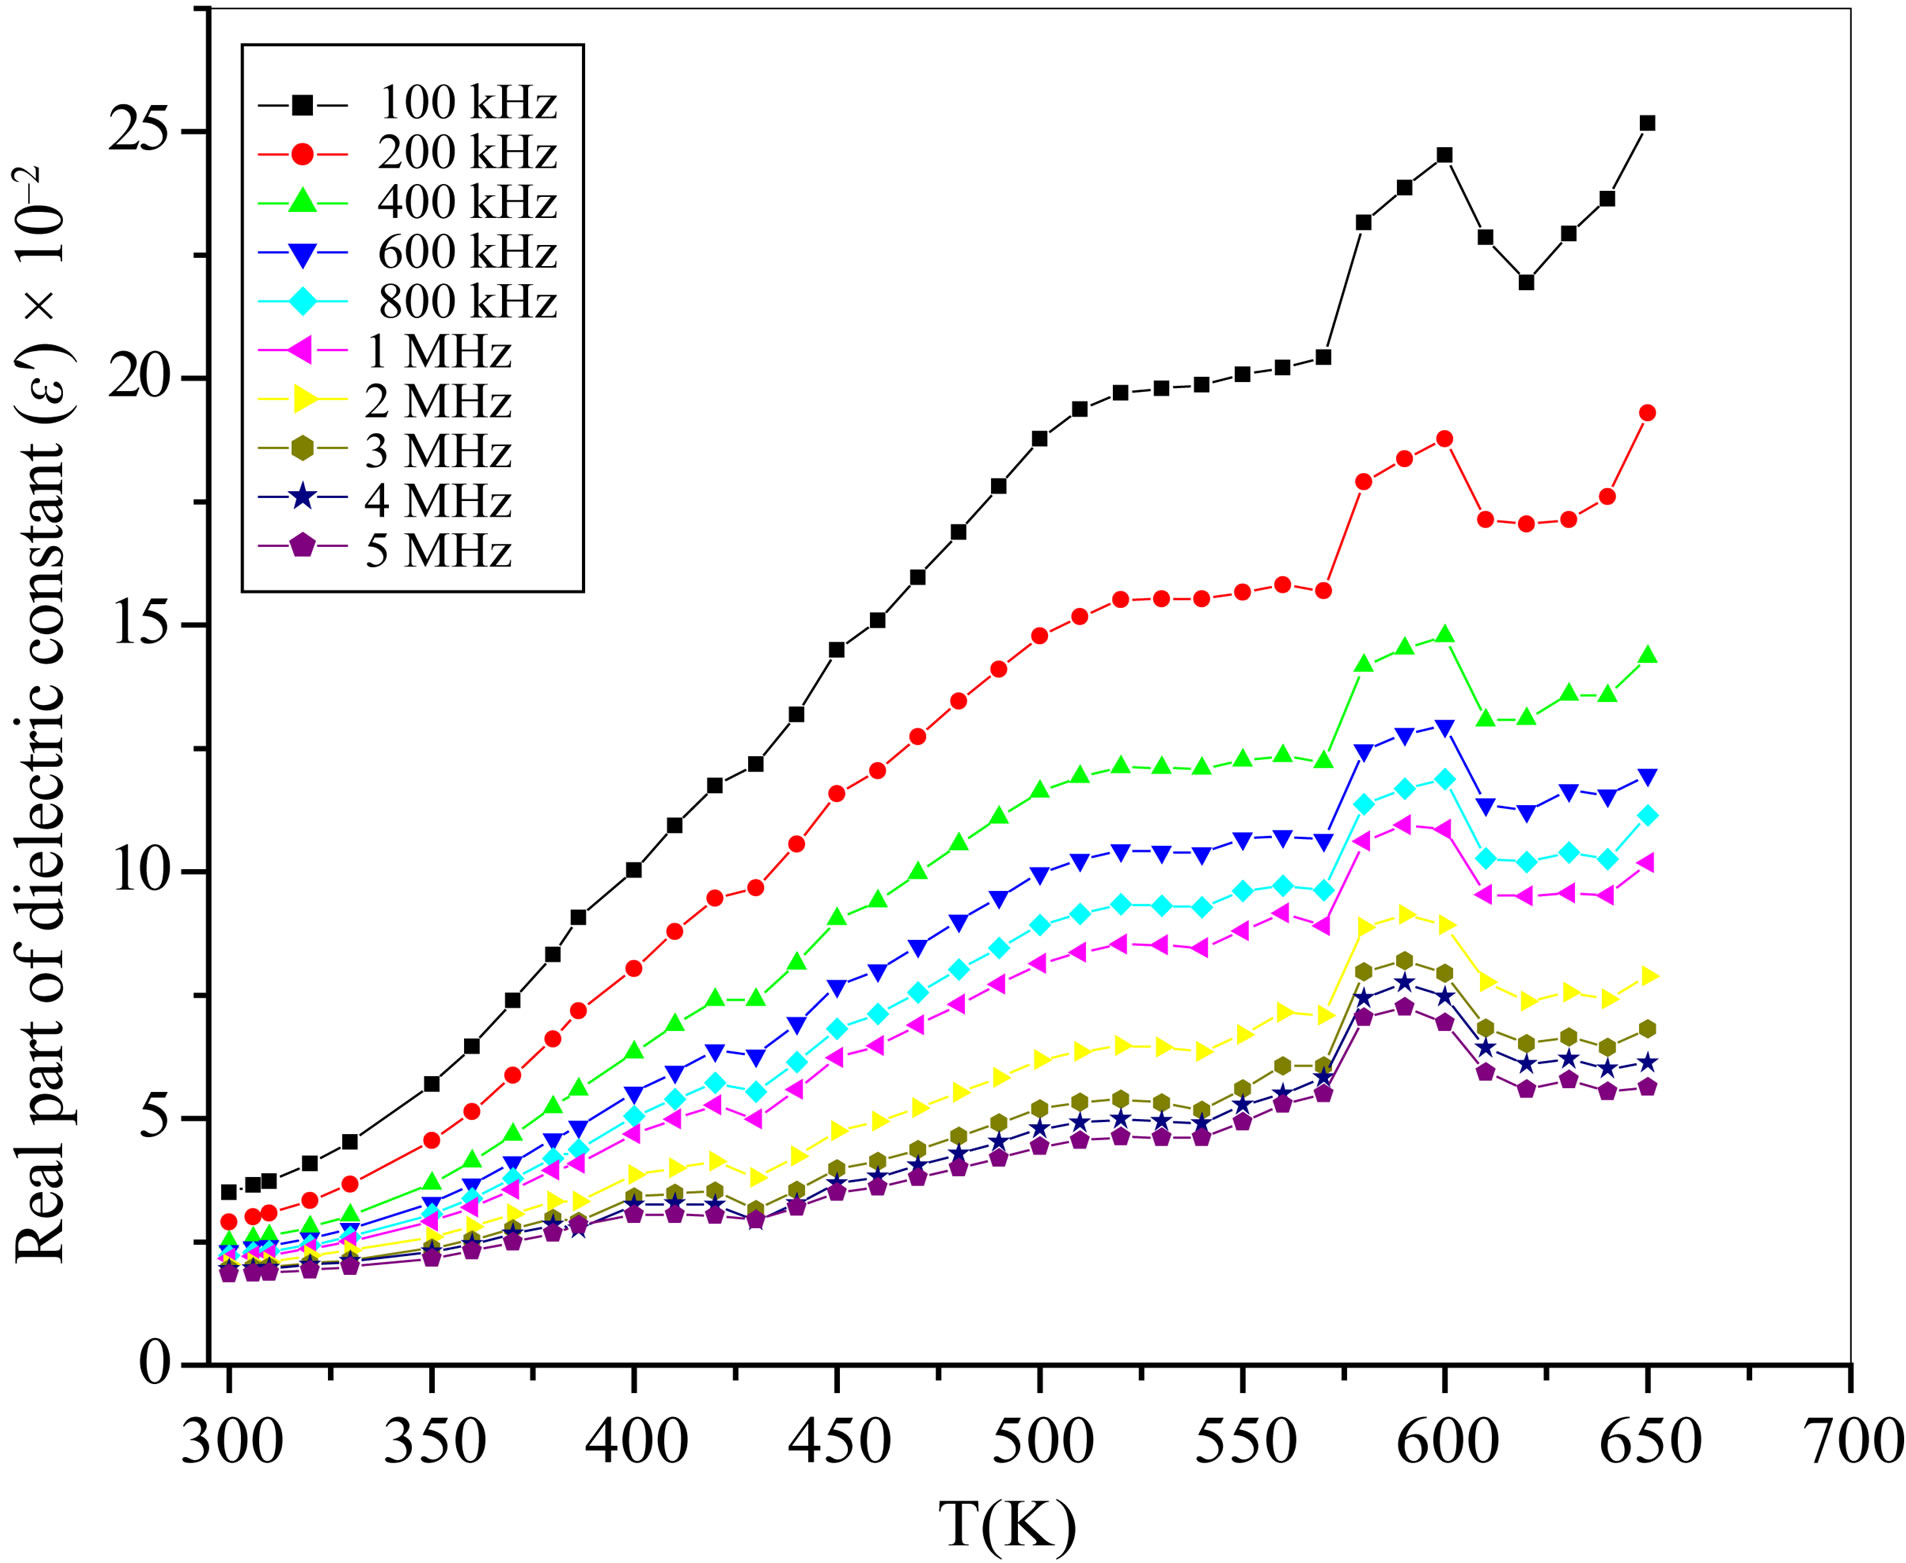
Figure 4. Variation of the real part of dielectric constant (e') versus absolute temperature at different frequencies.
 (a)
(a) (b)
(b)
Figure 5. (a)-(c) Real part of dielectric constant (e') versus absolute temperature (K) at different frequencies during heating from R.T up to 830 K and cooling from 830 K down to R.T; (d) The calculated area between the heating and cooling curves of the real part of dielectric constant (e') versus absolute temperature (K) at different frequencies.
With gradual cooling from 830 K down to the 300 K, the cooling curve did not overlap on the heating one due to the relaxation process. The interesting features of the dielectric constant versus temperature diagram are the following: the cooling curve lies above the heating one and they do not merge to each other. This indicates that the cooling process could cause a substantial increase in the dielectric constant due to the increase in the density of the dipole moments towards the transition from paraelectric to ferroelectric nature. The dielectric constant of ferroelectric materials is extremely high near the transition temperature, the polarization induced in the paraelectric (non polar) region at T > Tc by an applied electric field along the ferroelectric axis goes gradually over into the spontaneous polarization region upon cooling below Tc. The effect of this field tends to shift Tc to a higher temperature [6]. At Tc, the ferroelectric phase is favored by an applied field, therefore, the Curie temperature is raised.
On drawing the calculated values of the area of the loop versus frequency Figure 5(d) the obtained graph shows exponential decay behavior of the second order which can be fitted to the following equation:
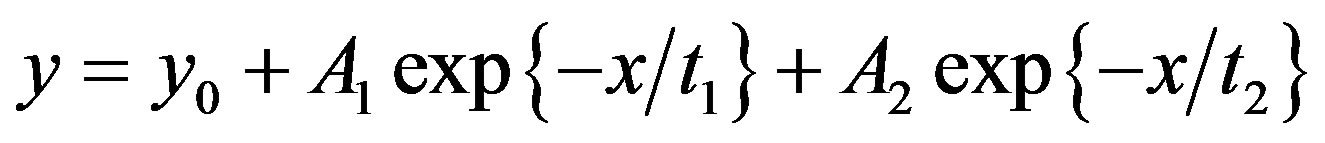 (1)
(1)
where y represents the hysteresis loop area, y0 is the area at zero frequency, A1 and A2 are constants, x represents the applied frequency and t1, t2 are the reciprocal of relaxation (life) times. The calculated values of t1 and t2 are 1.48 × 10⁵ and 1.2 × 10⁶ Hz respectively. Time dependent dielectric constant measurements reveal memory effects of the investigated composite [17].
The area between the two curves can be attributed to the heat dissipation due to the friction between the dipoles. The behavior of the area between the two curves versus frequency has the same trend as that of the real part of the dielectric constant versus frequency in the same temperature range.
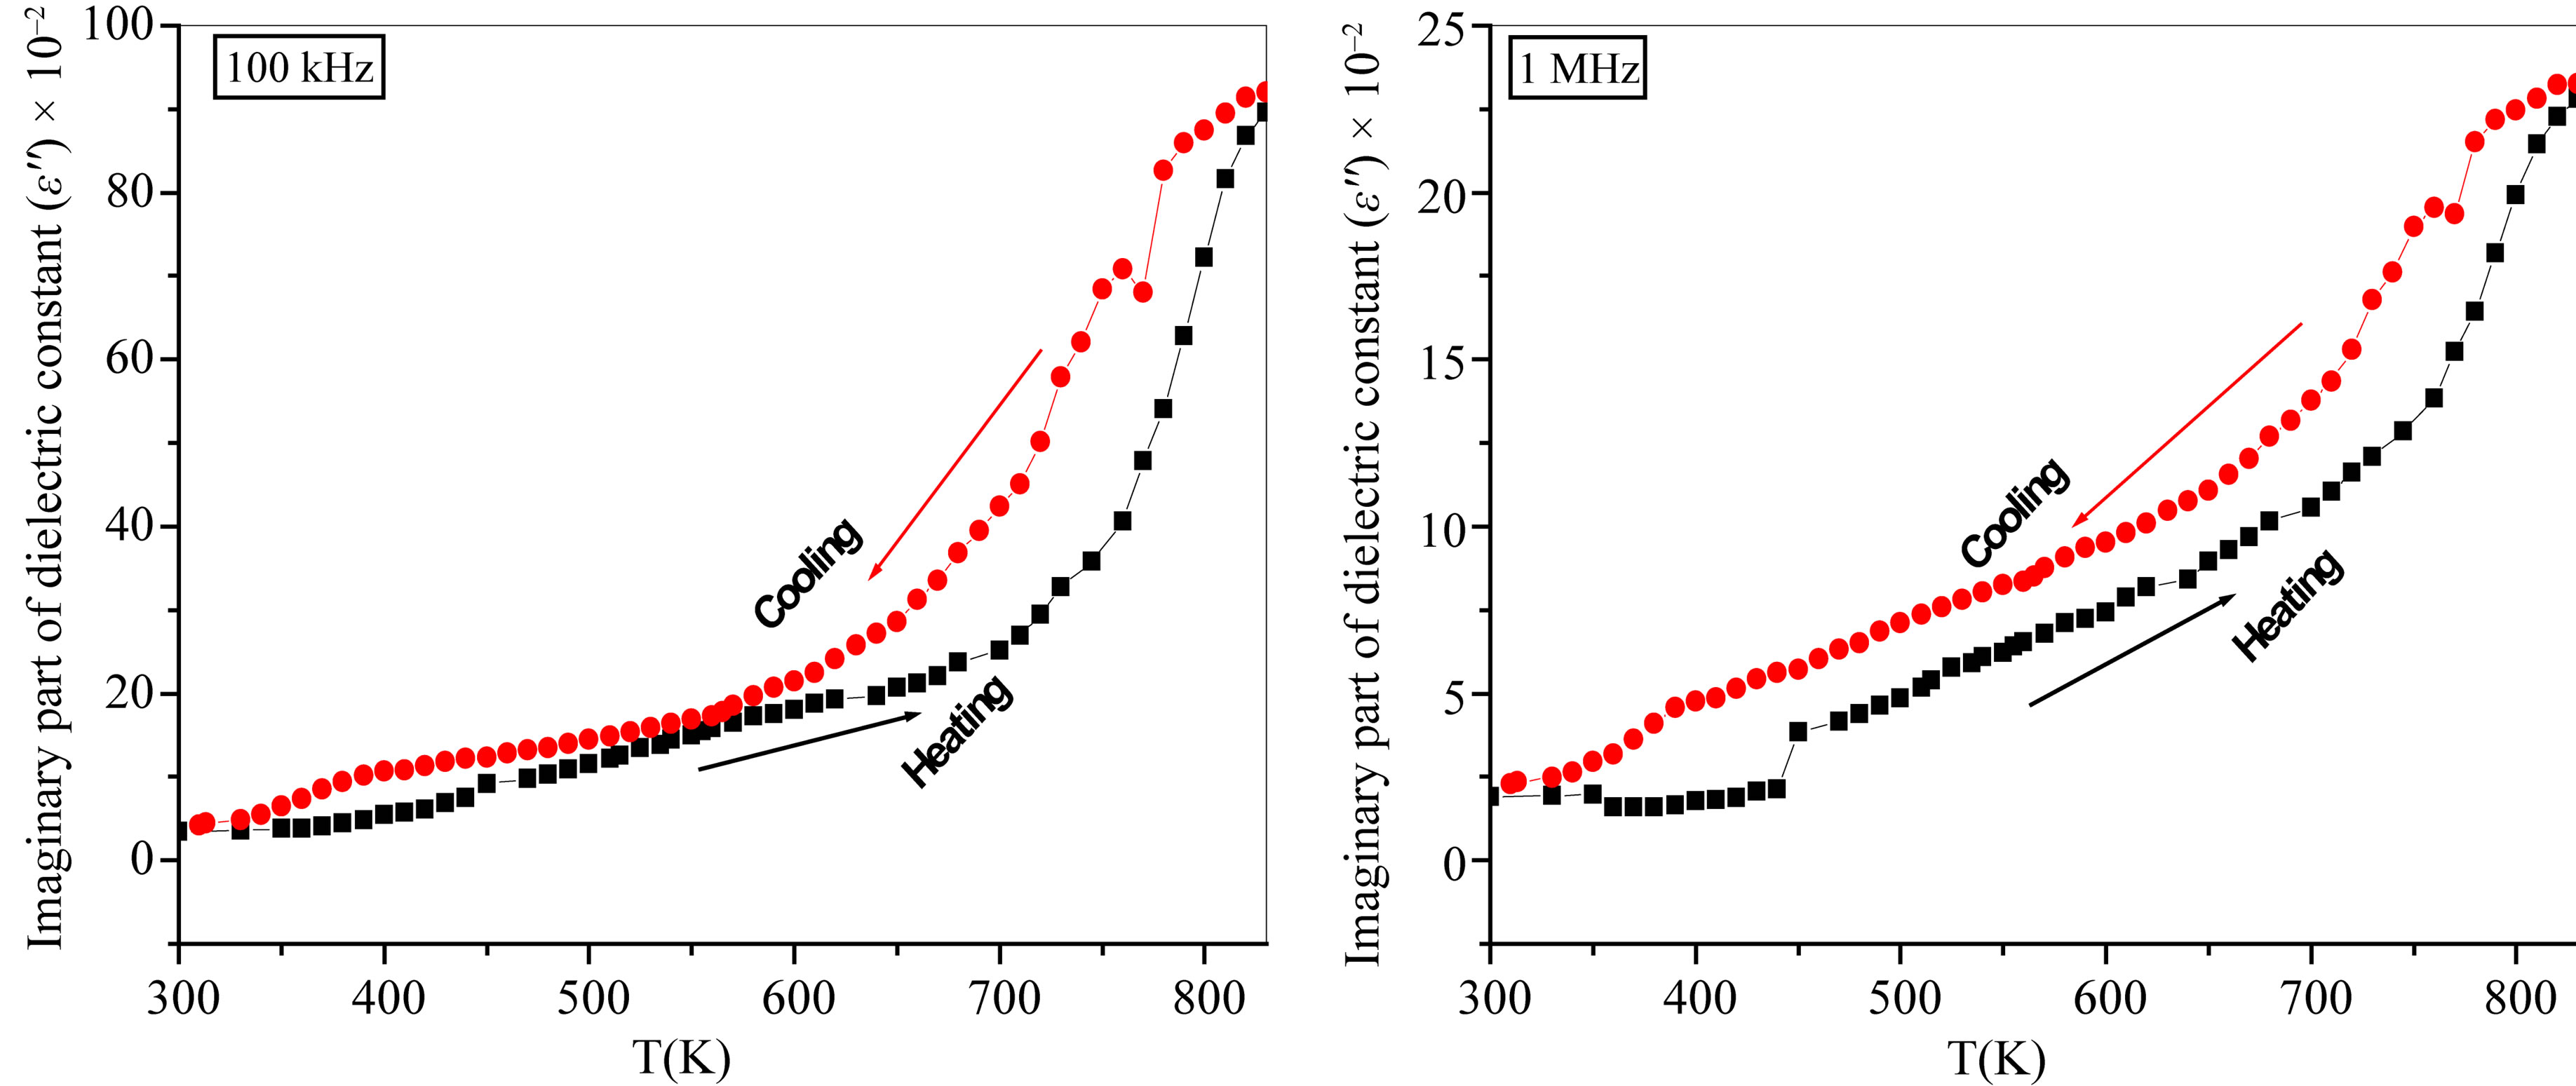
3.2.2. Dielectric Loss Factor (ε")
Figure 6 shows the variation of the dielectric loss factor (ε") with absolute temperature as a function of frequencies for the nanocomposite 0.5Ni0.5Zn0.5Fe2O4 + 0.5BaTiO3. The data in the Figure 6 show that high losses corresponding to high (ε") at low frequency and high temperature due to interfacial inter-granular space charge polarization at the hetero-interface between the two different PE and ME phases or at phase boundary. Also ε" reveals a hysteresis behavior with temperature as shown in Figures 7(a)-(c). An exponential decay of the hysteresis area versus frequency Figure 7(d) is fitted with the same equation of the dielectric constant. The resultant values of t1 and t2 are in the same order of magnitude and very close to those obtained from (ε'-T) measurements. The lagg of ε" versus temperature on cooling rather than on heating may be due to an asymmetric and irreversible arrangement of dipoles as mentioned above.
3.2.3. ac Conductivity (σac)
The conduction mechanisms in ferrite and piezoelectric phases are separately attributed to the Verwey-de Boer model [18] of electron and/or hole hopping which involves exchange of electrons (Fe2+/Fe3+) or holes (Ba3+/ Ba2+) between ions of the same element present in different valence states, and distributed randomly over crystallographic equivalent lattice sites. The contribution of the heterointerface in conduction mechanisms appears as a space charge interfacial polarization at the dissimilar grain boundaries. This mechanism is dominated at low frequencies and high temperatures, it depends on the distribution of the two phases with respect to each other and the volume fraction of each phase [19]. To determine the most dominant ac conduction mechanisms of the present nanocomposite, the dependence of σac on frequency at different temperatures is considered. The relation between the ac conductivity (σac) and the applied angular frequency (ω) is described by the equation [20]:
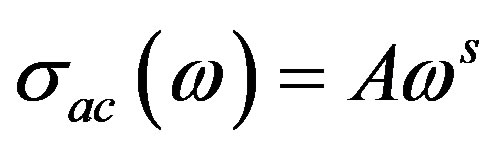 (2)
(2)
where A is constant, while the exponent (s) is very important which determine the dominant type of conduction mechanisms. According to the quantum mechanical tunneling (QMT) model [21], the exponent (s) is either temperature independent or an increasing function with temperature. On the other hand, the correlated barrier hopping model (CBH) [22,23] predicts that the power (s) is a decreasing function with temperature. The conduction mechanism also depends on the value of the exponent(s), either greater than or less than or equals unity [24,25].
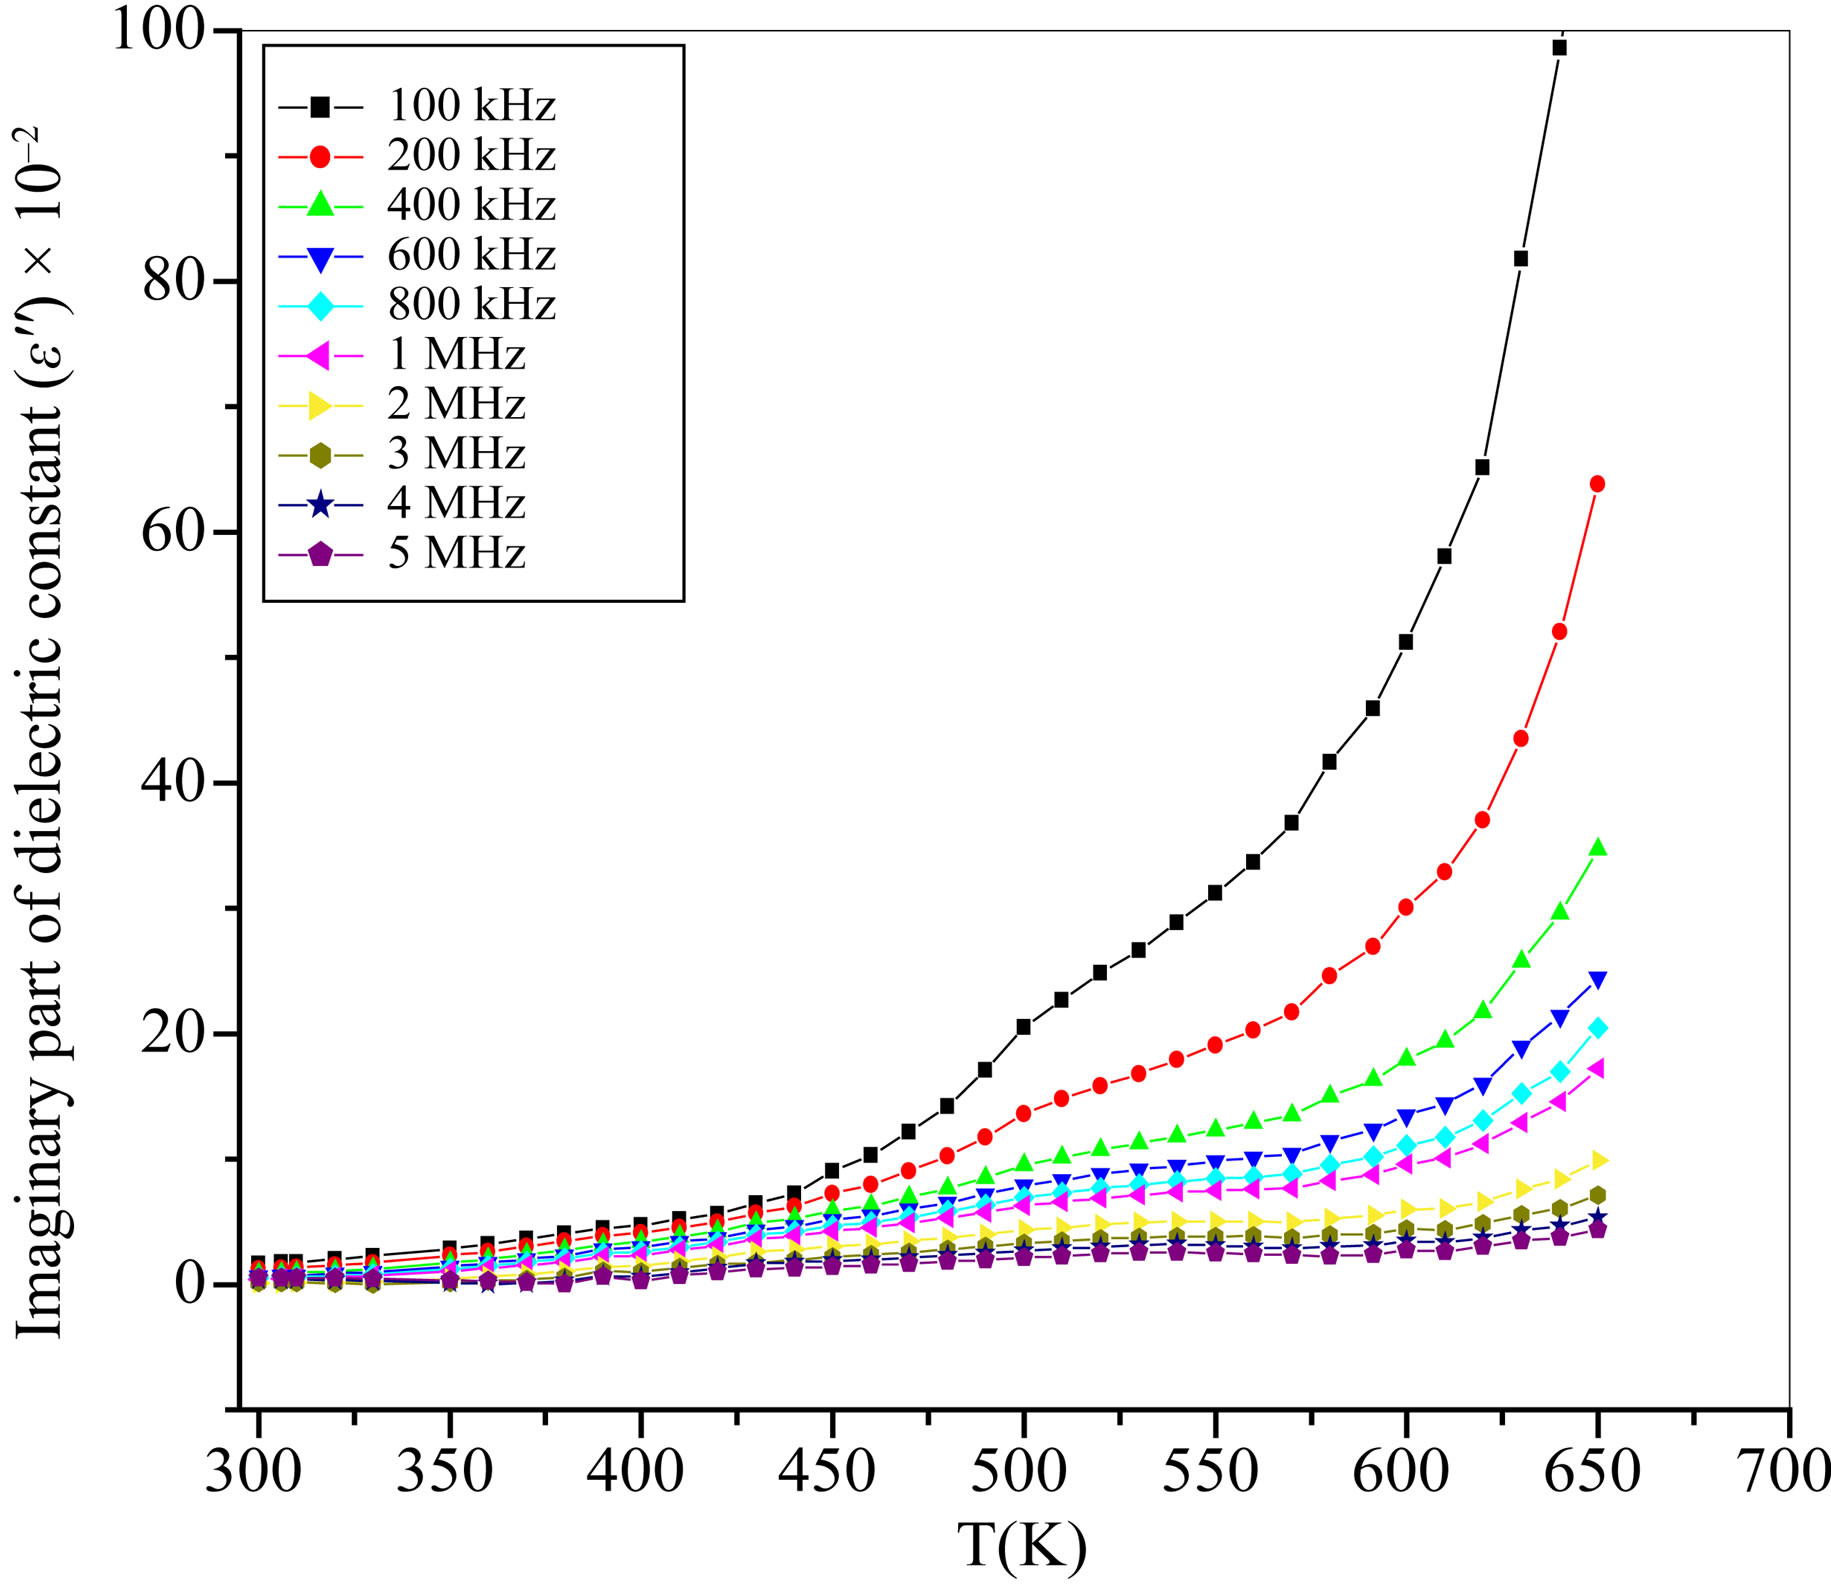
Figure 6. Dielectric loss factor (ε") with temperature at different frequencies.
 (a)
(a) (b)
(b)
Figure 7. (a)-(c) Dielectric loss factor (ε") versus absolute temperature (K) at different frequencies of the composites 0.5Ni0.5Zn0.5Fe2O4 + 0.5BaTiO3 during heating and cooling runs (from R.T up to 830 K and vice versa) and cooling from 830 K down to R.T; (d) The estimated area between the heating and cooling curves of (ε") versus absolute temperature (K) at different frequencies .
Figure 8 represents ln(σac) versus ln(ω) graphs at different temperatures in both heating and cooling processes. The data in the graph show, that, at the same temperature, ln(σ) versus ln(ω) plot gives two different graphs for heating and cooling processes. This finding confirms that our investigated biferroic nanocomposite system has a hysteresis behavior and can be used in memory applications. It is also observed that, ln(σ) versus ln(ω) plots change their trend at temperature around 500 K. Therefore, two temperature regions are considered, where the dominant conduction mechanism changes from temperature range to another predicting that there are two types of conduction mechanisms differs from one temperature region to another according to the variation of the slopes of the two lines.
It is illustrated from Figure 8 that the conductivity increases monotonically with increasing frequency and becomes weakly dependent at both high frequency and temperature. Therefore, the small polaron quantum mechanical tunneling is predicted to be the dominated current transport mechanism in the temperature range from 300 K up to 500 K in both cooling and heating processes. The linearity of the plots confirms the small polaron type of conduction. However, the slight decrease in conductivity is attributed to conduction by mixed polarons [26]. At temperatures higher than 500 K, the conduction mechanism can be explained with hopping of electrons between Fe2+/Fe3+, whereas, hopping mechanism needs high thermal energy to occur. There is also a contribution from p type charge carriers by hole hopping between Ni2+/Ni3+, but this contribution is lower as compared with the electronic contribution [27].
The calculated values of the power (s) of Equation (2) were derived from lnσac versus ln(ω) plots, Figure 8, and then plotted versus temperature in case of heating and cooling processes as depicted in Figure 9. It is also observed that, the exponent (s) increases with increasing temperature at the relatively lower temperature region (300 - 500 K). So that the behavior in this region is due to polaron quantum tunneling, while above 500 K the conduction is limited by hopping mechanism where s decreases with increasing temperature. This result is in agreement with that observed above from Figure 8. It is noted that the value of s is less than unity, i.e., 0 ≤ s ≤1 at the whole temperature range.

Figure 8. ln(σac) versus ln(ω) at different temperatures in both heating and cooling cases.
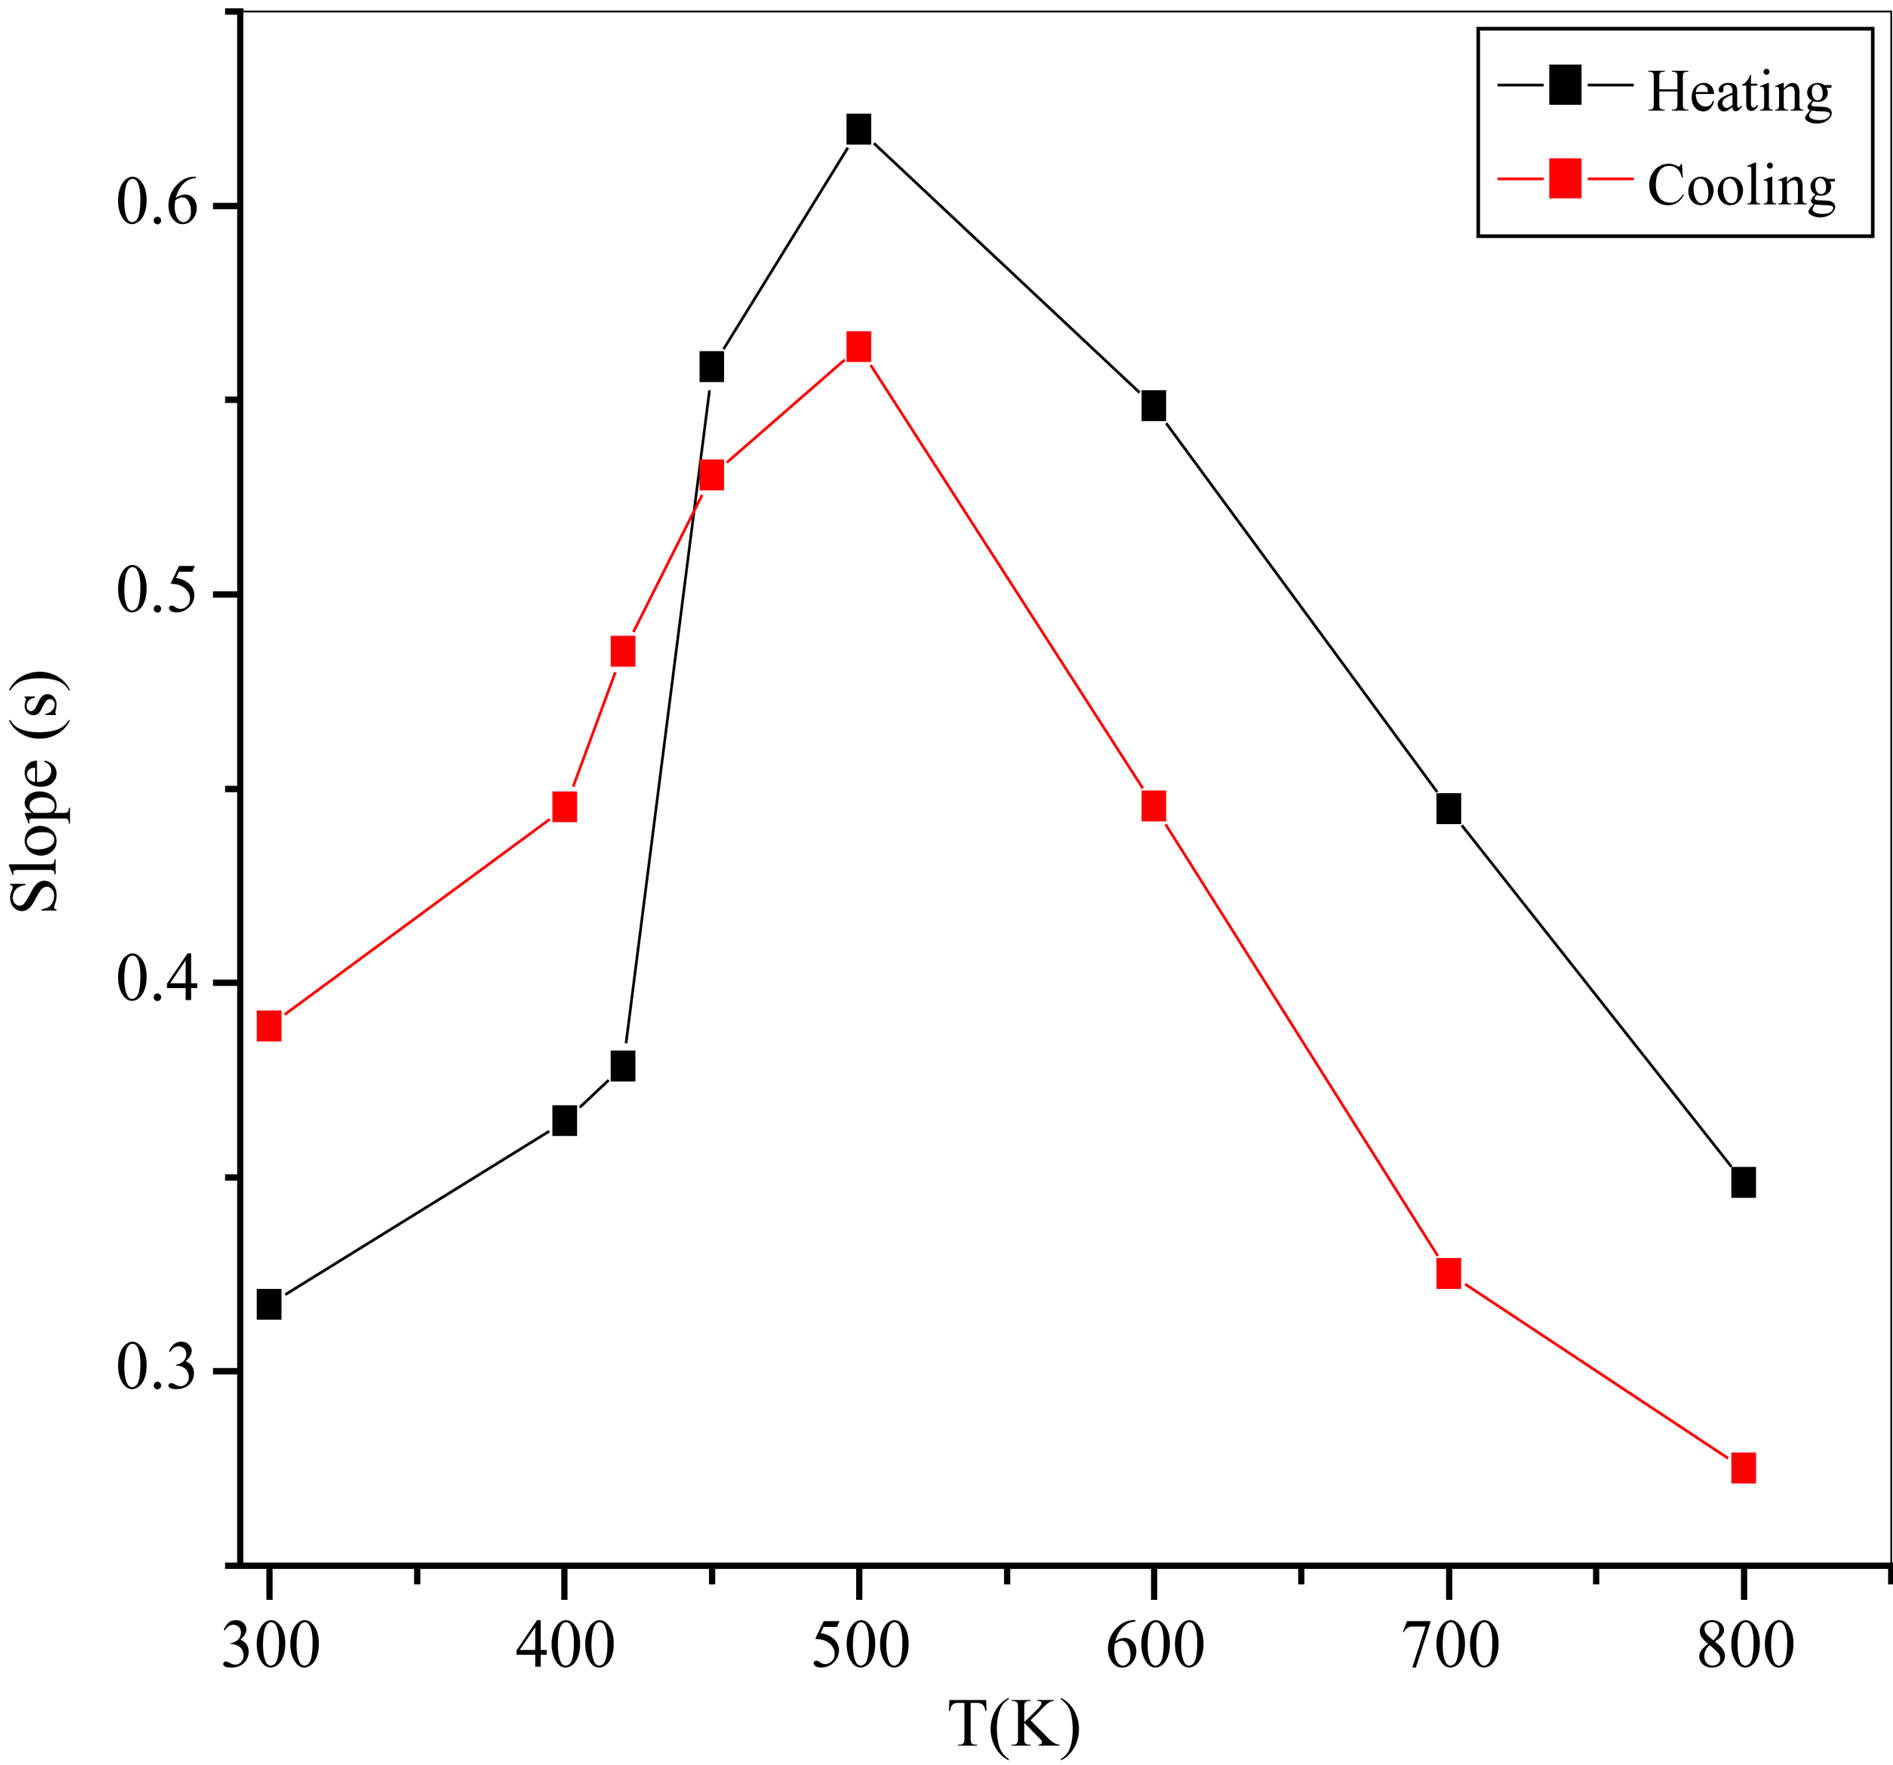
Figure 9. Variation of s with temperature in case of heating and cooling processes.

Figure 10. Seebeck coefficient of 0.5Ni0.5Zn0.5Fe2O4 + 0.5BaTiO3 biferroic nanocomposit.
The variation of Seebeck coefficient (α) with temperature (T) is shown in Figure 10. The positive and negative values of Seebeck coefficient (α) indicate that, the majority of charge carriers are holes and electrons respectively [19]. It is observed that, the positive Seebeck coefficient corresponding to p-type conduction is due to Ni2+ ↔ Ni3+ and Ba3+ ↔ Ba2+ hole transition. While n-type conductivity related to negative Seebeck coefficient is mainly due to Fe2+ ↔ Fe3+ and Ti3+ ↔ Ti4+ electron transition. The transition from p-type to n-type conduction and vice versa is a temperature dependent according to which current mechanism is predominated at this temperature region.
4. Conclusion
Biferroic magnetoelectric nanocomposite 1:1 in weight consisting of BaTiO3 as a ferroelectric phase and Ni0.5Zn0.5Fe2O4 as a ferrite phase was prepared by conventional ceramic method. XRD patterns reveal the presence of both ferrite and ferroelectric phases without any intermediate phases. The ac conductivity measurements and Seebeck coefficient suggest that the conduction is due to small polaron hopping and quantum mechanical tunneling mechanisms. Dielectric constant, dielectric loss factor and ac conductivity of the investigated composite show thermal hysteresis (first-order transition) behavior when the experimental data were collected during heating (300 - 830 K) and cooling (830 - 300 K) processes. The area of the hysteresis loop is frequency dependent. The investigated Biferroic system can be used in memory applications.
5. Acknowledgements
The authors acknowledge Prof. Dr. N. Okasha and Dr. S.I. El-Dek for great support and for their help in discussions.
REFERENCES
- A. Zakharenko, “First Evidence of Surface SH-Wave Propagation in Cubic Piezomagnetics,” Journal of Electromagnetic, Analysis and Application, Vol. 2, No. 5, 2010, pp. 287-296. doi:10.4236/jemaa, 2010-25037
- L. Zheng, “Cobalt Ferrite-Barium Titanate Sol-Gel Biferroics,” Ph.D. Thesis, University of Maryland, College Park, 2006
- J. X. Zhang, J. Y. Dai, C. K. Chow, C. L. Sun, V. C. Lo and H. L. W. Chan, “Magnetoelectric Coupling in CoFe2O4/ SrRuO3/Pb(Zr0.52Ti0.48)O3 Heteroepitaxial Thin Film Structure,” Applied Physics Letters, Vol. 92, No. 2, 2008, Article ID 022901. doi:10.1063/1.2830813
- S. R. Kulkarni, C. M. Kanamadi, K. K. Patankar and B. K. Chougule, “Magnetic Properties and Magnetoelectric Effect in Ni0.8Co0.1Cu0.1Fe2O4+PbZr0.2Ti0.8O3 Composites,” Journal of Material Science, Vol. 40, No. 21, 2005, pp. 5691-5694. doi:10.1007/s10853-005-1136-3
- K. C. Kao, “Dielectric Phenomena in Solids,” Elsevier Academic Press, Waltham, 2004.
- R. S. Devan, S. B. Deshpande and B. K. Chougule, “Ferroelectric and Ferromagnetic Properties of (x)BaTiO3 + (1 – x)Ni0.94Co0.01Cu0.05Fe2O4 Composite,” Journal of Physics D: Applied Physics, Vol. 40, No. 7, 2007, pp. 1864-1868. doi:10.1088/0022-3727/40/7/004
- M. A. Ahmed, N. Okasha1 and N. G. Imam, “Structural and Magnetic Properties of Electroceramic Magnetoelectric Nanocomposites,” The African Review of Physics, Vol. 7, No. 2, 2012, pp. 7-17. http://www.aphysrev.org/index.php/aphysrev/article/view/516/222
- B. D. Cullity, “Elements of X-Ray Diffraction,” Addison Wesley, Boston, 1978.
- M. A. Ahmed and S. I. El-Dek, “Optimizing the Physical Characterizations of Orthoferrites to be Used as Pressure and Gamma Sensor,” Materials Letters, Vol. 60, No. 12, 2006, pp. 1437-1446. doi:10.1016/j.matlet.2005.11.076
- J. Drummond, R. M. Hathorn, M. D. Cailas and R. Karuhn, “Particle Size Analysis of Amalgam Powder and Handpiece Generated Specimens,” Dental Materials, Vol. 17, No. 4, 2001, pp. 322-332. doi:10.1016/S0109-5641(00)00090-7
- M. Z. Said, D. M. Hemeda, S. A. Kader and G. Z. Farage, “Structural, Electrical and Infrared Studies of Ni0.7Cd0.3SmxFe2–xO4 Ferrite,” Turkish Journal of Physics, Vol. 31, No. 1, 2007, pp. 41-50.
- A. T. Chien, X. Xu, J. H. Kim, J. Sachleben, J. S. Speck and F. F. Lange, “Electrical Characterization of BaTiO3 Heteroepitaxial Thin Films by Hydrothermal Synthesis,” Journal of Material Research, Vol. 14, No. 8, 1999, pp. 3330-3339.
- S. A. Lokare, R. S. Devan, D. R. Patil and B. K. Chougule, “Studies on Electrical Properties of (x)BaTiO3 + (1 – x(Ni0.92Co0.03Mn0.05Fe2O4 ME Composites,” Journal of Material Science: Mater Electron, Vol. 18, No. 12, 2007, pp. 1211-1215. doi:10.1007/s10854-007-9135-6
- A. Thakur, P. Mathur and M. Singh, “Study of Dielectric Behaviour of Mn-Zn Nano Ferrites,” Journal of Physics and Chemistry Solids, Vol. 68, No. 3, 2007, pp. 378-381. doi:10.1016/j.jpcs.2006.11.028
- A. Singha, S. B. Narang, K. Singh, O. P. Pandeyd and R. K. Kotnala, “Electrical and Magnetic Properties of Rare Earth Substituted Strontium Hexaferrites,” Journal of Ceramic Processing Research, Vol. 11, No. 2, 2010, pp. 241-249.
- I. F. Voloshin, A. V. Kalinov, L. M. Fisher, N. A. B. kina, C. Martin and A. Maignan, “Correlation between Phase Diagrams and Spontaneous Magnetization Jumps in Narrow-Band Manganites,” Bulletin of the Russian Academy of Sciences: Physics, Vol. 71, No. 8, 2007, pp. 1061-1062.
- X. Ren and L. X. Zhang, “Electro-Shape-Memory Effect in Ferroelectric Martensite,” Materials Science and Engineering: A, Vol. 438-440, No. 25, 2006, pp. 1071-1076.
- M. A. Ahmed and S. T. Bishay, “Conductivity Improvement of Li-Co-Yb Ferrite,” Journal of Physics D: Applied Physics, Vol. 34, No. 9, 2001, pp. 1339-1345. www.iop.org/Journals/jdPII:0022-727(01)17653-9 doi:10.1088/0022-3727/34/9/309
- R. S. Devan, Y. D. Kolekar and B. K. Chougule, “Magnetoelectric Effect and Electrical Properties in BTO + Ni0.93Co0.02Cu0.05Fe2O4 Particulate Composites,” Journal of Alloys and Compounds, Vol. 461, No. 1-2, 2008, pp. 678-683.
- E. V. Gopalan, K. A. Malini, S. Sagar, D. S. Kumar, Y. Yoshida, I. A. Al-Omari and M. R. Anantharaman, “Mechanism of ac Conduction in Nanostructured Manganese Zinc Mixed Ferrites,” Journal of Physics D: Applied Physics, Vol. 42, No. 16, 2009, Article ID 165005. doi:10.1088/0022-3727/42/16/165005
- I. G. Austin and N. F. Mott, “Polarons in Crystalline and Non-Crystalline Materials,” Advances in Physics, Vol. 18, No. 71, 1969, pp. 41-102. doi:10.1080/00018736900101267
- M. A. Ahmed, N. Okasha and R. M. Kershi, “Could Mg Content Control the Conduction Mechanism of BaCo Zn-W-Type Hexagonal Ferrites?” Journal of Magnetism and Magnetic Materials, Vol. 321, No. 24, 2009, pp. 3967-3973. doi:10.1016/j.jmmm.2009.07.002
- S. R. Elliott, “On the Super-Linear Frequency Dependent Conductivity of Amorphous Semiconductors,” Solid State Communications, Vol. 28, No. 11, 1978, pp. 939-942. doi:10.1016/0038-1098(78)90116-3
- A. Sweyllama, K. Alfaramawi, S. Abboudy, N. G. Imam and H. A. Motaweh, “Growth and Current-Voltage Characterization of ZnTe/CdTe Heterojunctions,” Thin Solid Films, Vol. 519, No. 2, 2010, pp. 681-685. doi:10.1016/j.tsf.2010.08.112
- K. Alfaramawi, A. Sweyllam, S. Abboudy, N. G. Imam and H. A. Motaweh, “Interface States-Induced-Change in the Energy Band Diagram and Capacitance-Voltage Characteristics of Isotype Znte/Cdte Heterojunctions,” International Journal of Modern Physics B, Vol. 24, No. 24, 2010, pp. 4717-4725. doi:10.1142/S0217979210056165
- K. K. Patankar, S. S. Joshi and B. K. Chougule, “Dielectric Behaviour in Magnetoelectric Composites,” Physics Letter A, Vol. 346, No. 5-6, 2005, pp. 337-341.
- J. Ryu, S. Priya, K. Uchino, D. Viehland and H. Kim, “High Magnetoelectric Properties in 0.68Pb(Mg1/3Nb2/3)O3 High Magnetoelectric Properties in 0.68Pb0.32PbTiO3- 0.32PbTiO3 Single Crystal and Terfenol-D Laminate Composite,” Journal of the Korean Ceramic Society, Vol. 39, No. 9, 2002, pp. 813-817.
NOTES
*Corresponding author.