Atmospheric and Climate Sciences
Vol.4 No.3(2014), Article
ID:47852,9
pages
DOI:10.4236/acs.2014.43038
Trending Regional Precipitation Distribution and Intensity: Use of Climatic Indices
Syeed Md Iskander1*, Mohammad Adnan Rajib2, Md Mujibur Rahman3
1Department of Civil and Environmental Engineering, Washington State University, Pullman, WA, USA
2School of Civil Engineering, Purdue University, West Lafayette, IN, USA
3Department of Civil Engineering, Bangladesh University of Engineering and Technology (BUET), Dhaka, Bangladesh
Email: *syeedmd.iskander@email.wsu.edu
Copyright © 2014 by authors and Scientific Research Publishing Inc.
This work is licensed under the Creative Commons Attribution International License (CC BY).
http://creativecommons.org/licenses/by/4.0/


Received 24 May 2014; revised 12 June 2014; accepted 5 July 2014
ABSTRACT
Trends and variability of annual precipitation total, annual number of rainy days and two climate change related precipitation indices named Simple Daily Intensity Index (SDII) and Precipitation Concentration Index (PCI) have been investigated in this study. The analysis was based on daily and monthly precipitation data of 35 observatory stations all over Bangladesh for the study period of 1971-2010. Mann Kendall test was performed to detect the trend and Sen’s slope method to determine the magnitude of change. The results indicate statistically significant (95% confidence level) negative trend in 4 stations and significant positive trend in 2 stations for annual precipitation total. Significant positive trend in 9 stations for annual number of rainy days, significant negative trend in 6 stations for SDII and for PCI, and significant negative trend in 6 stations were found all over Bangladesh in this study. The values of PCI indicate strongly irregular precipitation distribution in South Eastern Region (SER) and mostly irregular distribution in other regions. On the other hand values of SDII indicate strong precipitation intensity in SER and mostly moderate intensity in other regions all over the country.
Keywords:Bangladesh, Climate Change Indices, Precipitation, PCI, SDII

1. Introduction
Climate variability and its unfriendly concomitants are of growing concern worldwide. The climate of Bangladesh is undergoing changes and extremes are becoming more unprecedented every year. Floods, cyclones or droughts are often in its colossal mood here, which are aggravated by climate change and its variability being experienced more frequently in Bangladesh than ever before. Change of precipitation trends is in its way because of climate change. According to the intergovernmental panel on climate change (IPCC) report [1] , Bangladesh will experience 5% to 6% increase of rainfall by 2030. Bangladesh has been termed by IPCC as one of the most vulnerable countries in the world, which is prone to climate change. Global warming induced changes in temperature and rainfall are already evident in many parts of the world, as well as in this country [2] . High intensity of rainfall and uneven temporal and spatial distribution is creating flooding and longer dry spells are evoking droughty conditions [3] . As a whole, these have profound impact on agriculture [4] and food security of the country will be at risk [5] .
In the past three decades, higher Precipitation Concentration Index (PCI > 20) has been recorded in semi-arid and tropical humid environments in the cardamom hill slopes, south western ghats, India, which implies very long dry periods for up to 3 - 5 months [6] . During the last 50 years, Simple Daily Intensity Index (SDII) values for the countries of the western Indian Ocean have been showing significant negative trend for most of the observatory stations and positive trend in only a few of the stations [7] . Specifically for Bangladesh, although a number of studies have been carried out on average precipitation and temperature pattern [8] -[11] , research on intensity and distribution of rainfall has hardly been done.
2. Data and Methodology
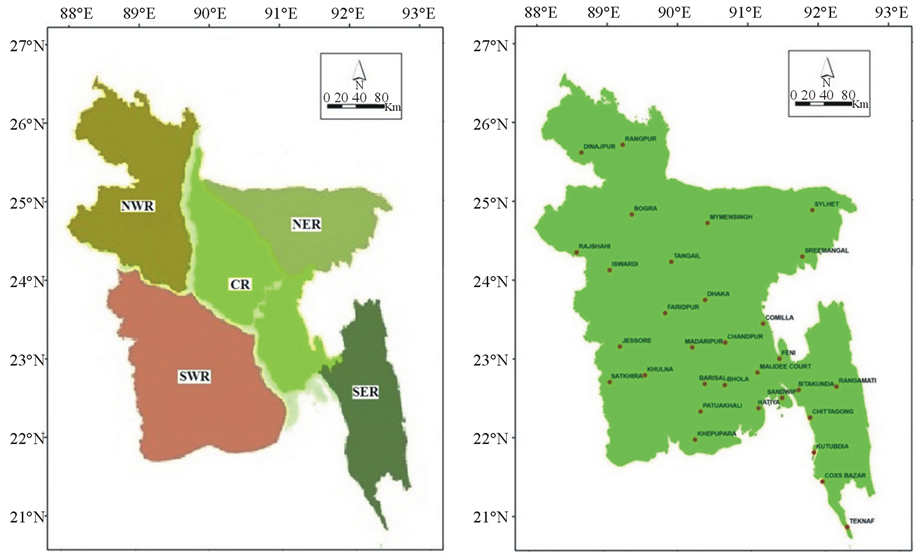
Daily and monthly precipitation data of 35 BMD (Bangladesh Meteorological Department) stations (Figure 1) were used for this study. For the convenience of analysis, whole study area was divided into five regions as North Western Region (NWR), North Eastern Region (NER), Central Region (CR), South Western Region (SWR) and South Eastern Region (SER) (Figure 1).
The Simple Daily Intensity Index (SDII) [7] [12] is defined as follows:
Let RRwj be the daily precipitation total for the wet days W (RR ≥ 1 mm) in period j. If W is the number of the wet days within the period j, then:
 (1)
(1)
The Precipitation Concentration Index [6] [13] , being proposed as an indicator of rainfall concentration and rainfall erosivity [14] , was calculated on an annual scale for each station according to Equation (2):
 (2)
(2)
where Pi is the monthly precipitation in month i and Pt is the annual precipitation total. Table 1 lists different value ranges of SDII and PCI with their relative significances.
Mann-Kendall test [15] [16] was used to analyze the trends in annual rainfall total, annual number of rainy days, SDII and PCI; in addition, the Sen’s slope method [17] was applied to determine the magnitude of change. Confidence level of 95% was taken as threshold to classify the significance of positive and negative trends.
3. Results and Discussion
SDII and PCI both are extreme precipitation indices which measure intensity and distribution uniformity of rainfall events respectively. SDII depends on annual rainfall amounts and annual number of rainy days. Therefore, trends of both annual rainfall amounts and annual number of rainy days have effects on trends of SDII. Mann-Kendall trend test values for annual rainfall amounts, annual number of rainy days, SDII and PCI are shown in Table 2 and Figure 2. Results show insignificant negative trends in 15 stations, significant negative trends in 4 stations, insignificant positive trends in 14 stations and significant positive trends in 2 stations for annual rainfall amounts. For annual rainy days, the numbers are 11, 0, 15, and 9; for SDII the numbers are 17, 6, 12, and 0 and for PCI the numbers are 15, 6, 14, and 0 respectively.
 (a) (b)
Figure 1. (a) Study area with regions: Bangladesh (b) BMD stations.
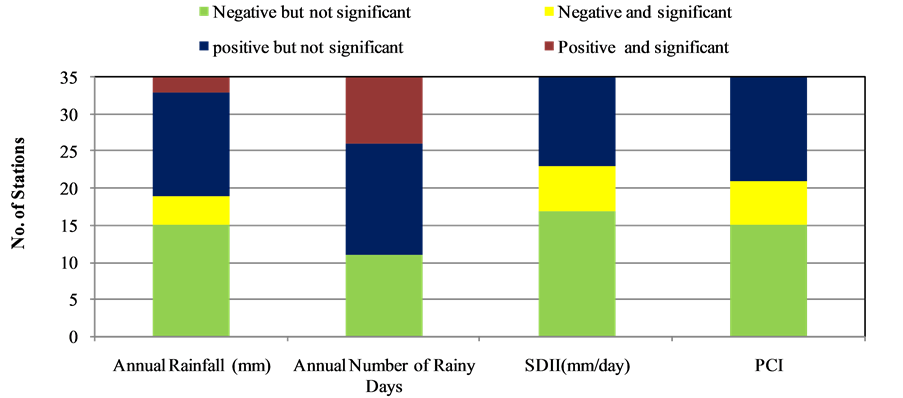
Figure 2. Summary of the results obtained for the trends of the four study parameters using Mann-Kendall test.

Table 2. Trends of annual rainfall total, annual number of rainy days, SDII and PCI for the study period at different BMD stations.
The asterisk (*) denotes statistically significant figures at 95% confidence level.
Intensive rainfall can be uniform if it occurs all over the time period, but if it occurs within a short instance of the time period then its distribution can be called irregular. Accordingly, when both SDII and PCI shows similar trend, rainfall will become uniform and less intensive (decreasing trend) or irregular and intensive (increasing trend). On the contrary, when the two trends are opposite, outcomes may be uniform and intensive or irregular and less intensive. Thus, in NWR and NER rainfall tends to be uniform and less intensive (Table 2). In other regions mixed effects are evident.
Six cases of SDII trend change related to the trend of annual rainfall amounts and annual number of rainy days are detected in this study (shown in Table 3). In case-I, trends of SDII increase although trends of both annual rainfall amounts and annual number of rainy days decrease. It may be due to the milder trend declination of annual rainfall amounts compared to the annual number of rainy days. In case-II, increasing trend of annual rainfall amounts is steeper than that of annual number of rainy days. Cases III and VI (Figures 3(a)-(c)) are
 (a)
(a) (b)
(b) (c)
(c) (d)
(d)
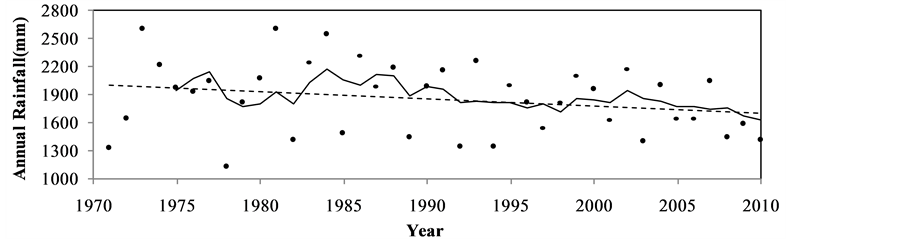
Figure 3. Temporal evolution of (a) Annual rainfall amounts (mm) (b) Annual number of rainy days (c) SDII (d) PCI in Faridpur (one of the BMD stations) for the study period of 1971-2010 along with 5- year moving average (black line) and linear trend (dotted line).
easy to understand as Equation (1) explains. Cases IV and V are the opposite of cases I and II.
The values of PCI shows irregular to strongly irregular precipitation distribution in North Western Region (NWR) and mostly strong irregularity in South Eastern Region (SER); also irregular distribution is evident in Central Region (CR), North Eastern Region (NER) and South Western region (SWR) (Table 4). While the values of SDII shows moderate to high precipitation intensity in NWR, moderate to strong intensity in CR and
Table 3 . Cases of SDII change (1971-2010).
Table 4. Average value of SDII and PCI for the study period at different BMD stations and their significance according to values (Table 1).
NER, mostly strong intensity in SER and low to very strong intensity in SWR (Table 4).
Spatial distribution of trends for annual rainfall amounts (mm), annual number of rainy days, SDII and PCI over the study period of 1971-2010 is shown in Figure 4. Annual rainfall amount (mm) decreases over the central region (maximum significant negative trend of −24.41 mm/year in Chandpur), and increases in south eastern region (maximum significant positive trend of 19.13 mm/year in Teknaf) (Figure 4(a)) and mixed changes prevail over other regions. Annual number of rainy days increases over eastern and northern parts (maximum significant positive trend of 0.889 day/year in Srimangal) and decreases in central part (Figure 4(b)). SDII shows mixed spatial trends and decrease over northern and southern part; also in central part decreasing pattern is prevalent (Figure 4(c)). Trends of PCI (Figure 4(d), Figure 3(d)) show decrease over northern and south eastern parts and increase over south western region.
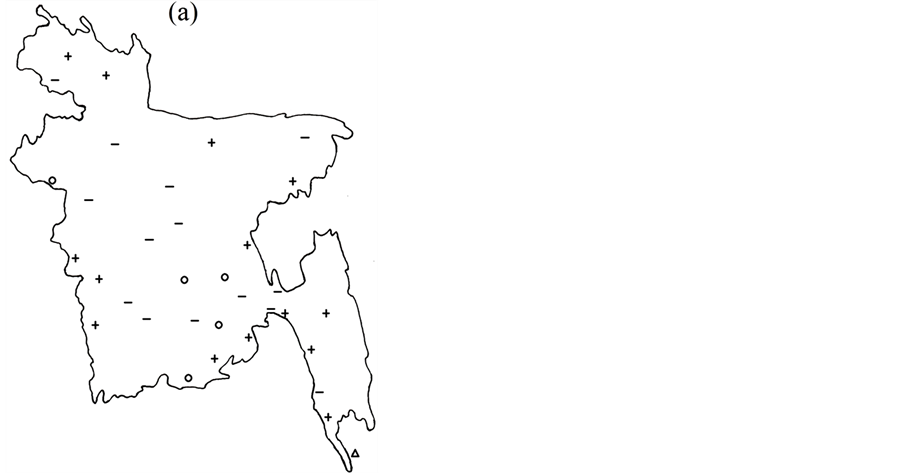
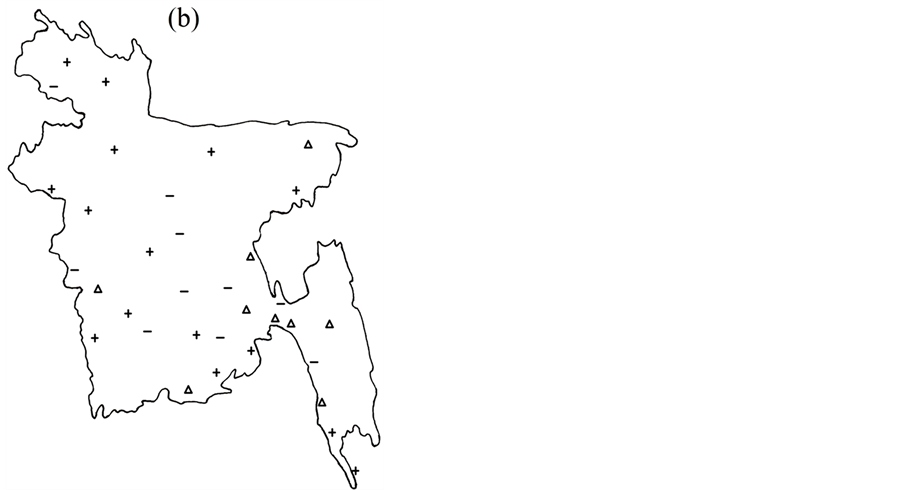

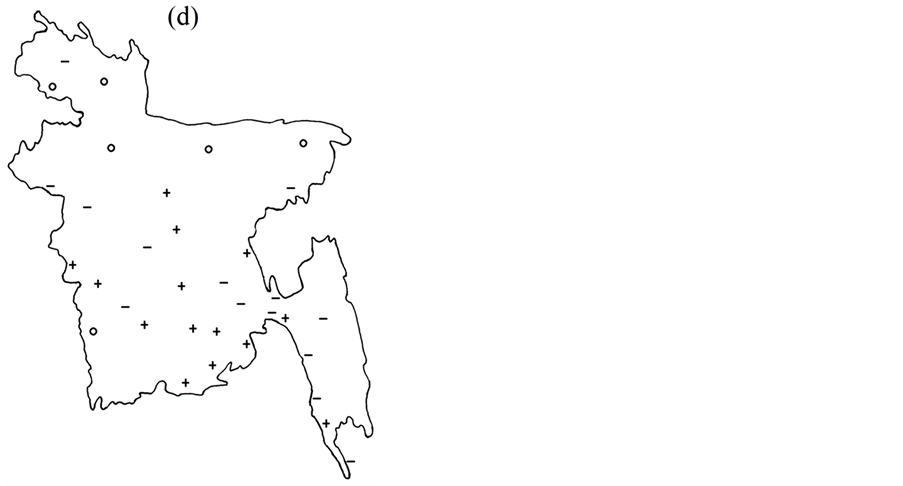
Figure 4. Spatial distribution of trends of (a) Annual rainfall amounts (mm) (b) Annual number of rainy days (c) SDII and (d) PCI over the study period of 1971-2010 (+ for positive, − for negative, o for negative and significant, ∆ for positive and significant change).
As a whole, this paper shows a guideline to apply climate indices in detecting intensity and temporal distribution of precipitation pattern on regional scale. Our analysis yields some grimacing results for South Eastern Region (SER) and a little part of South Western Region (SWR) (Sitakunda, Sandwip, Hatya) since precipitation is of high intensity and strong irregularity there. Such irregular and highly intensive precipitation can have high erosion-potential. This may reduce the elevation of these regions over mean sea level making it prone to being engulfed by the sea as sea water surface is continually rising due to climate change [1] .
Due to erosion, silt charges in river water increase. Consequently conveyance capacity of river gets low as silts settle down to the river bed. This can cause longer lasting floods. Moreover, due to sudden highly intensive rainfall, flash floods and water clogging may occur in cities due to the lack of drainage facilities. Bangladesh is a country which largely depends on its agriculture and hydroelectricity. So the findings of this study can also be useful for developing various decision-support tools in different hydrologic, ecological and agricultural applications.
Acknowledgements
Contribution of Bangladesh Meteorological Department (BMD) for providing the necessary meteorological data is acknowledged here.
References
- White, K.S., Eds. (2007) IPCC 2007: Impacts, Adaptations and Vulnerability: Contribution of Working Group II to the Fourth Assessment Report of the Intergovernmental Panel on Climate Change. Cambridge University Press, Cambridge.
- Ahmed, A.U. and Alam, M. (1998) Development of Climate Change Scenarios with General Circulation Models. In Huq, S., Karim, Z., Asaduzzaman, M. and Mahtab, F., Eds., Vulnerability and Adaptation to Climate Change for Bangladesh, Kluwer Academic Publishers, Dordrecht, 13-20.
- Lai, M., Whettori, P.H., Pittodi, A.B. and Chakraborty, B. (1998) The Greenhouse Gas Induced Climate Change over the Indian Sub-Continent as Projected by GCM Model Experiments. Atmospheric and Oceanic Sciences, 9, 663-669.
- White, K.S., Eds. (2001) IPCC 2001: Impacts, Adaptations and Vulnerability: Contribution of Working Group II to the Fourth Assessment Report of the Intergovernmental Panel on Climate Change. Cambridge University Press, Cambridge, UK.
- Karim, Z., Hussain, S.G. and Ahmed, M. (1996) Assessing Impacts of Climatic Variations on Food Grains Production in Bangladesh. Journal of Water Air and Soil Pollution, 92, 53-62.
- Murugan, V., Mukund, R., Ramesh, M.B., Hiremath, A., Joseph, R.K. and Shetty, P.K. (2008) Centennial Rainfall Variation in Semi-Arid and Tropical Humid Environments in the Cardamom Hill Slopes, Southern Western Ghats, India. Caspian Journal of Environmental Sciences, 6, 31-39.
- Vincent, L.A., Aguilar, M., Saindou, A., Hassane, G., Jumaux, D., Roy, P., Booneeady, R., Virasami, L.Y.A., Randriamarolaza, F.R., Faniriantsoa, V., Amelie, H. and Montfraix, B. (2011) Observed Trends in Indices of Daily and Extreme Temperature and Precipitation for the Countries of the Western Indian Ocean, 1961-2008. Journal of Geophysical Research, 116, 39-45.
http://dx.doi.org/10.1029/2010JD015303 - Rajib, M.A., Rahman, M.M. and McBean, E.A. (2011) Global Warming in Bangladesh Perspective: Temperature Projections up to 2100. Proceedings of the Global Conference on Global Warming, Lisbon, 11-14 July 2011, 43-48.
- Rajib, M.A., Rahman, M.M., Islam, A.K.M.S. and McBean, E.A. (2011) Analyzing the Future State of Monthly Precipitation Pattern in Bangladesh from Multi-Model Projections Using Both GCM and RCM. Proceedings of the ASCE World Environmental and Water Resources Congress, California, 22-26 May 2011, 3843-3851. http://dx.doi.org/10.1061/41173(414)402
- Rajib, M.A., Mortuza, M.R., Selmi, S., Ankur, A.K. and Rahman, M.M. (2011) Spatial Drought Distribution in the Northwestern Part of Bangladesh. Proceedings of the Asian Conference on Sustainability, Energy and the Environment, Osaka, 2-5 June 2011, 568-575.
- Shahid, S. (2010) Rainfall Variability and Trends of Wet and Dry Periods in Bangladesh. International Journal of Climatology, 30, 2299-2313.
- Nastos, P.T., Evelpidou, N. and Vassilopoulos, A. (2010) Does Climatic Change in Precipitation Drive Erosion in Naxos Island, Greece. Natural Hazards and Earth System Sciences, 10, 379-382. http://dx.doi.org/10.5194/nhess-10-379-2010
- Oliver, J.E. (1980) Monthly Precipitation Distribution: A Comparative Index. Professional Geographer, 32, 300-309. http://dx.doi.org/10.1111/j.0033-0124.1980.00300.x
- Michiels, P., Gabriels, D. and Hartmann, R. (1992) Using the Seasonal and Temporal Precipitation Concentration Index for Characterizing Monthly Rainfall Distribution in Spain. CATENA, 19, 43-58.
- Mann, H.B. (1945) Nonparametric Tests against Trend. Econometrics, 13, 245-259.
http://dx.doi.org/10.2307/1907187 - Kendall, M.G. (1975) Rank Correlation Methods. Griffin, London.
- Sen, P.K. (1968) Estimates of the Regression Coefficient Based on Kendall’s Tau. Journal of the American Statistical Association, 63, 1379-1389.
http://dx.doi.org/10.1080/01621459.1968.10480934
NOTES

*Corresponding author.