Atmospheric and Climate Sciences
Vol.3 No.4(2013), Article ID:36686,9 pages DOI:10.4236/acs.2013.34046
Analysis of the Meteorological Variables for Puebla City 2011-2012 Applying the Modeling Ion-Wavelets in a Hypothetical Manner
1Engineering School, Benemérita Universidad Autónoma de Puebla, Puebla, México
2Research Center of Semiconductor Devices, Benemérita Universidad Autónoma de Puebla, Puebla, México
Email: rogelio.ramos@correo.buap.mx, patricia.maximo@correo.buap.mx
Copyright © 2013 Rogelio Ramos-Aguilar et al. This is an open access article distributed under the Creative Commons Attribution License, which permits unrestricted use, distribution, and reproduction in any medium, provided the original work is properly cited.
Received June 21, 2013; revised July 23, 2013; accepted July 30, 2013
Keywords: Wavelets; Gauss; Morlet; Variables; Model
ABSTRACT
This work presents the results of the analysis of meteorological variables applying the modeling Ion-Wavelets in a hypothetical manner. In this case the Morlet wavelet transform is used, which is the result of a huge number of researches made in the 80’s and applied to various physical phenomena derived from natural chaotic processes; the data were processed using the phenomenon “El Niño” and CO2 (Carbon dioxide) due to the fact that these are the meteorological phenomena which best adapt to our object of study correlating with distribution of Gauss and Morlet during the study period in the Puebla Valley.
1. Introduction
This case is using the Morlet wavelet transform which is the result of a huge number of researches made in the 80’s and applying to various physical phenomena derived from natural chaotic processes, it says a complex understanding and development which constitutes recent analysis technique.
This term is defined as a small wave or localizable function in time for the representation and signals segmentation in the time-frequency study.
The Morlet wavelet transform has begun to be applied in different fields for instance astronomy, acoustic, nuclear engineering, earthquake detection, image compression, optics, MRI, radar, meteorology, etc. [1,2].
The Wavelet analysis, whose mathematical basis is similar to the Fourier Theory, decomposes a temporary series in the domains of time and frequency, which turns into an appropriate analysis for the study of non-stationary series that contain variability in different temporary scales, which is the case of meteorological series. With the decomposition in the domains of time and frequency, it is feasible to obtain both the most important modes of temporary variability and their evolution in time; this also allows the location in time of oscillatory signals of very short duration [3].
It was utilized the following Gaussian wavelet for the variables of temperature, energy and rainfall.
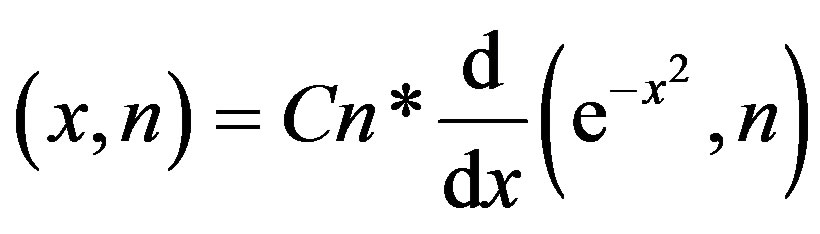 Model 1 where Cn is a constant determined for 2-norm de gauss (x,n) = 1; where just is possible perform the wavelts continuous transform which can be symmetrical or asymmetrical depending on the value of n [4].
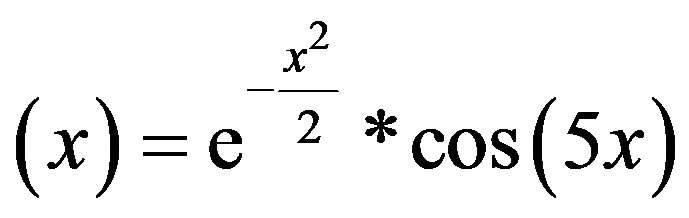
Subsequently, El Niño and CO2 programs were utilized for applying the Morlet wavelet transform whose mathematical model is expressed as:
 sec. 2 to co-relate the thermal peaks to the rainfall points during the months analyzed.
2. Data Processing in Morlet Wavelet Transform
The first thing to consider is the shape of the wavelet, for decomposing “El Niño data”, we chose the Morlet wavelet because: it looks like a wave, it is commonly used, and it's simple.
The base data were processed in Ion Wavelet, which is a program developed for the analysis of continuous variables like the meteorological ones, as it requires only the analytical instrumentation. Registered data can be processed through different models such as El Niño phenomenon, Monzon, CO2 and Sunspots. In this case, they were processed only by El Niño phenomenon and CO2, due to the fact that these are the meteorological phenomena which best adapt to our object of study [5].
Remember that El Niño phenomenon is a cyclical climate process which provokes havoc worldwide, affecting mostly South America and the areas between Indonesia and Australia, causing warming of Pacific waters; using this model in a hypothetical manner to understand the possibility of climatic change caused for this process in the centre of Mexican Republic, more specifically in Puebla city [6].
The Morlet wavelet is used, and the transform is performed in Fourier space. To reduce wraparound effects, each time series is padded with zeros [7].
The Morlet wavelet consists of a complex exponential modulated by a Gaussian, where t is the iv t/s 2t2/(2s2) e 0 e time, s is the wavelet scale, and v0 is a nondimensional frequency. For v0 5 6 (used here), there are approximately three oscillations within the Gaussian envelope. The wavelet scale s is almost identical to the corresponding Fourier period of the complex exponential [8, 9].
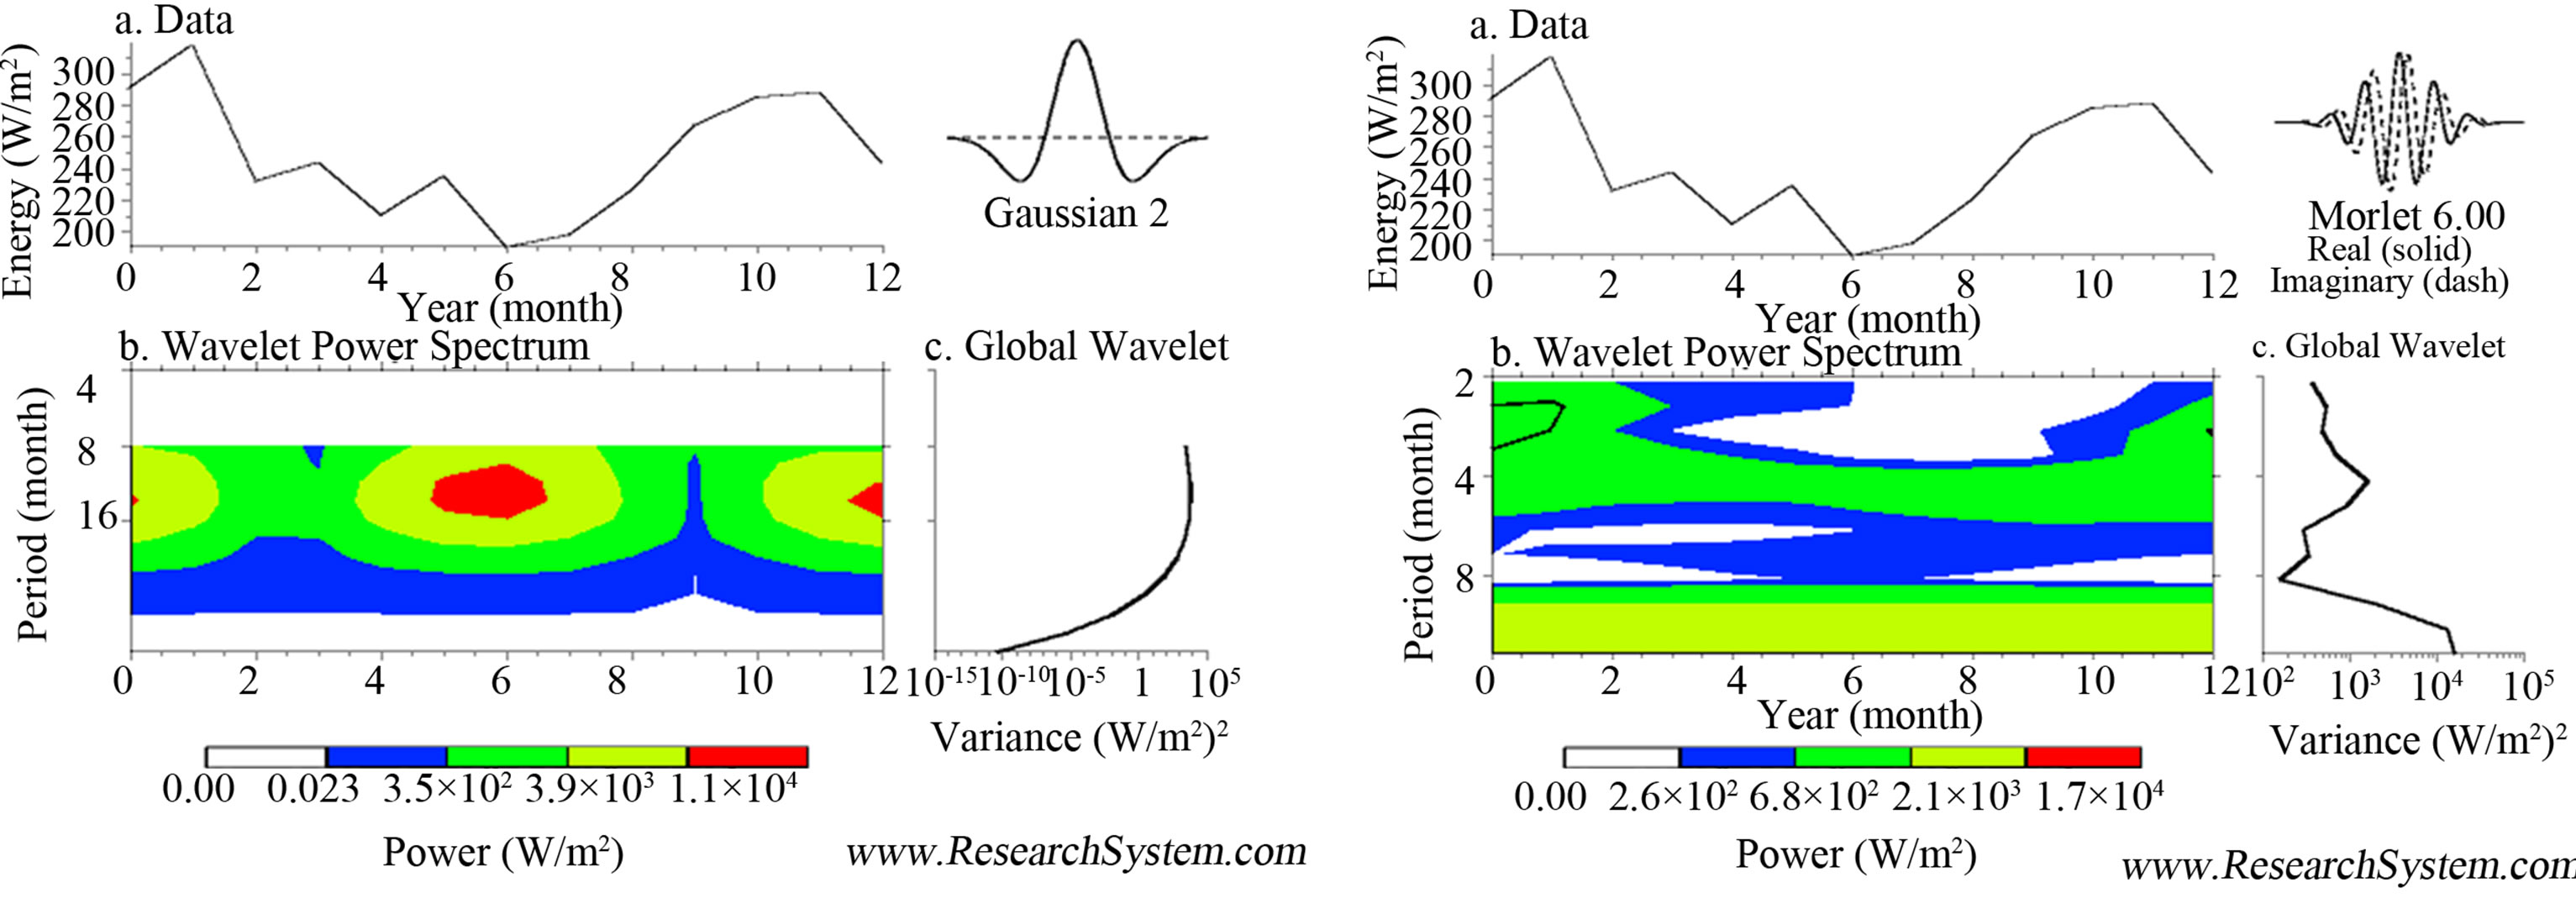
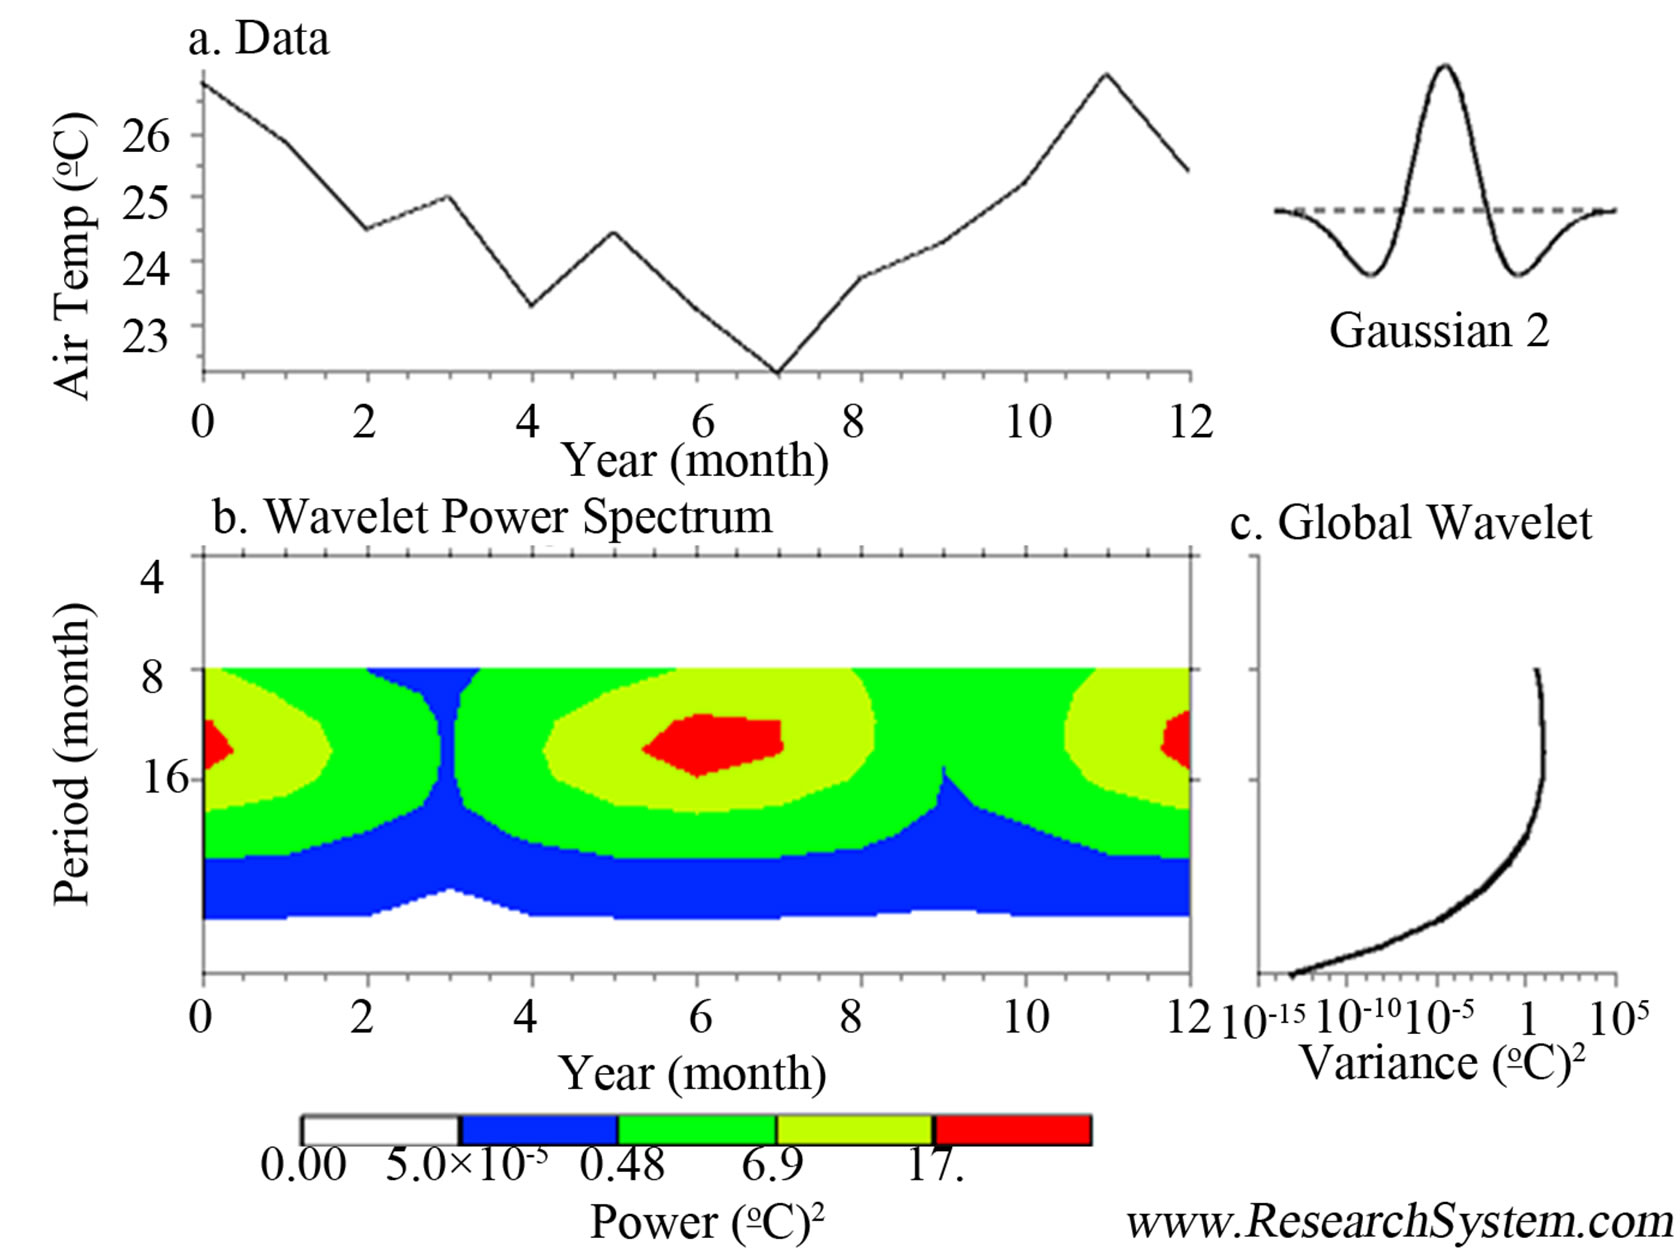
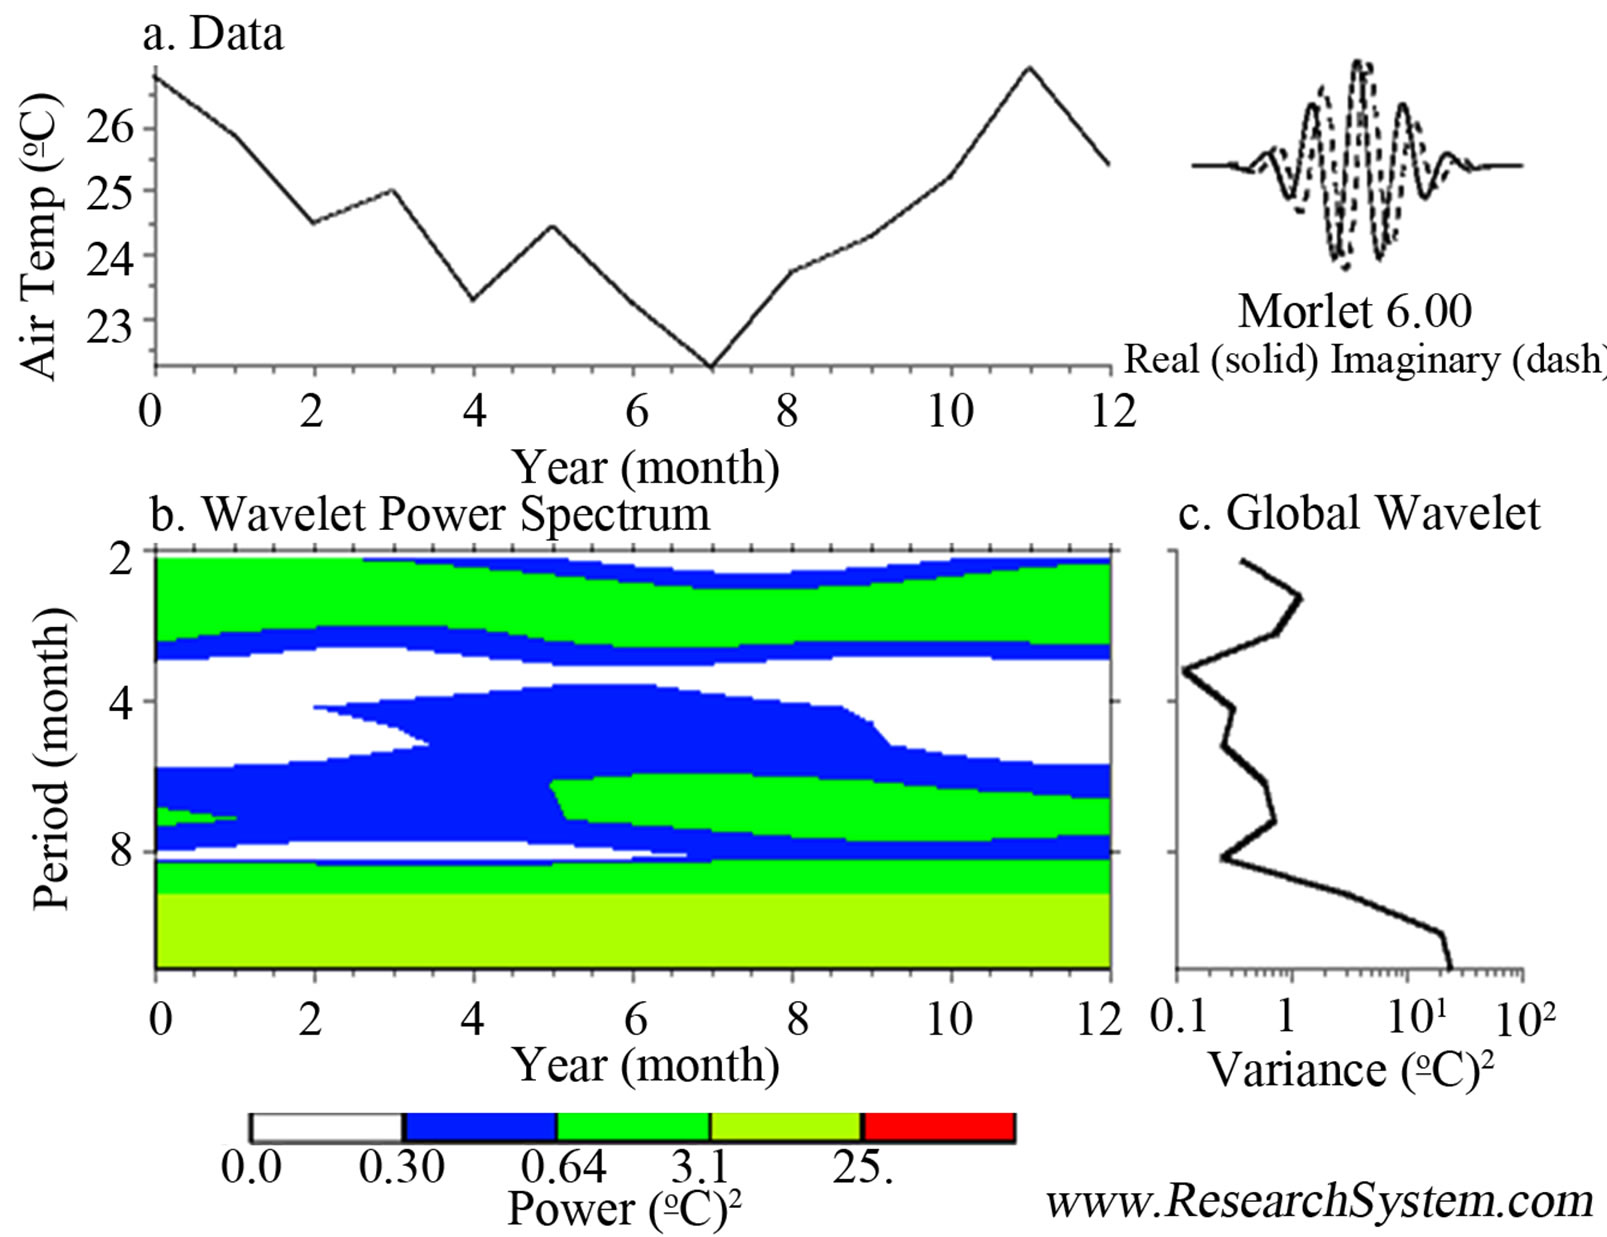
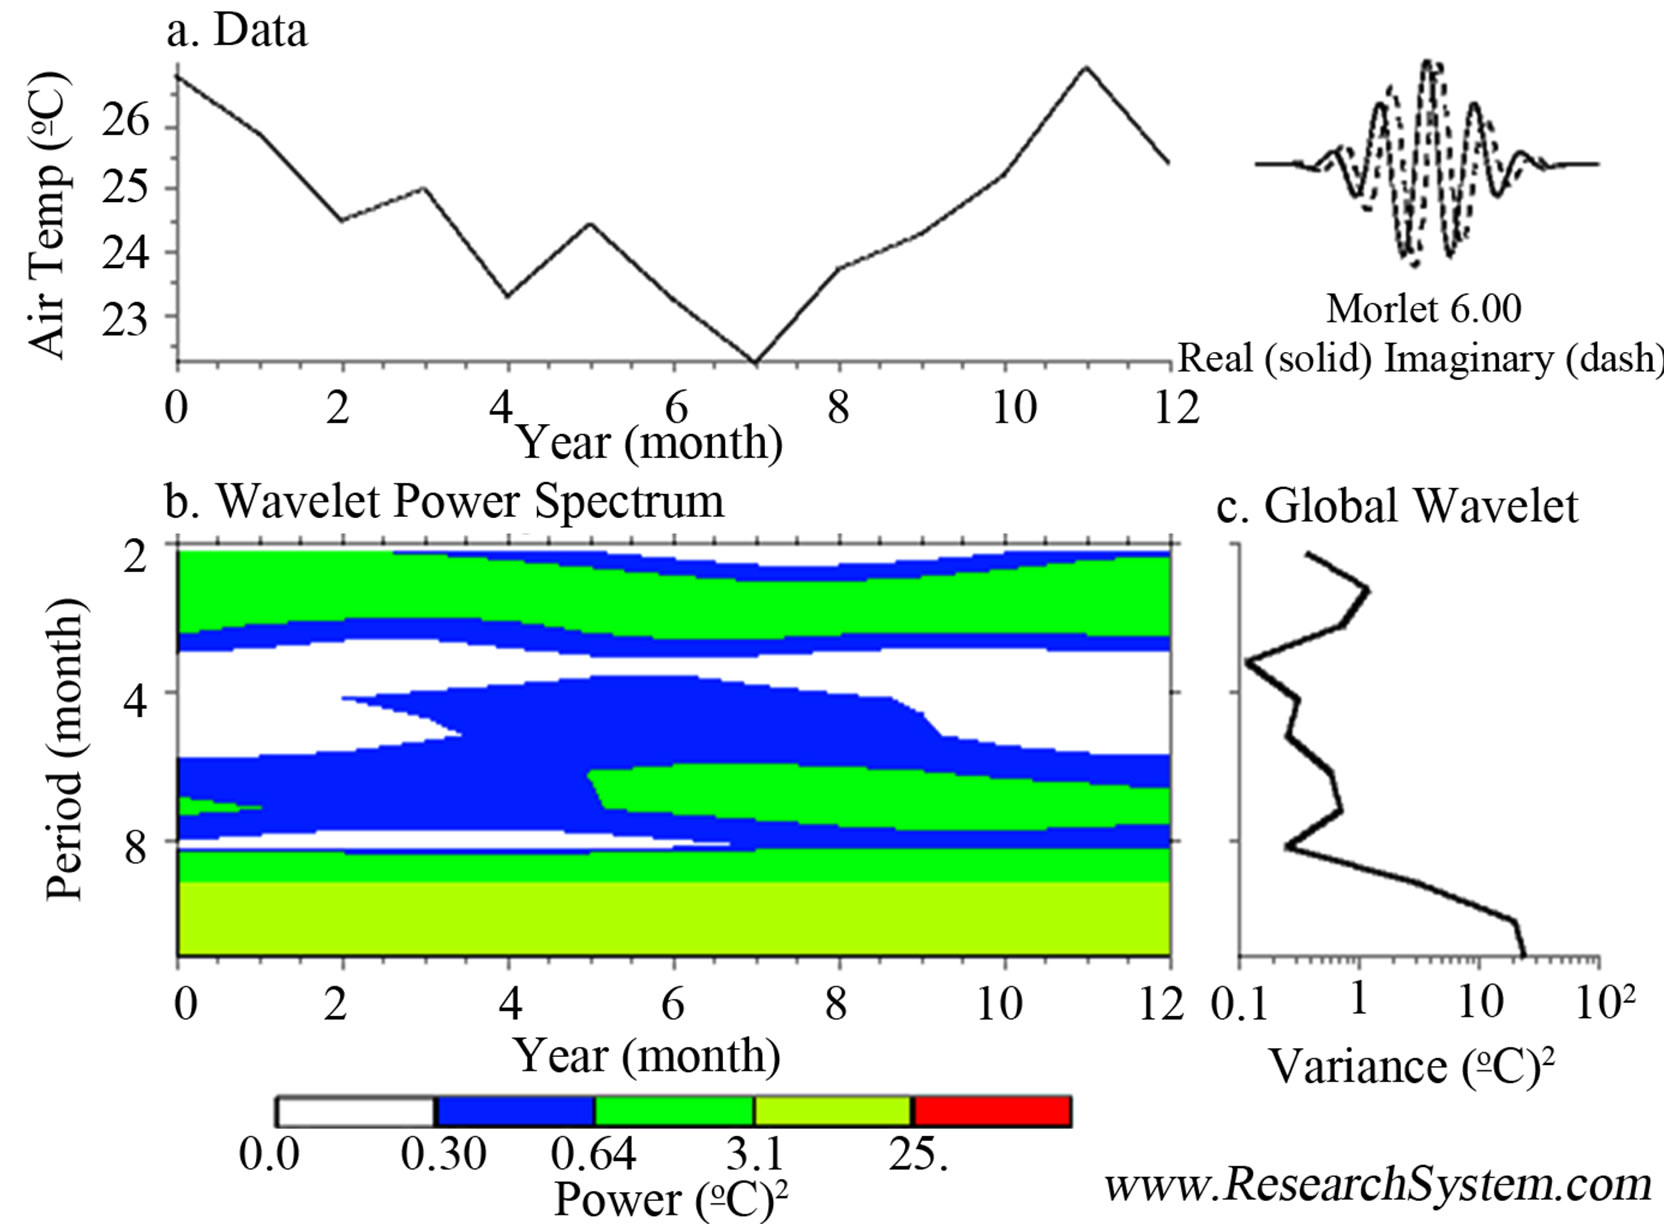
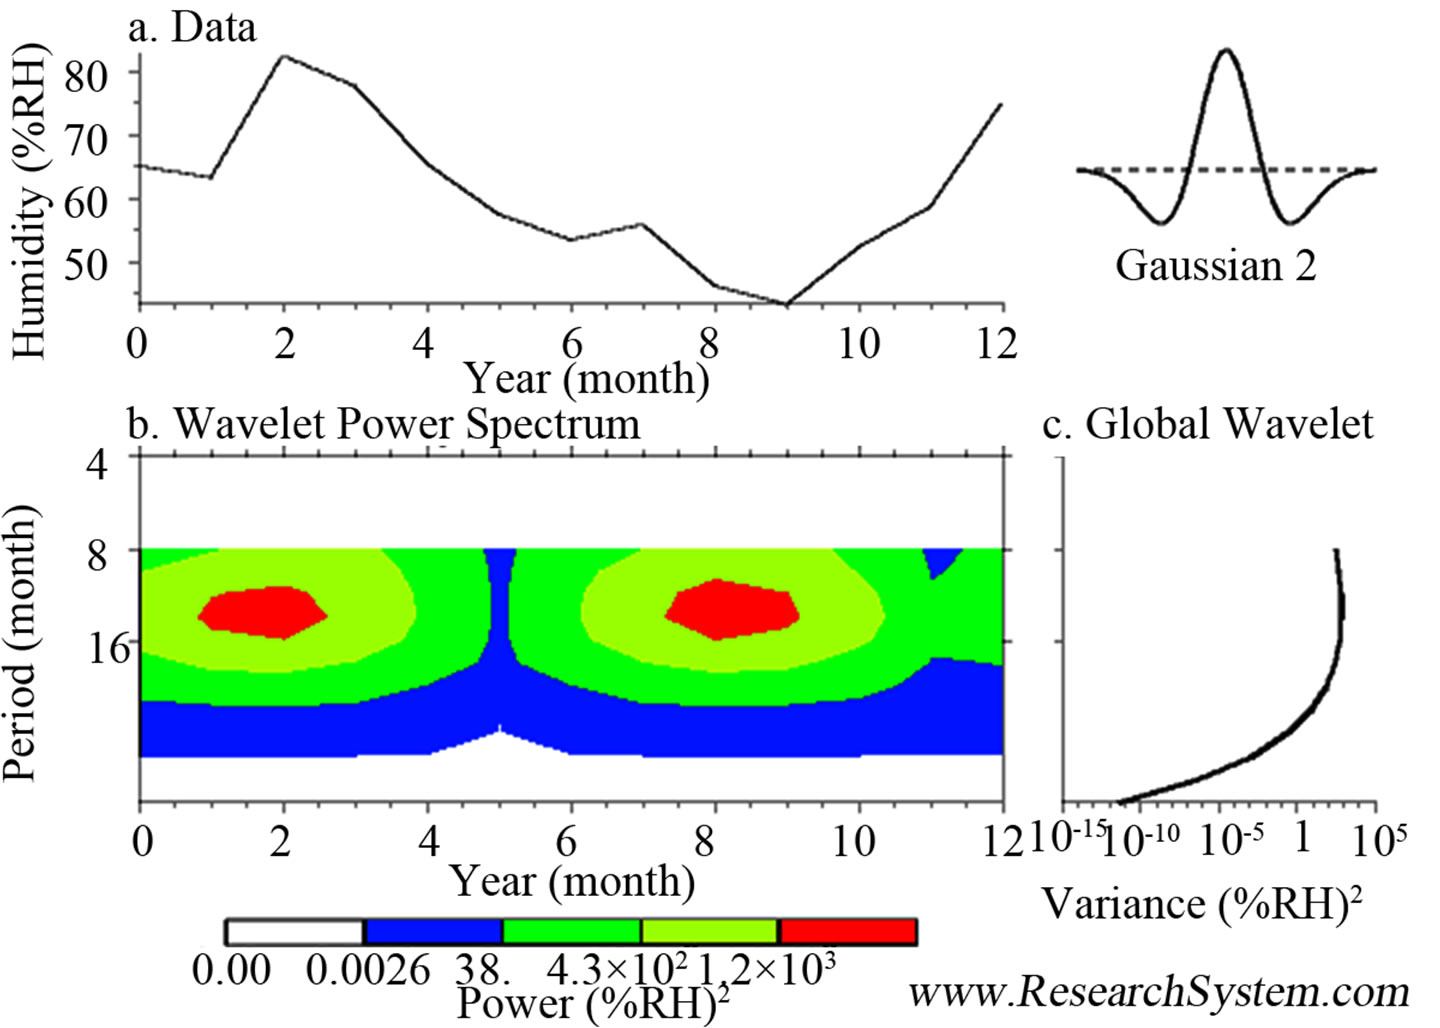
The relationship between the phenomenon El Niño and CO2 is ideal to this study due to the meteorological conditions that could be reflected in the behavior of the winds, temperature, rainfall and solar radiation; also the constant pollution of CO2 that occur in the capital and their probable relation between them; After this, the reconstruction signal of the Wavelet transform is utilized (See Figure 1).
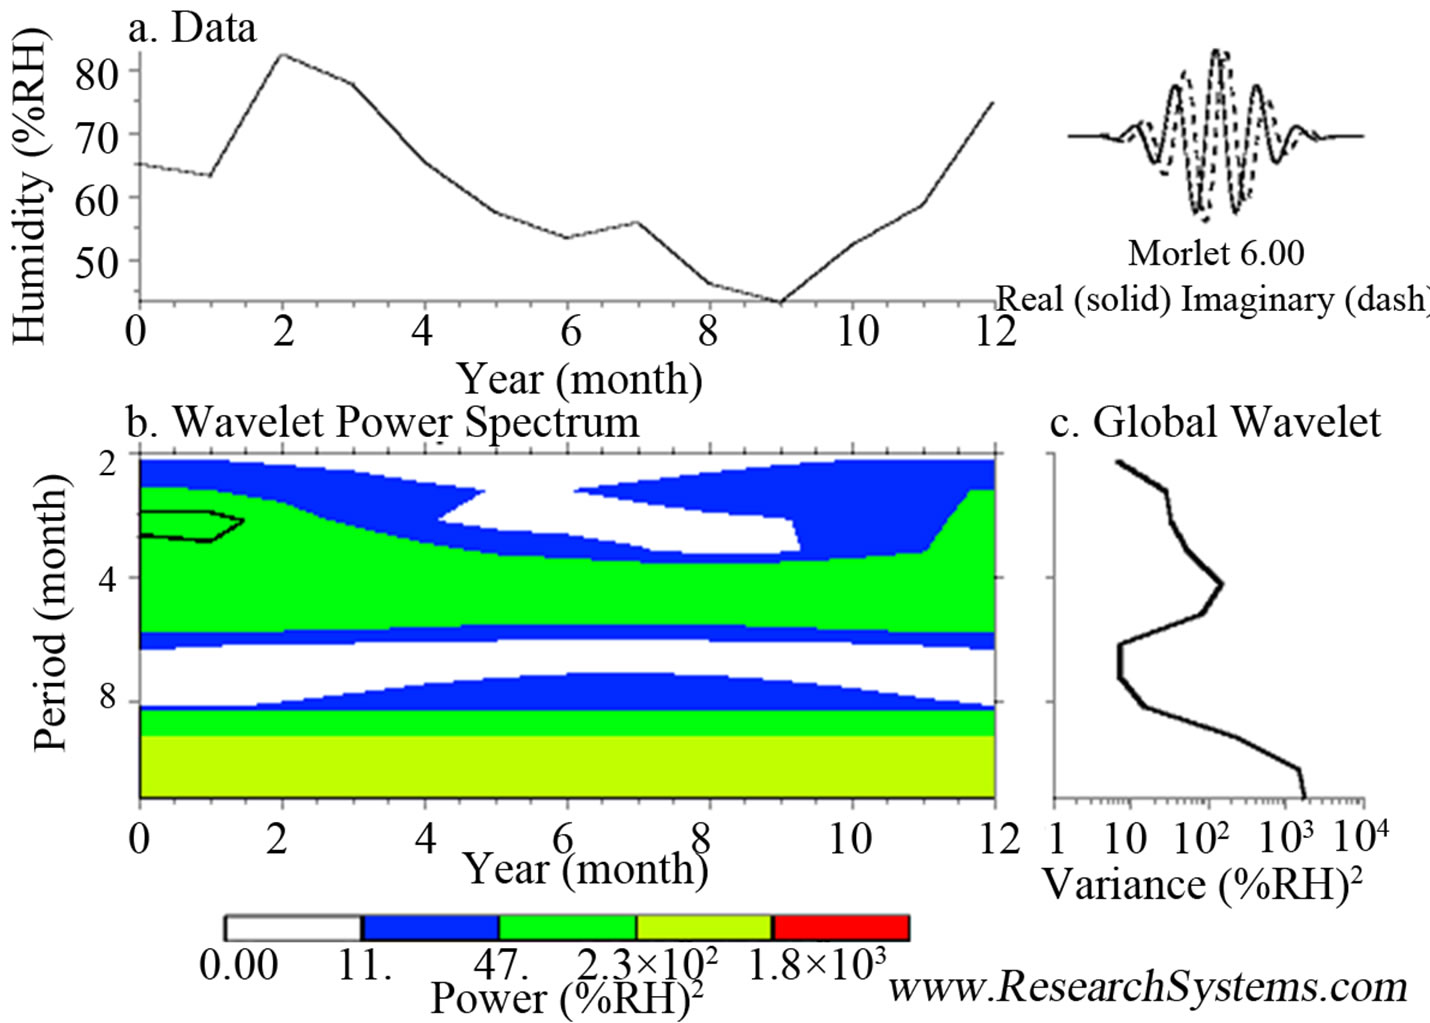
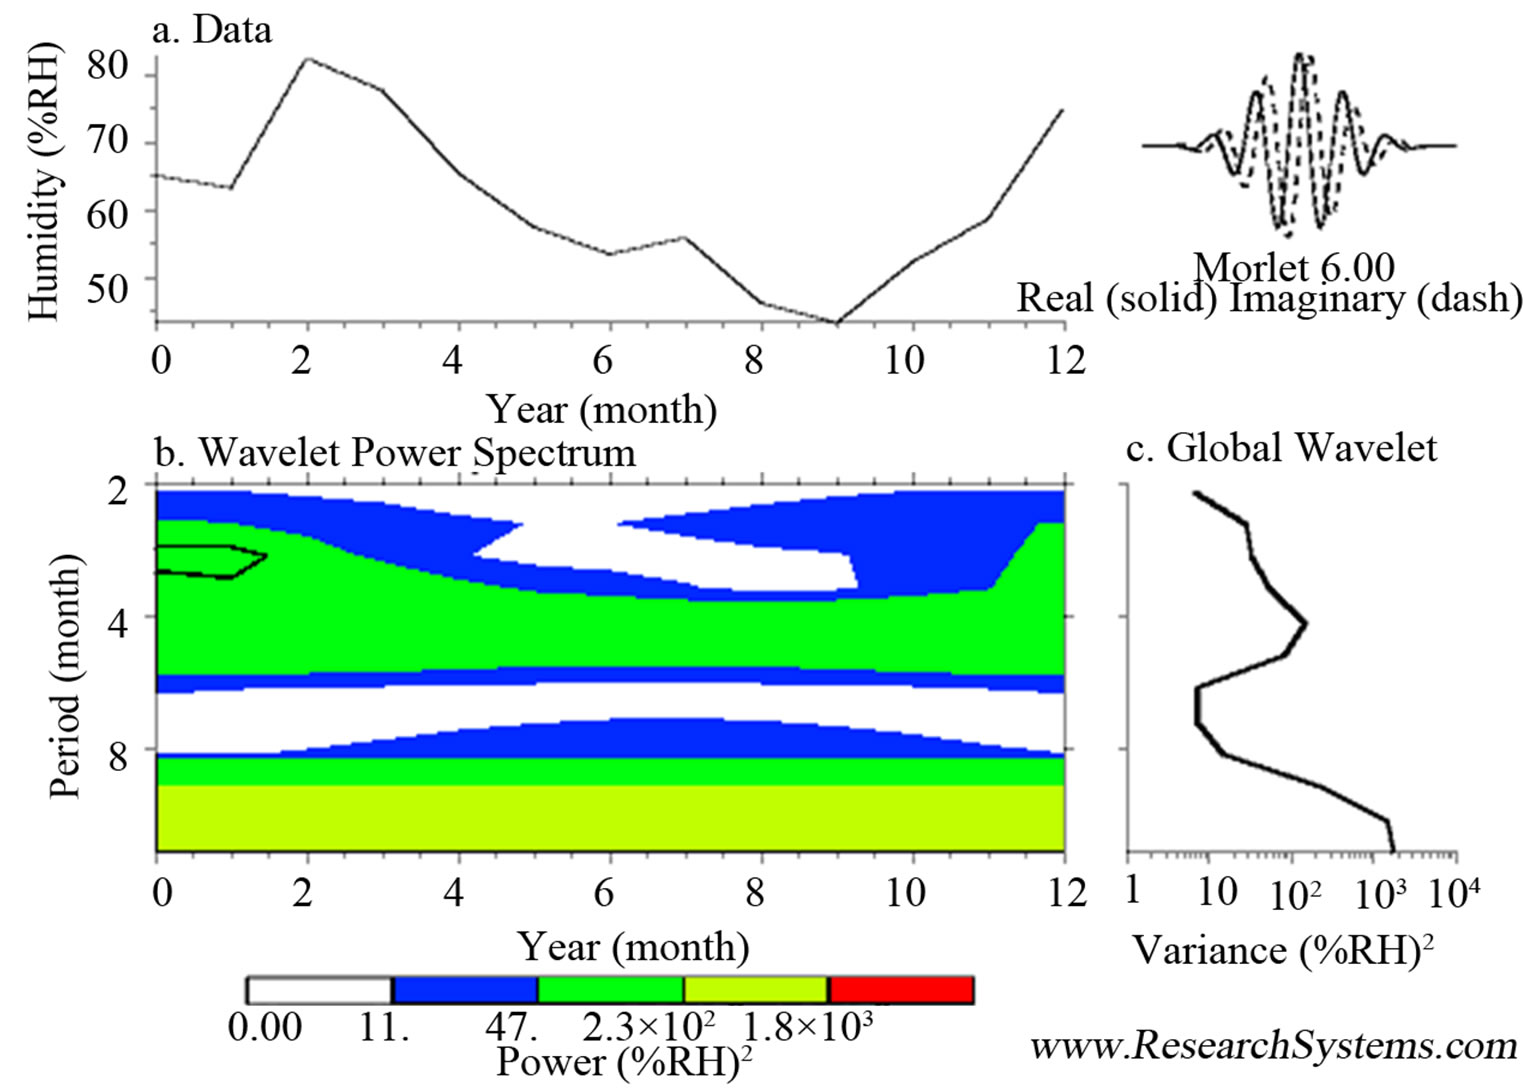
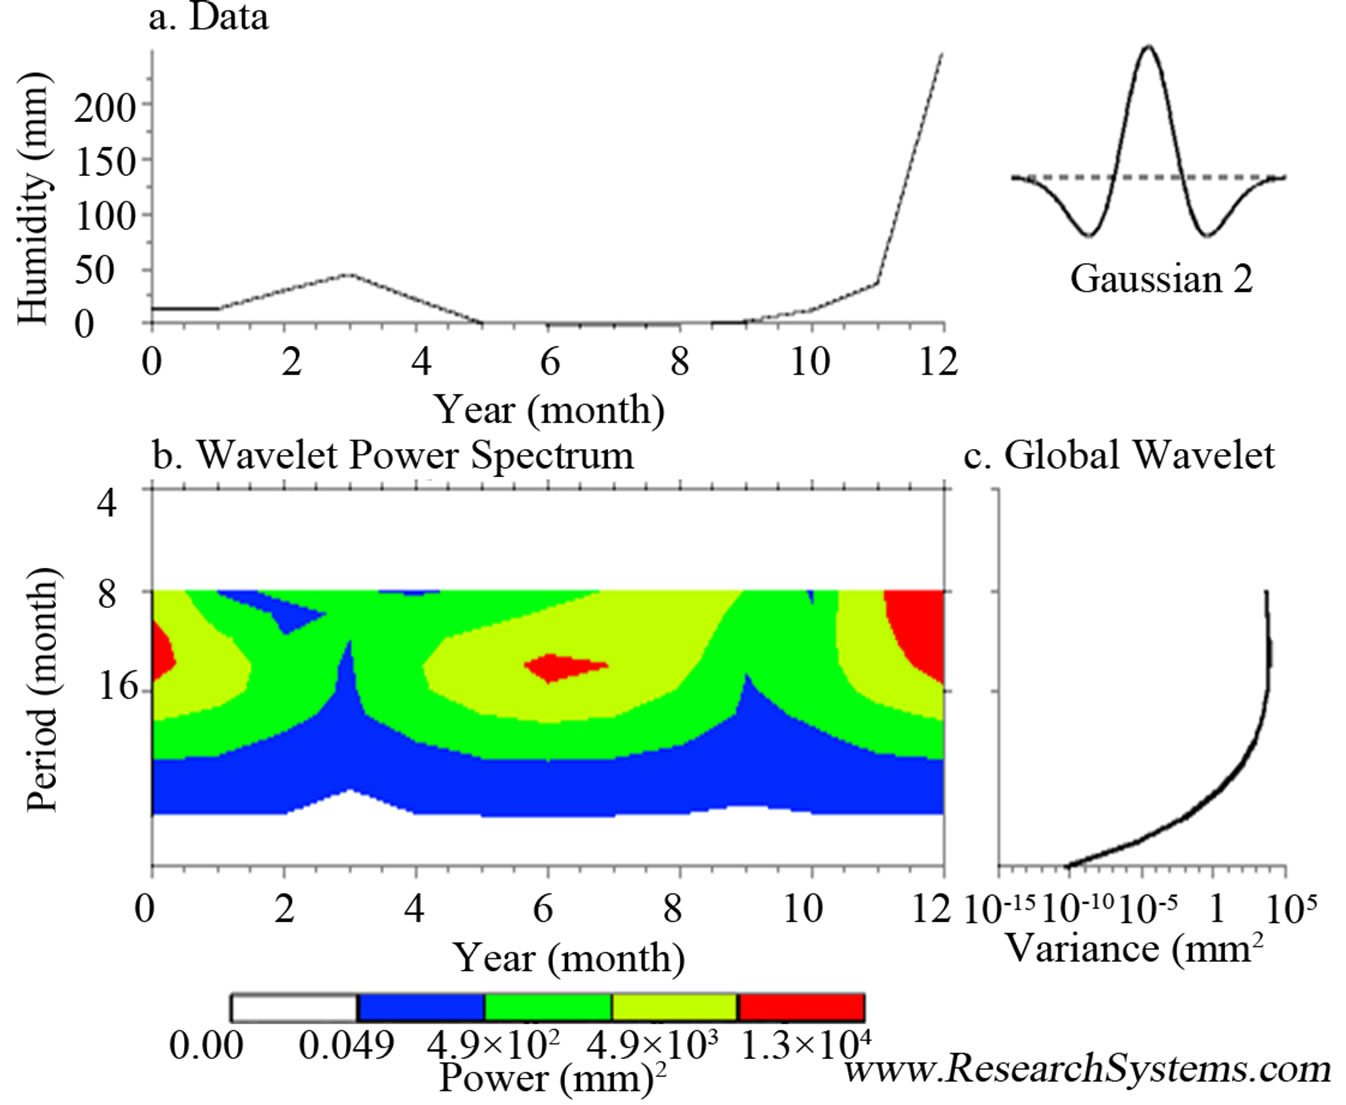
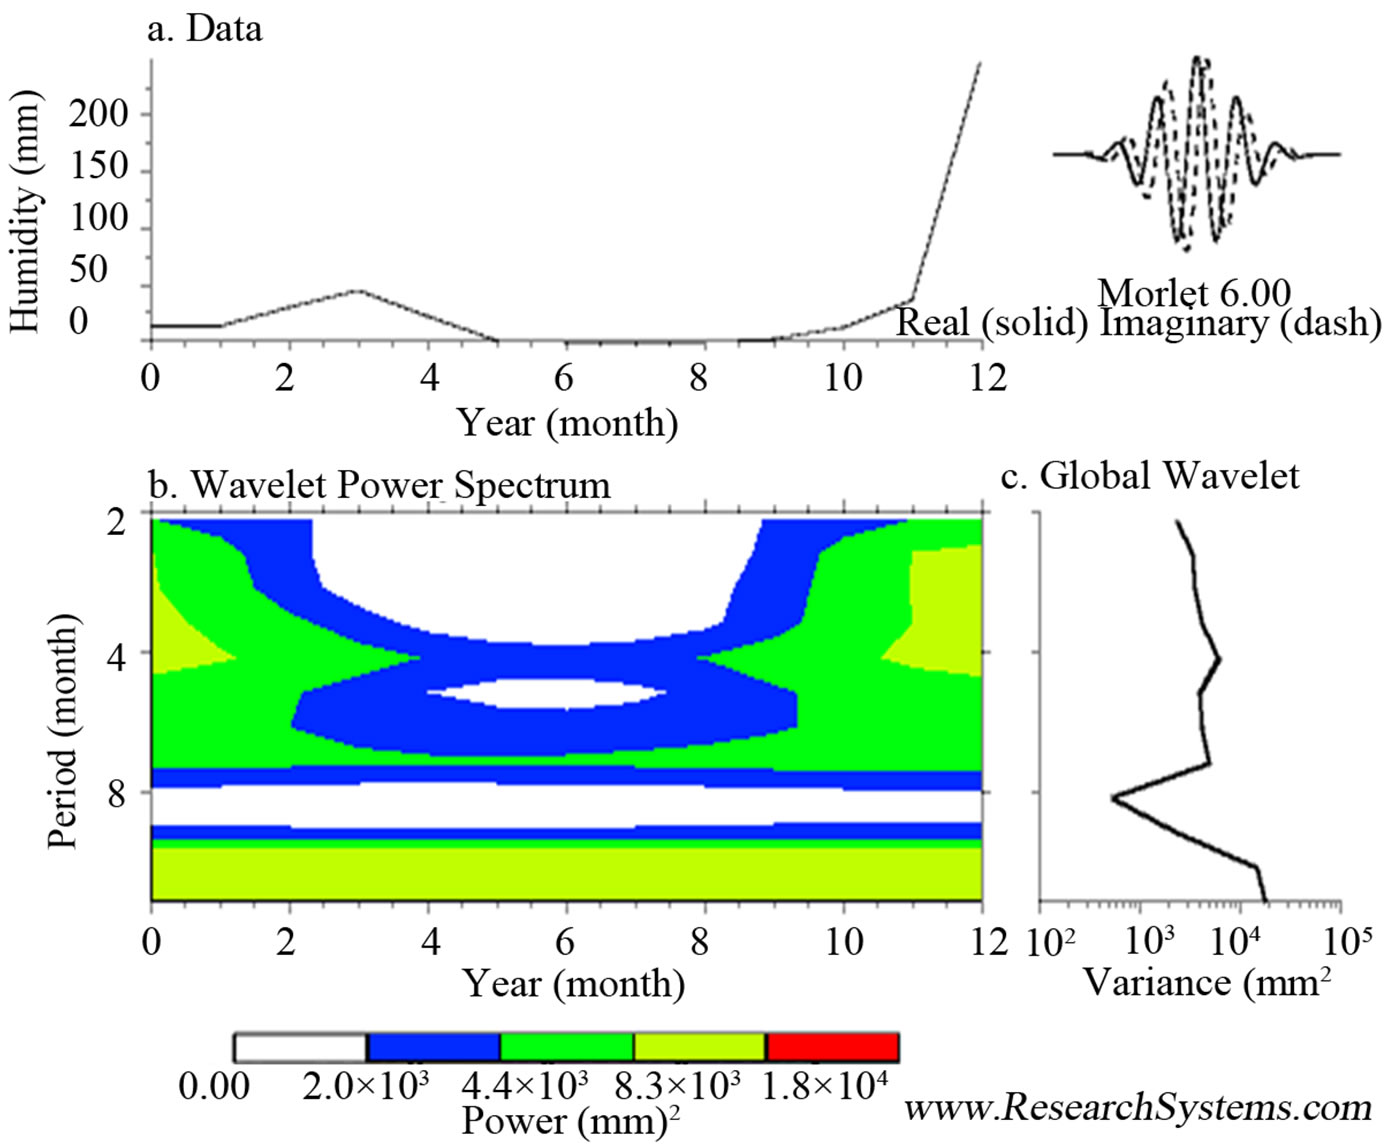
This model allows analyzing the data through a 2D graphic that is generated in the processing. In axis “x” is located in the time scale and the “y” axis scale analysis; using only Gauss and Morlet algorithms. In the Wavelet spectrum appear located in the temporal space areas where there is increased energy accumulation. It is interesting see how the accumulation of solar energy, temperature, humidity and rainfall are distributed over time at different time scales (Ramos, R. et al. 2003).
The study of the graphs it is useful to understand the behavior of the processed variables during the time of the study 2011-2012.
3. Weather Variables Modeling in Puebla City
El Niño phenomenon (EN) and CO2 (C) models were applied: a) according to the characteristics of Puebla Valley, b) depending on atmospheric conditions and pollutants (including Popocatepetl volcano) and c) to correlate the results and models obtained between the processed meteorological variables and those which might be affected by some pollutant; resulting in the 2D modeling. El Niño phenomenon is the normal atmospheric circulation in the Pacific and the convergence of Northwest and Southeast winds on the surface, which causes a convective cell related to temperature, humidity and rainfall [10].
Data processing, the creation of these models and the results will be useful in the near future to follow up important climate variations related to global warming. (EN) was applied to the variables of temperature, humidity, rainfall and energy in the months of June-July-December 2011 and May-June 2012, as they are representative months according to the variations of the analyzed variables. In this analysis the period of rain begins in May, with high humidity, important rainfall and constantly varying energy. Within this month, the Earth’s surface receives energy proceeding from the Sun in the form of electromagnetic radiation: absorbs heat and emits radiation in the infrared range, so that this would generate a constant source of energy to maintain the whole flow of the atmosphere [11].
The energy which Puebla Valley’s surface receives depends on the incidence angle of the rays and altitude; temperature remains relatively continuous.
Figure 1 (subsections a to d) shows graphs and spectrums obtained from the processed variables.
The result of (EN) suggests an alteration in the system of normal average rainfall; falling behind the rainy season in 2011 and, in 2012, entering a normal process from May; i.e. there is a clear relationship of El Niño activity in the Valley of Puebla in annual period studied.
Using (C), the pollution factor of carbon dioxide is not important for the Valley of Puebla yet. The result of the processed variables is identical to (EN), i.e. in this model, there is no atmospheric alteration with carbon dioxide.
The activity of Popocatepetl volcano did not influence the atmospheric behavior of the processed variables either, due to wind conditions that favor rapid dispersion of particles emanating from the volcano [12].
The hypothesis suggested by these results is that by applying the model of El Niño phenomenon, the result obtained is directly related to the Valley of Puebla, while the CO2 model is related to climate change and should be applied to future studies.
In Figures 2-4 are presented the modeling of maximum and minimum temperatures (2), rainfall and humidity (3) and finally the solar energy (4); the modeling does not change significantly, it is almost the same for all results obtained between 2005 to 2010, showing that have remained in a range almost equal.
Processed graphs with the Fenómenodel Niño model.
 (a)
(a)
Processed graphs with the CO2 model.
Processedgraphs withthe Fenómenodel Niño model.
 (b)
(b)
Processed graphs with the CO2 model.
Processedgraphs with the Fenómenodel Niño model.
 (c)
(c)
Processed graphs with the CO2 model.

Processed graphs with the Fenómenodel Niño model.
 (c)
(c)
Processed graphs with the CO2 model.
Figure 1. Processed graphs with the Fenómenodel Niño model and CO2 model.
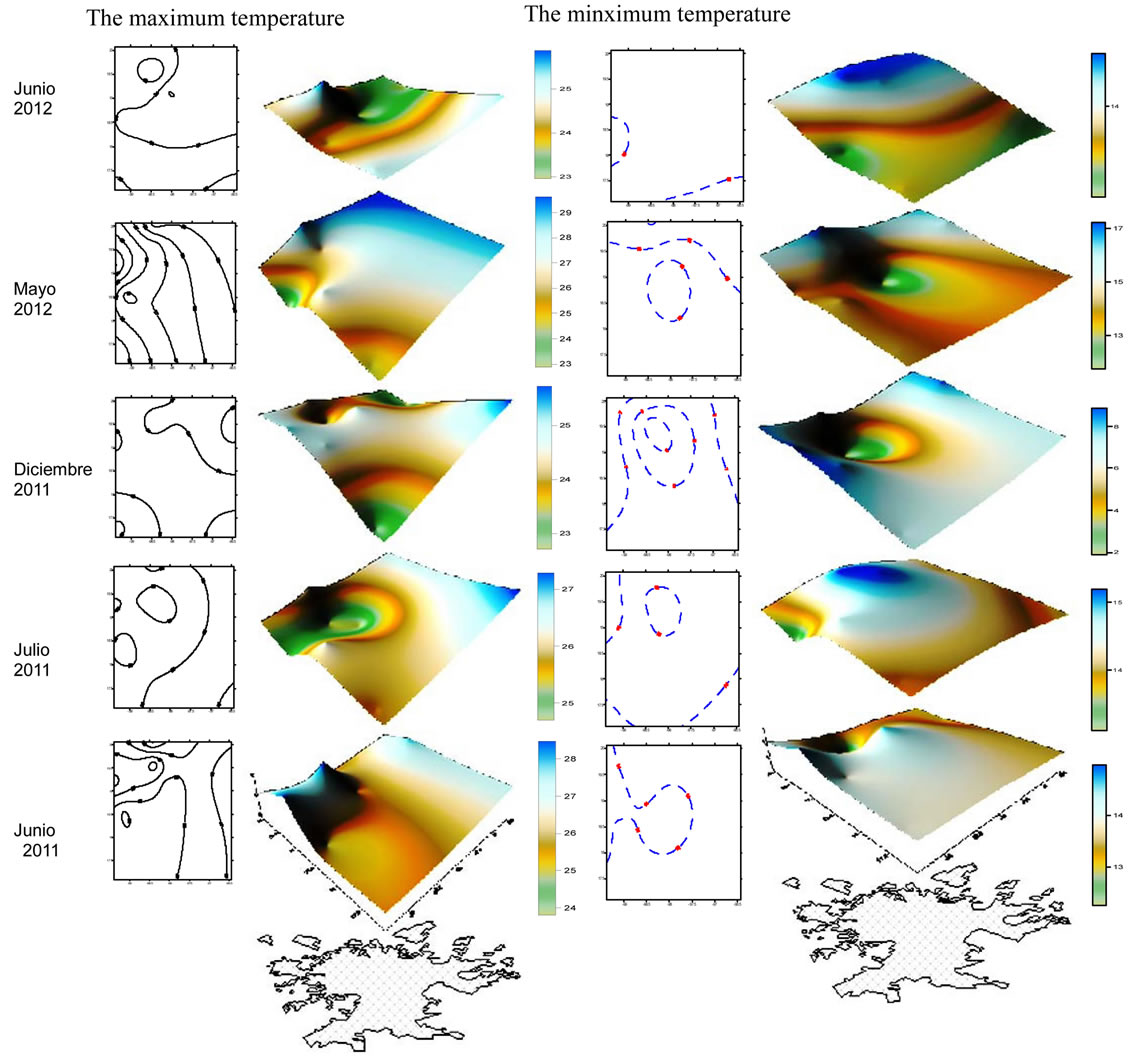
Figure 2. Modeling of maximum and minimum temperatures during June-July-December of 2011 and May-June of 2012, there is any significant variation comparing with other years. The maximum temperature in May of 2012 was 30˚, the minimum temperature in December of 2011 was −2˚C.
The following is a briefly description of the hydrometeorological forecasting divided in areas during MayNovember 2013 in the State of Puebla, applying the IONWAVELETS hypothesis (Chart 1).
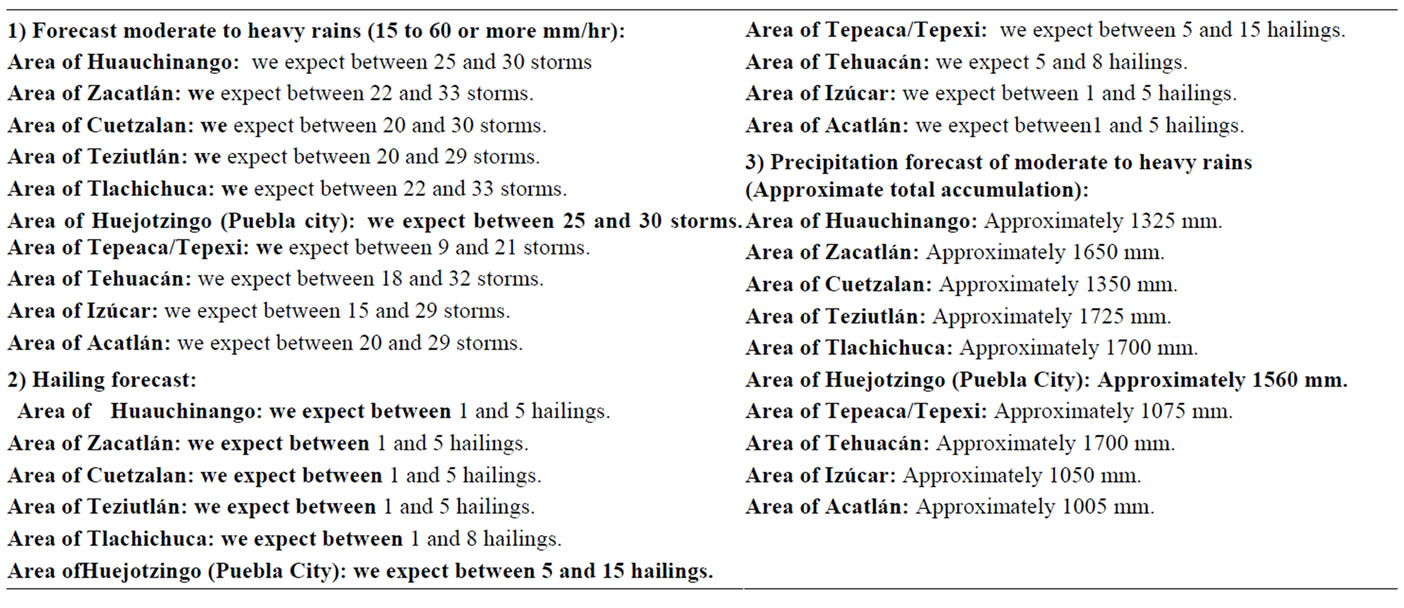
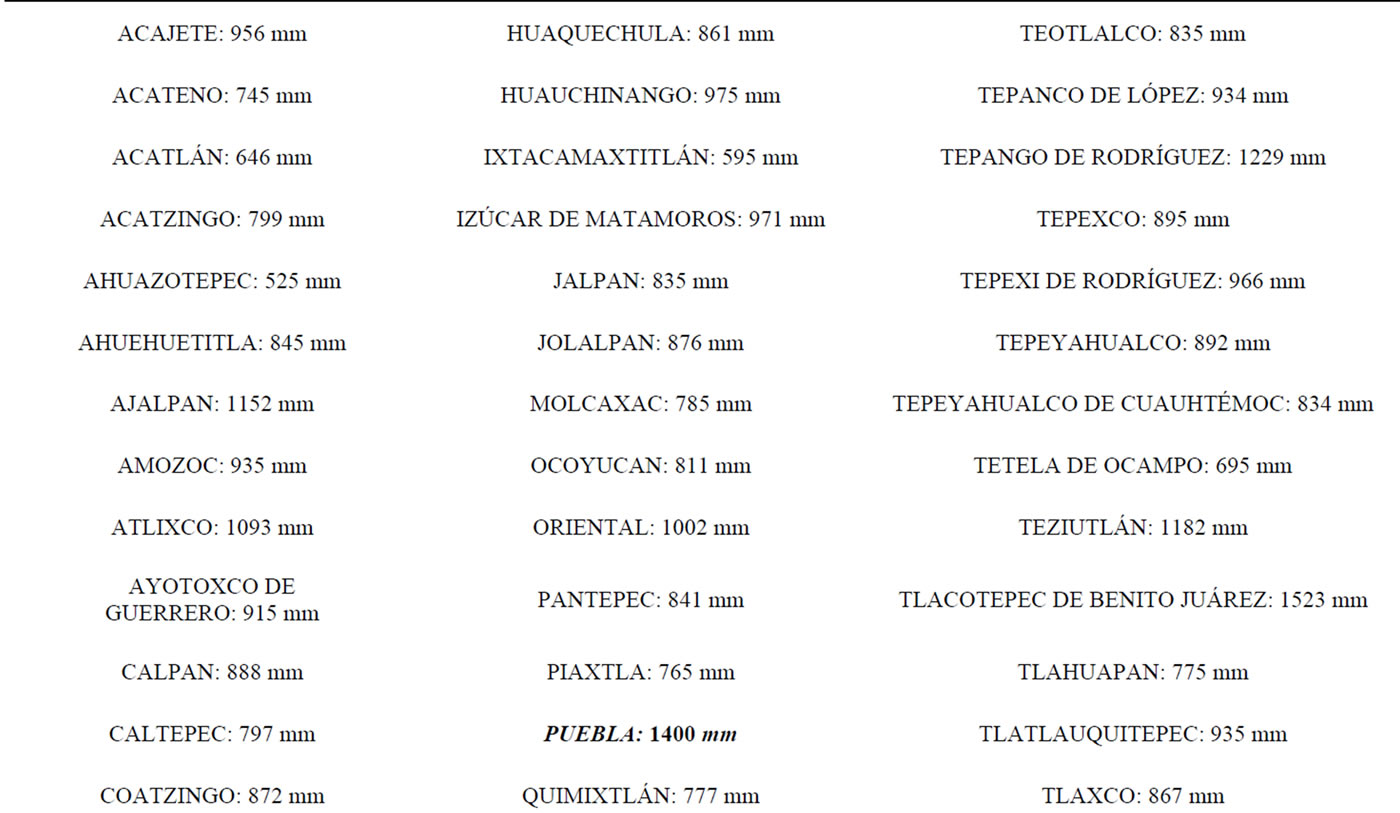
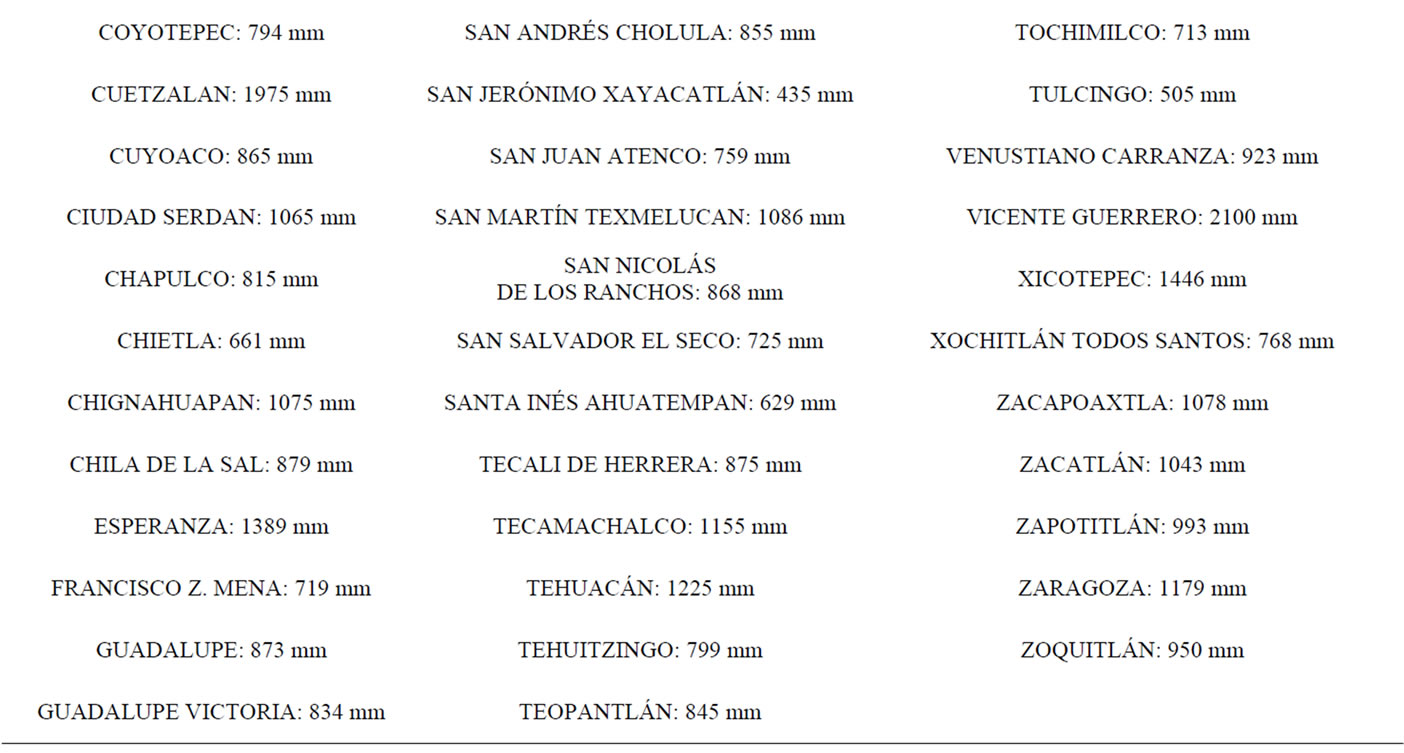
Forecast total accumulation of rainfall for the period May-November 2013 in representative municipalities of Puebla (Chart 2).
4. Conclusions
This work highlights the importance of the meteorological factors and their analysis in order to determine the probability of climate conditions and the transition of seasons, as well as the changes that are taking place.
There arises the need of evidence of temperature and rainfall trends in a finer scale to improve understanding of climate variability and long-term change and its associated mechanisms.
The relationship between temperature and humidity is usually dispersed throughout the whole year; temperature increases or decreases according to the amount of humidity existing in the air.
The relationship between humidity and rainfall shows that humidity increases in the rainy season.
The relationship between rainfall and energy is given by the existing thermal oscillation, i.e. less rainfall at higher energy.
The study allowed the identification of the zones of thermal accumulation, humidity and rainfall; both maximal and minimal. At the same time, the zones of accumulation of thermal isolines and isohyets were identified during the study period for the Valley of Puebla.
The application of IONWAVELETS hypothesis, shows atypical data to the period of study, for instance, in a short period of time was presented great amount of rain and hailstorms.
In addition with these data, it is pretended to contribute to the process of agricultural development, i. c. the relation between the obtained data and any seed which can be ideal to the edaphological development in the area of study; the application of this model is going to take more time in relation with the observation process to determine if the applied hypothesis is variable.
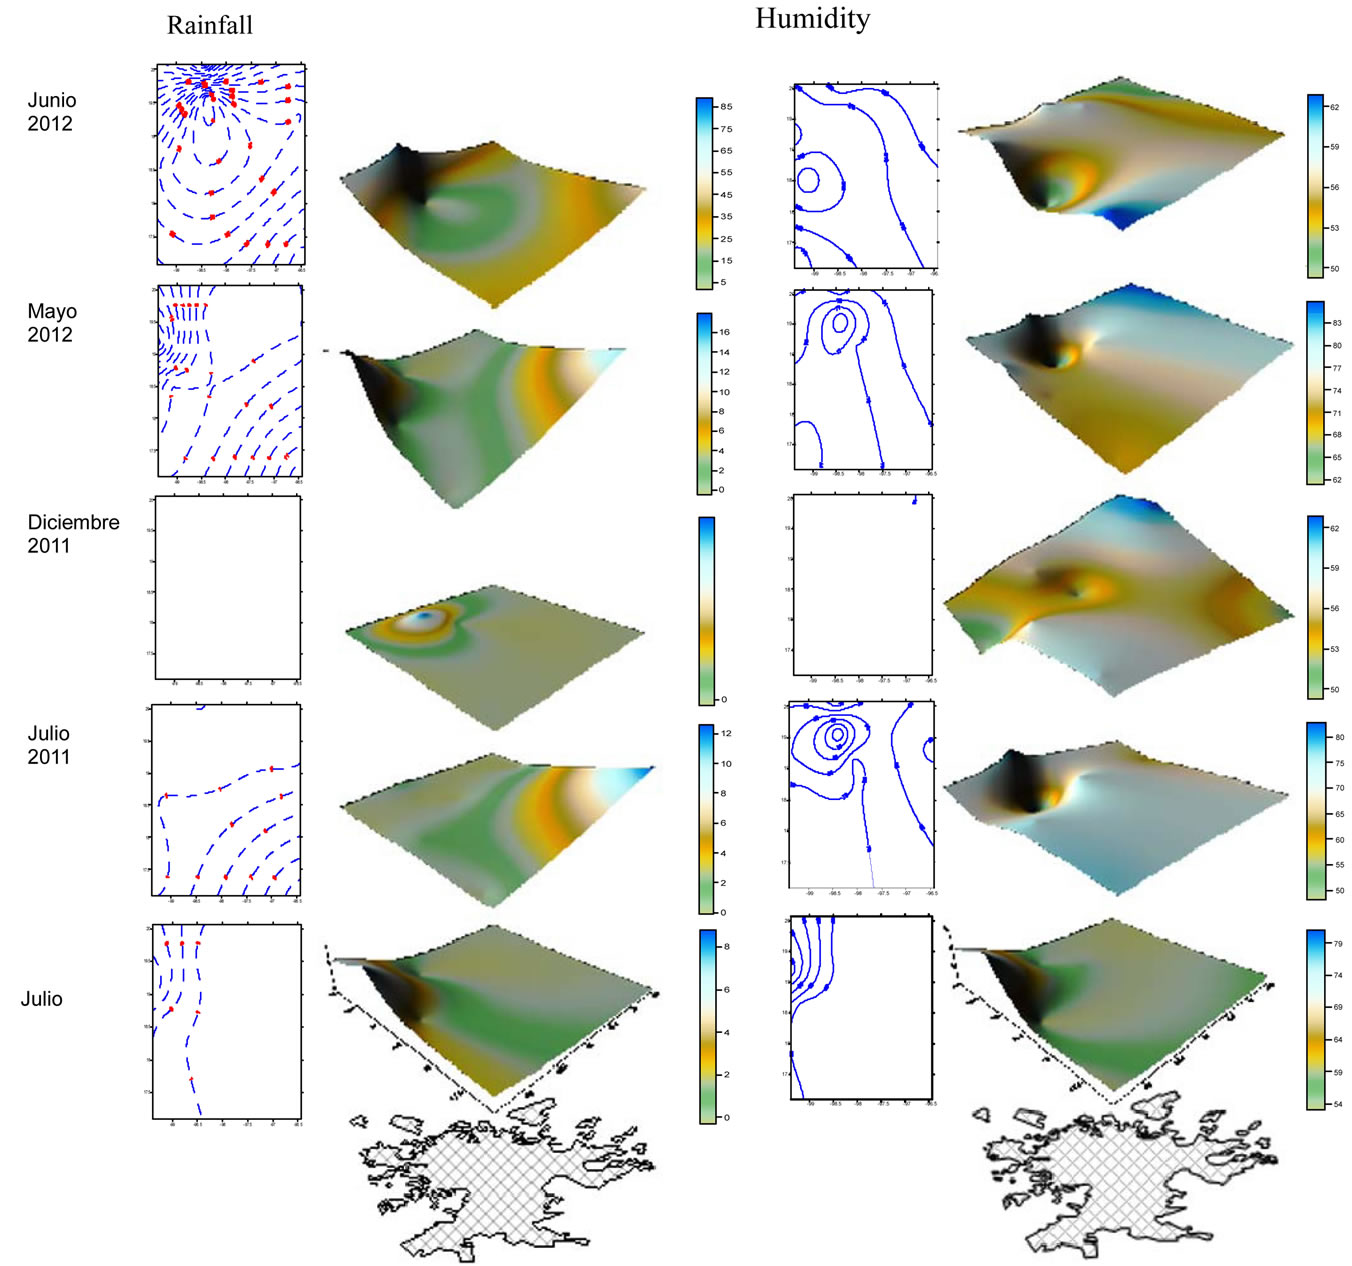
Figure 3. Modelings of the studied months are presented, seeing that the most water accumulation was registered in June 2012 with 85 mm and the less in December 2011 with 0 mm. The highest accumulation of humidity was recorded in May with 85% and the lowest accumulation was recorded in December 2011 with 48%. 2Dand 3D graphics were obtained by use of Puebla city coordinates and data was located in the z-axis, for distinguishing in a precise way the maxima and minima concentrations in the different months of year.
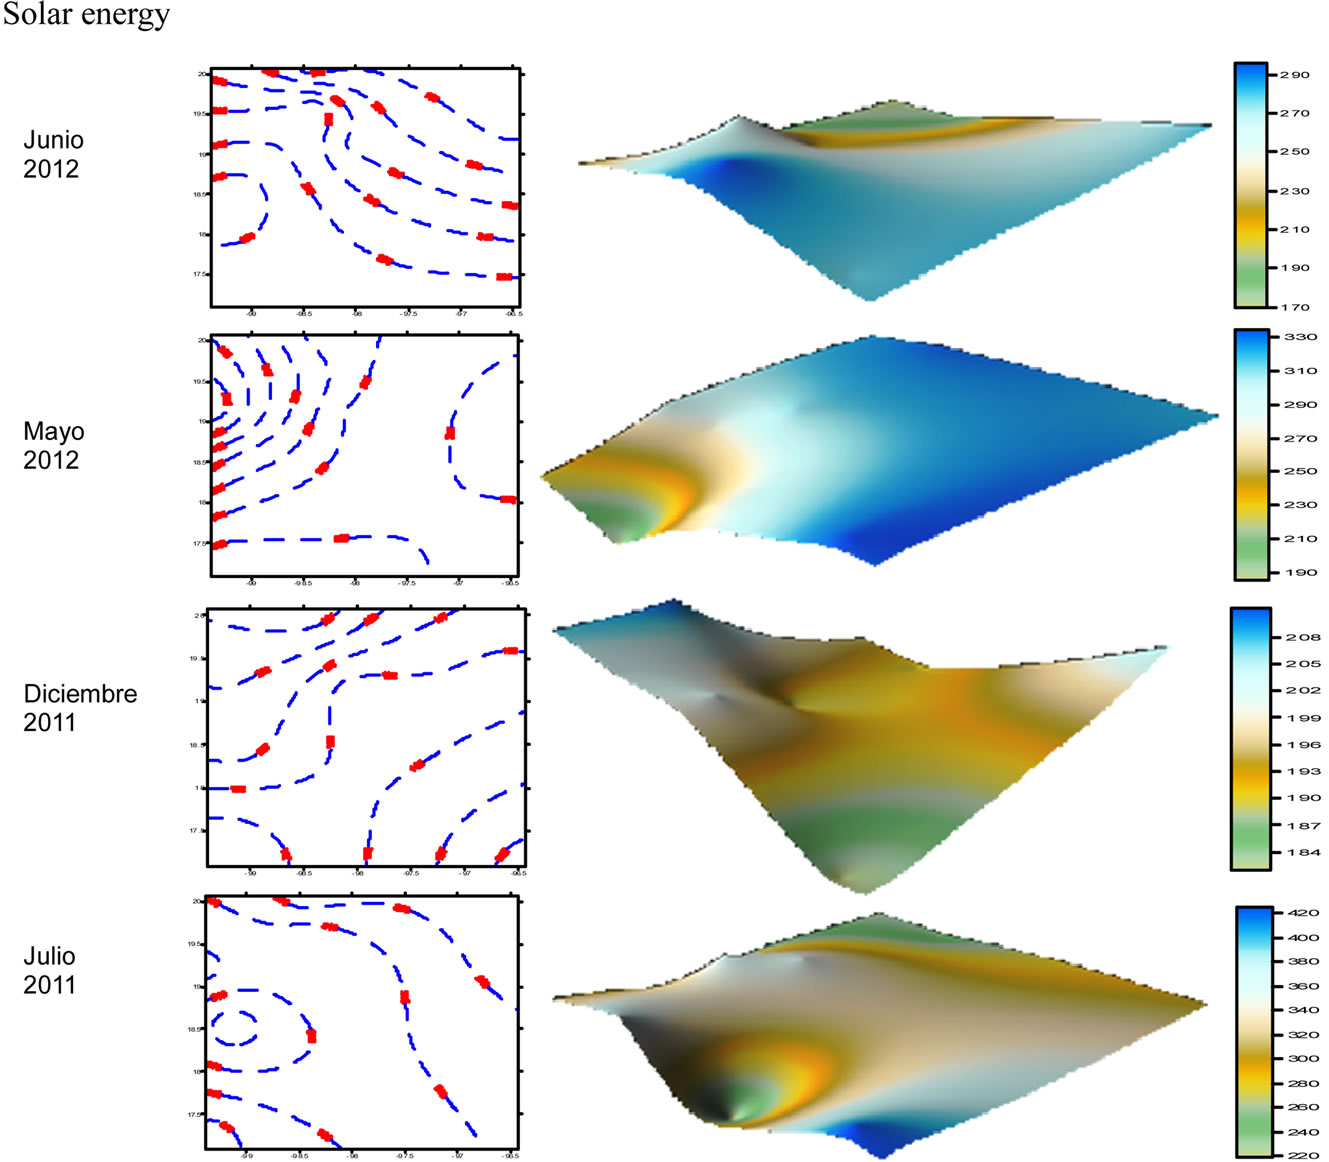
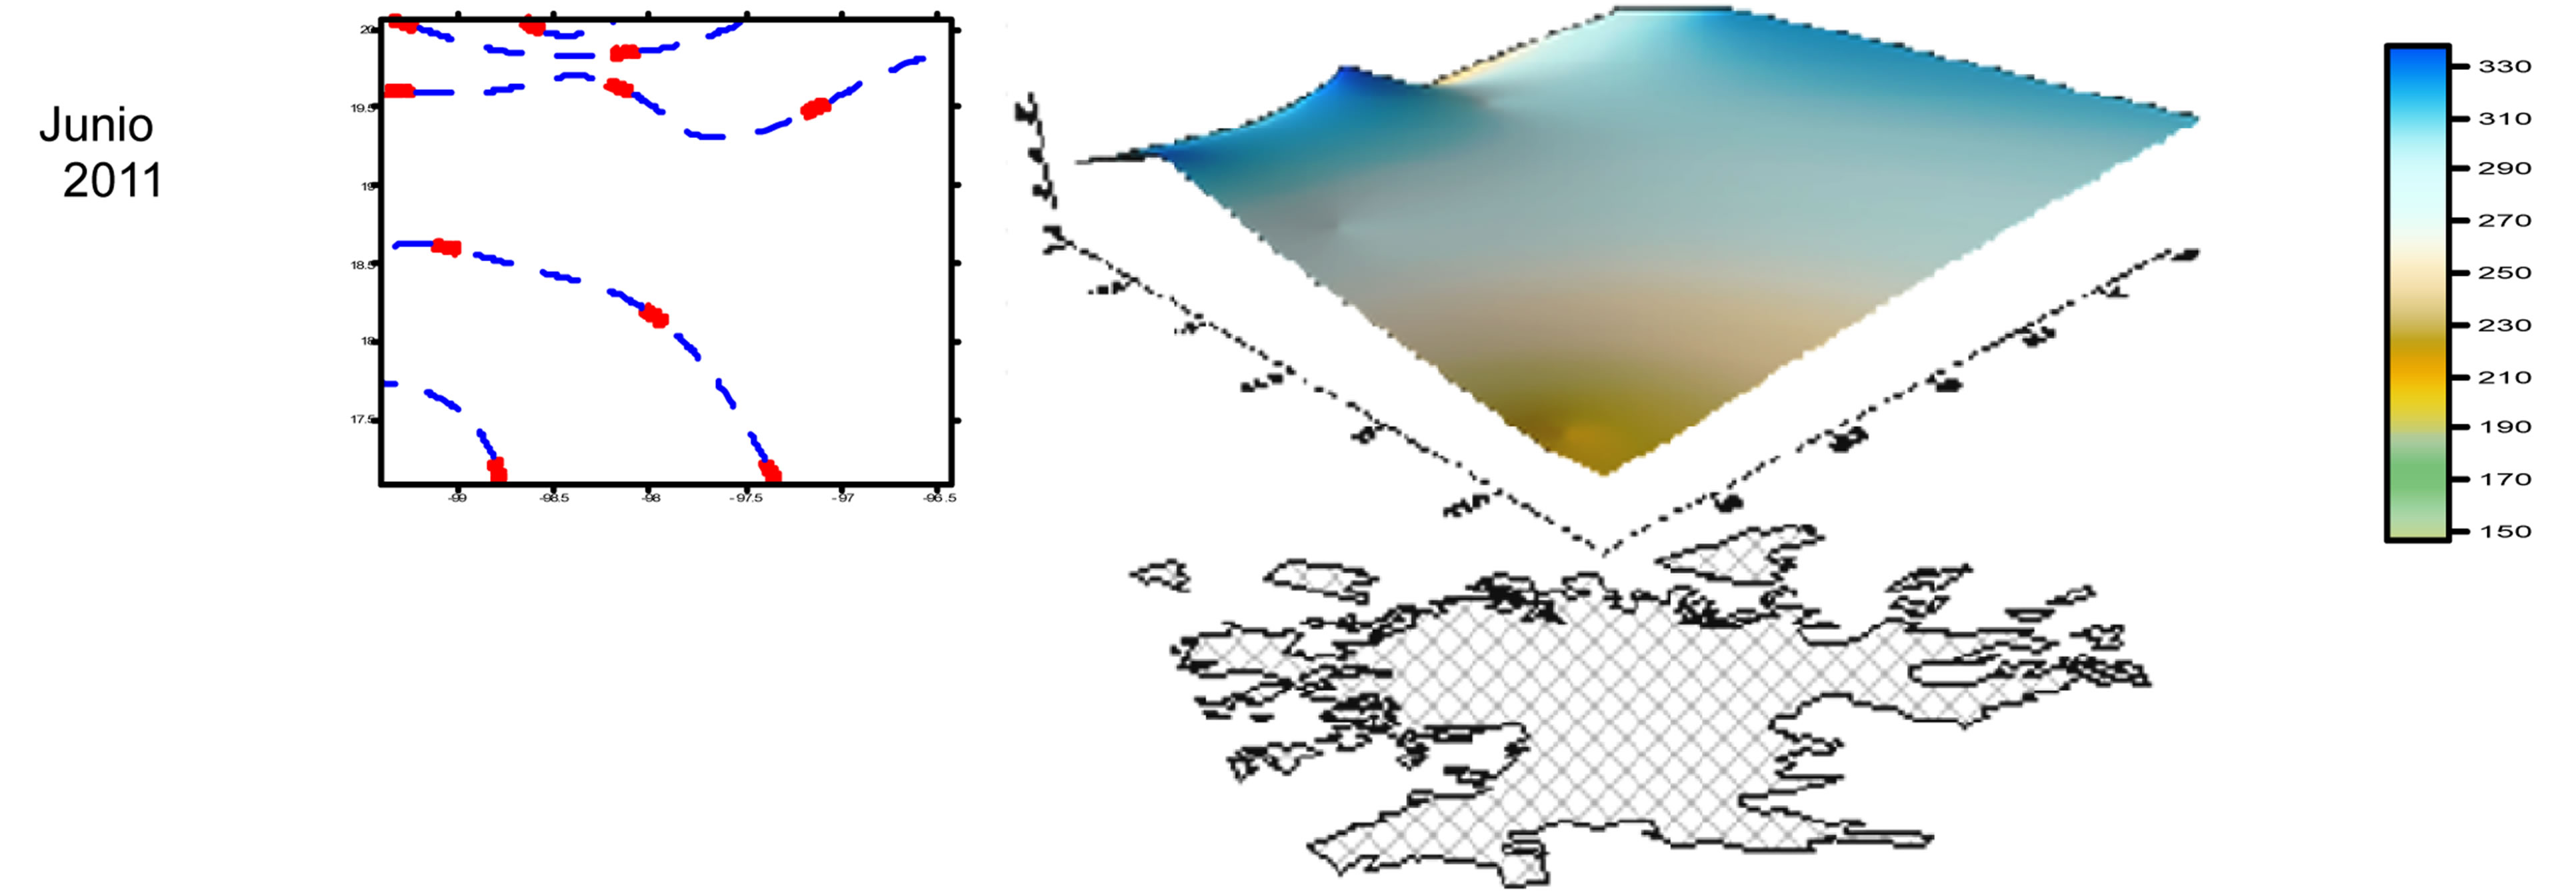
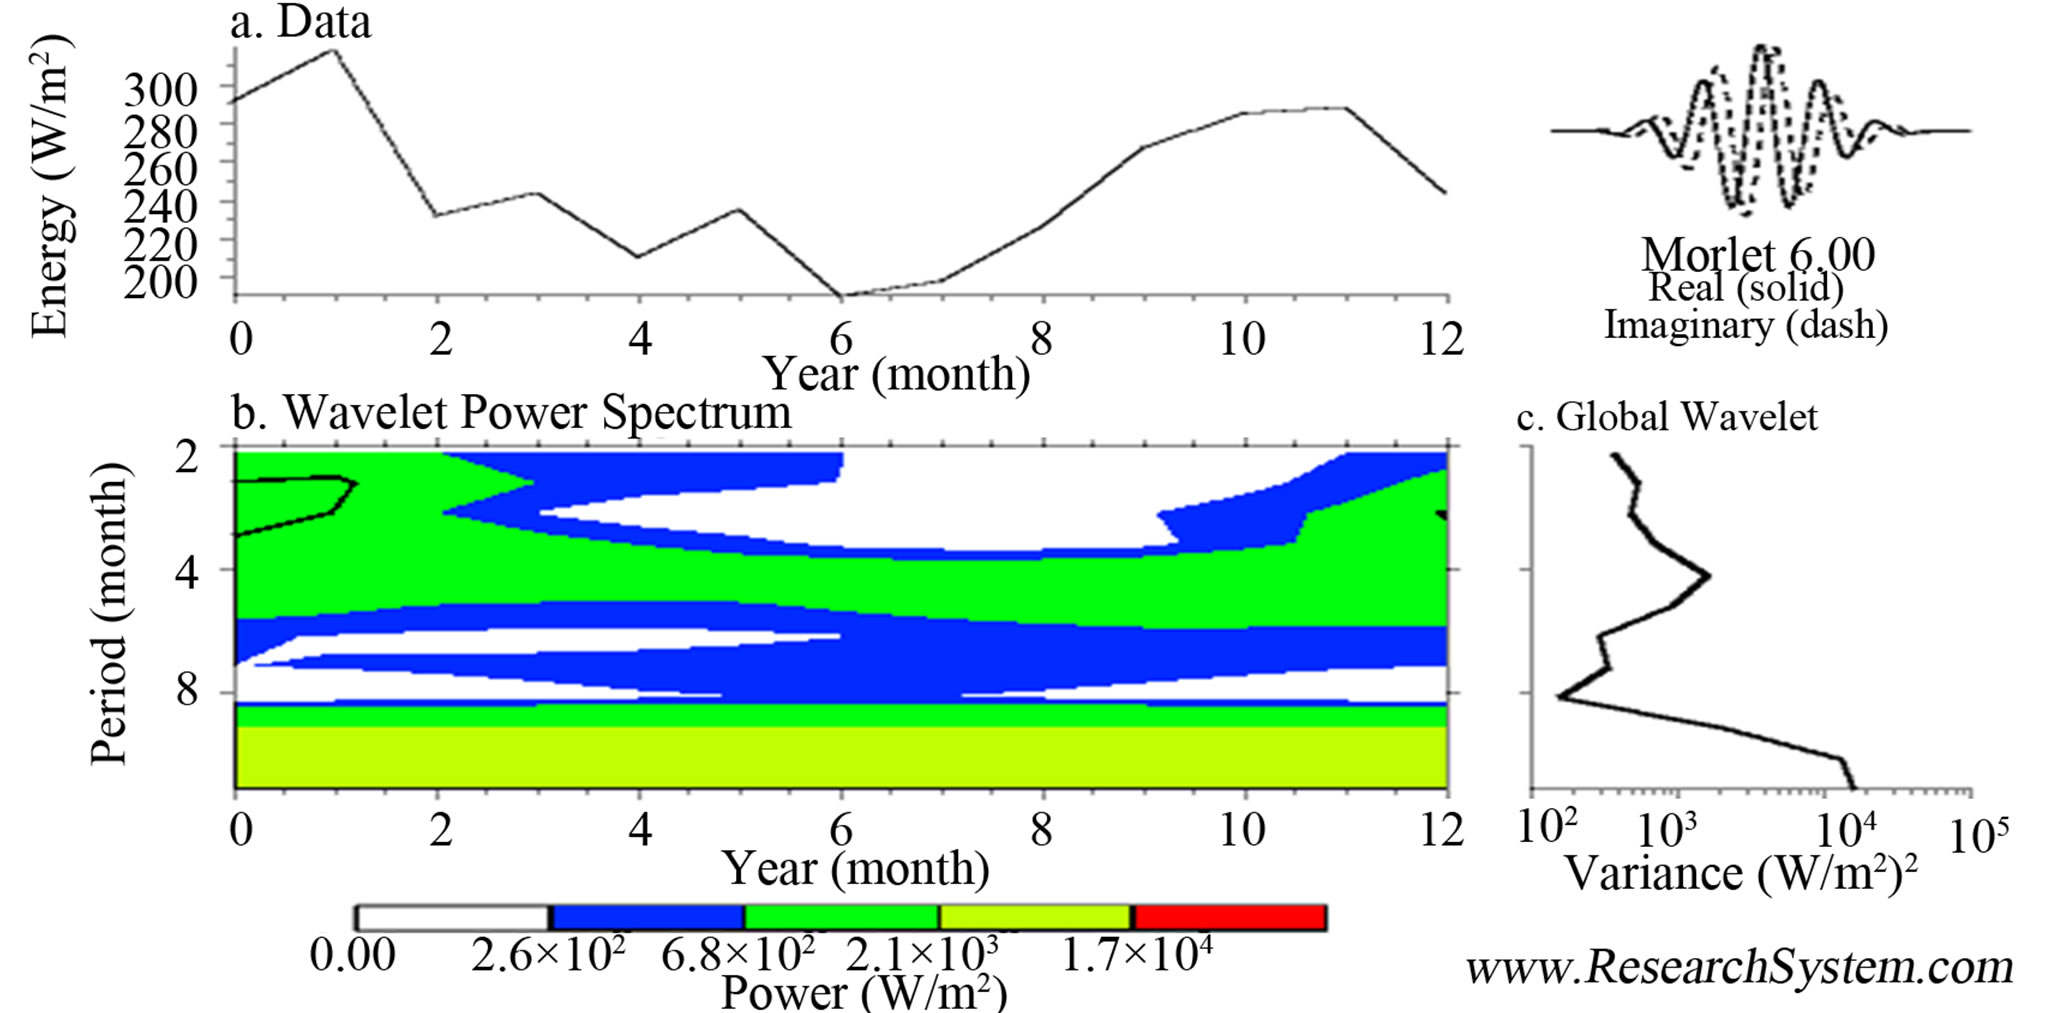
Figure 4. The figure presents the modeling of energy or solar radiation of the months studied, the highest amount of energy was in July 2011 with 423 W/m2 and lowest in June of the same year with 148 W/m2.
The model applied to the characteristics of “El Niño phenomenon, warm”, and the anthropogenic study (CO2 mainly) as well as the statistical and mathematical results have a certain range of 75% - 85%.
REFERENCES
- T. Ayllon, “Elementos de Meteorología y Climatología,” Trillas, 2003, pp. 75-105.
- M. Spiegel, “Probabilidad y Estadística,” McGraw Hill, México City, 2000.
- D. Goody, et al., “Atmospheric Radiation Theoretical Basis,” 2nd Edition, Oxford University Press, Oxford, 1999.
- S. Mallat, “Wavelet Tour of Signal Processing,” Academic Press, Waltham, 1999.
- C. Gasquet, “Analyse de Fourier et Applications,” 2000.
- A. Juárez, C. Gay and Y. Flores, “Impact of the Popocaté- petl’s Volcanic Activity on the Air Quality of Puebla City, México,” Atmósfera, 2005, pp. 57-69.
- C. Torrence, “A Practical Guide to Wavelet Analysis,” Bulletin of the American Meteorological Society, Vol. 79, No. 1, 1998, pp. 61-78. http://dx.doi.org/10.1175/1520-0477(1998)079<0061:APGTWA>2.0.CO;2
- R. Ramos, “Ciencias Atmosféricas, un Enfoque General,” UTP, 2003.
- K. Zender, et al., “Atmospheric Absorption during the Atmospheric Radiation Measurement,” Journal of Geophysical Research, Vol. 102, No. D25, 2002, pp. 29901- 29915. http://dx.doi.org/10.1029/97JD01781
- “Aplicación de ImáGenes satelitales Para determinar el Clima y la Radiación Solar en el Estado de Puebla y la Geohidrología de su Zona Norte,” Ciencia Ergo Sum, México City, 2005.
- R. Campbell, “Introduction to Remote Sensing,” Academic Press, Waltham, 2002, pp. 20-59.
- Deterioro Atmosférico en México, “Memorias del Congreso de Greenpeace-México,” 1993.
- Appendix
1) Municipalities in the area of Huauchinango:
Chiconcuautla, Francisco Z. Mena, Honey, Huauchinango, Jalpan, Jopala, Juan Galindo, Naupan, Pahuatlán, Pantepec, Tlacuilotepec, Tlaola, Tlapacoya, Venustiano Carranza, Xicotepec, Zihuateutla.
2) Municipalities in the area of Zacatlán:
Ahuacatlán, Amixtlán, Camocuautla, Cuautempan, Hermenegildo Galeana, San Felipe Tepatlán, Tepango de Rodríguez, Tepetzintla, Tetela de Ocampo, Zacatlán.
3) Municipalities in the area of Cuetzalan:
Atlequizayan, Caxhuacan, Coatepec, Cuetzalan del Progreso, Huehuetla, Hueytlalpan, Huitzilan de Serdán, Ixtepec, Jonotla, Nauzontla, Olintla, Tuzamapan de Galeana, Xochiapulco.
4) Municipalities in the area of Teziutlán:
Acateno, Atempan, Ayotoxco de Guerrero, Chignautla, Hueyapan, Hueytamalco, Tenampulco, Teteles de Ávila Castillo, Teziutlán, Tlatlauquitepec, Yaonáhuac.
5) Municipalities in the area of Tlachichuca:
Acatzingo, Chichiquila, Chilchotla, General Felipe Ángeles, Nopalucan, Oriental, Palmar de Bravo, Quecholac, Quimixtlán, Rafael Lara Grajales, San José Chiapa, San Salvador el Seco, Soltepec.
6) Municipalities in the areaof Huejotzingo:
Chiautzingo, Huejotzingo, Puebla, San Felipe Teotlalcingo, San Matías Tlalancaleca, San Nicolás de los Ranchos, San Salvador el Verde, Tlahuapan, Tochimilco.
7) Municipalities in the area of Tepeaca/Tepexi:
Acajete, Amozoc, Atoyatempan, Coatzingo, Coyotepec, Cuapiaxtla, Cuautinchán, Huatlatlauca, Huehuetlán el Grande, Huitziltepec, Ixcaquixtla, Los Reyes de Juárez, MixtlaMolcaxac, Santa Catarina Tlaltempan, Santo Tomás Hueyotlipan, Tecali de Herrera, Tecamachalco, Tepatlaxco, Tepeaca, Tepexi de Rodríguez, Tzicatlacoyan, Zacapala.
8) Municipalities in the area of Tehuacán:
Ajalpan, Atexcal, Coxcatlán, Coyomeapan, Eloxochitlán, San Sebastián Tlacotepec, Vicente Guerrero, Yehualtepec, Zoquitlán.
9) Municipalities in the area of Izúcar:
Ahuatlán, Chiautla, Epatlán, Izúcar de Matamoros, Teopantlán, Xochiltepec.
10) Municipalities in the area of Acatlán:
Acatlán, Chila, Cuayuca de Andrade, Petlalcingo, San Miguel Ixitlán, Santa Inés Ahuatempan, Tehuitzingo, Totoltepec de Guerrero, Xayacatlán de Bravo.