Journal of Diabetes Mellitus
Vol. 3 No. 2 (2013) , Article ID: 31332 , 9 pages DOI:10.4236/jdm.2013.32010
Healthcare-transition risk assessment for emerging adults with diabetes type 1*
![]()
1Department of Endocrinology and Diabetes, Sir Charles Gairdner Hospital, Perth, Western Australia
2Adjunct Senior Lecturer, Curtin University, Centre for Nursing Research Innovation and Quality, Sir Charles Gairdner Hospital, Perth, Western Australia; #Corresponding Author: pat.rapley@health.wa.gov.au
Copyright © 2013 Joey Kaye et al. This is an open access article distributed under the Creative Commons Attribution License, which permits unrestricted use, distribution, and reproduction in any medium, provided the original work is properly cited.
Received 28 February 2013; revised 30 March 2013; accepted 9 April 2013
Keywords: Diabetes; Healthcare Transition; Emerging Adults; Risk Assessment
ABSTRACT
AIM: To identify potential risk indicators for emerging adults transitioning to adult health care. BACKGROUND: Without maturity, independence, knowledge and motivation to manage their diabetes and successfully transition to adult healthcare, a proportion of emerging adults will struggle, leaving themselves vulnerable to diabetes-related complications. METHODS: Fifty-three emerging adults (aged 17 - 19 years) recently transitioned from pediatric to adult healthcare were recruited. Data included demographic, glycated haemoglobin, Body Mass Index, base-line and 12-month data from four psychosocial measures: Problem Areas in Diabetes, Diabetes Empowerment Scale, Hospital Anxiety and Depression Scale and dichotomous questions from the Eating Attitude Test. Missed appointments were obtained from hospital records. RESULTS: No significant differences in age, gender, BMI and individual survey scales between three appointment groups. Median HbA1c in the Sat-1 group was 7% (53 mmol/mol), compared with 8.6% (70 mmol/mol) and 8.5% (69 mmol/mol) respectively in the Sat-2 and Unsatisfactory groups. A ROC curve analysis and classification tree analysis identified optimal threshold values for the survey scales and their linear combinations. These values were used to make comparisons across two appointment and three HbA1c status groups. The unsatisfactory appointment group was characterised by statistically higher proportions of participants with (1) a low score for empowerment alone or in combination (less) with perceived problems and (2) statistically higher perceived problems and anxiety scores. CONCLUSIONS: Findings suggest that diabetes self-care confidence, less perception of diabetes as a problem, could be a useful indicator of future appointment attendance. Similarly, depression levels could be a useful predictor of better metabolic control following transition. RELEVANCE TO CLINICAL PRACTICE: This study offers an innovative use of existing metrics to identify at-risk emerging adults in a busy clinic. Rather than the emphasis being solely on blood glucose control, it may be time to consider including psychosocial measures to identify at-risk individuals at the first appointment in adult healthcare.
1. BACKGROUND
Health care transition for some young adults with diabetes is a difficult time with high rates of drop-out, poor attendance and sub-optimal glycemic control potentially putting individuals at higher risk of future diabetes-related complications [1-3] . Diabetic ketoacidosis (DKA) is the most immediate life-threatening complication. In addition to loss-to-follow-up [4,5] and infection [6,7] , the commonest DKA precipitants are problems related to self-management including insulin omission [8,9] , emotional stress and distress, or lack of application of sickday rules [7,10,11] . Whilst many emerging adults [12] have attained the maturity, independence, knowledge and motivation to manage in a changing environment and will achieve successful transition, a proportion will struggle at this time, leaving themselves vulnerable to the problems of poor control and complications. Since “each 1% fall in HbA1c concentration leads to an estimated fall of 30% in the risk of microvascular complications” [2,p.260], there is concern for this “at-risk” group who make up a disproportionately large percentage of those who ultimately fail to achieve effective metabolic control after transition.
Although several transition models exist to facilitate transition by improving the emerging adult’s engagement with adult healthcare [5,13,14] , risk assessment is also needed to identify who is most in need. In general there is agreement in the literature that measures to maintain three to four appointments per year are necessary as fewer appointments after transition is associated with higher HbA1c [5]. Hence, effective identification of those “at-risk” of eating disorders [1], missing appointments or disengaging with adult healthcare is needed. The aim of this study was to evaluate the use of four psychosocial variables, alone or in combination, in identifying these emerging adults at the first appointment after transition to adult health care.
2. METHODS
2.1. Research Design and Data Collection
A prospective cohort study design was used to capture consecutive new referrals with diabetes type 1 (DT1) over two years. The location was a dedicated Young Adult Diabetes Transition Clinic at a large metropolitan teaching hospital. Written, informed consent was obtained from all participants and the hospital’s Human Research Ethics Committee approved the study. Demographic variables, biochemistry and four measures of psychosocial functioning: Problem Areas in Diabetes (PAID) questionnaire [15], Diabetes Empowerment Scale (DES) [16], Hospital Anxiety and Depression Scale (HADS) [17] and dichotomous questions from the Eating Attitude Test (EAT) [18]) were collected at baseline (T0) and after twelve months (T12). All participants were offered three-monthly follow-up visits as per clinic protocol. Missed or rescheduled appointments were obtained from hospital records.
2.2. Instrument Reliability
Each of the four psychosocial measures has been validated independently in similar populations previously and chosen for their psychometric strengths. With the SPSS reliability analyses set to pair-wise deletion of missing data, tests for this study were found to be consistent with extant literature. For example, the Cronbach’s internal reliability alpha for PAID in the current sample was 0.93 (n = 53) and 0.94 (n = 37) at T0 and T12 respectively. This 20-item five-point Likert-scale covers a range of emotional states frequently reported in diabetes and recommended for screening both depression and emotional problems [19]. Scores reflect the degree to which the item is perceived as being problematic (0 = no problem to 4 = serious problem). Total score is multiplied by 1.25 (range 0 - 100) as recommended [20, p. 70]. Higher scores indicate greater emotional distress.
The short-form of the DES-SF [21] measures diabetes related psychosocial self-efficacy or confidence to manage diabetes regimen, readiness to change behaviour, and perceived ability to set goals. The developers reported that both DES-SF and HbA1c levels changed in positive direction but were not correlated, suggesting that the two measures varied independently. The eight-item scale provides a brief overall assessment of diabetes related psychological self-efficacy. It has a five-point Likert scale and score range of 8 - 40. The reliability of the DES-SF tested against the original data set collected for the DES demonstrated an alpha of 0.85 and 0.84 when retested with a further 229 subjects. Similarly, in the current study, DES-SF demonstrated an alpha of 0.83 (n = 52) and 0.88 (n = 37) at T0 and T12 respectively.
The four-point, 14-item, self-report HADS is based on the symptoms of anxiety and depression rather than emotional and physical disorders. Scores for each item range from zero to three with total scores for both seven-item subscales greater than 11 out of 21 equating to increased anxiety or depression. Over the last two decades the HADS has been used to quantify anxiety and depression within many specialities that use outpatient clinics in a similar manner to the subjects of interest in this study, including a diabetes clinic [22]. Reliability testing of the HADS subscales for the current sample indicated Cronbach’s alpha scores for the depression subscale were the lowest at 0.77 and 0.66 at T0 and T12 respectively, while scores for the anxiety subscale were 0.85 and 0.81 at T0 and T12 respectively.
The EAT has been used as an outcome measure in many treatment studies and as a screening instrument for eating disorder risk. The four dichotomous questions in the EAT-26 focus on whether or not participants experienced eating binges, made themselves sick (vomited) to control weight or shape, used laxatives, diet pills or diuretics to control weight or shape, or had been treated for an eating disorder. A diagnostic interview is recommended if a “yes” response is given to any of the questions [23]. Given the literature on insulin abuse, an insulin-related question was also added: Have you recently thought of, or withheld insulin to control your weight or shape?
2.3. Analysis
Statistical analyses were completed using the IBM SPSS statistics version 19 package and in the R statistical computing environment, version R 2.13.1. Where missing data existed, analyses were carried out on the restricted data set: Imputation methods were not used. The study group were classified firstly according to whether they had attended a satisfactory (≥3) number of appointments or not (<3 unsatisfactory). They were also categorised by HbA1c status in two ways. A three-category HbA1c status denoted a satisfactory classification as either HbA1c of 7.5% (59 mmol/mol) or less at T0 that was maintained at or below 7.5% at T12 (Sat-1), or, in the case of baseline HbA1c being greater than 7.5%, the change in HbA1c from T0 to T12 was less than 0.5% (Sat-2). The remaining participants had an HbA1c greater than 7.5% at T0 and their change in HbA1c from T0 to T12 was 0.5% or more (Unsat). The 2-category satisfactory HbA1c status combined Sat-1 and Sat-2 to form one satisfactory group to compare with the unsatisfactory HbA1c status group.
Descriptive statistics included median (LQ = lower quartile, UQ = upper quartile) for continuous variables and counts (%) for categorical variables. Distributions of the variables of interest were compared between appointment groups and also by HbA1c status, using the Mann-Whitney or Kruskal-Wallis test and χ2 or Fisher’s Exact test, as appropriate. Statistical significance was set at 5%. Cronbach’s alpha was used to test internal reliability of measurements.
As well as the continuous survey scale variables, we evaluated 1) linear combinations of PAID and DES, and Anxiety and Depression scales; 2) threshold levels for survey scale variables; and 3) threshold levels for linear combinations of survey scale values. Survey scores were scaled to the same range before pairing, so that one scale did not dominate the other. To locate suitable threshold values, we used receiver operating characteristic (ROC)
curve analysis and the partitioning methods of regression trees. The resulting threshold values were used to create binary predictors.
The predictive value of the survey scales was evaluated by constructing reclassification tables, and calculating the Net Reclassification Improvement (NRI) and Integrated Discrimination Improvement (IDI) measures, following the method of Pencina et al. [24]. The NRI summarises the proportional changes in correct classifications due to introducing a predictor into a model. The IDI assesses improvement in case discrimination, by estimating the change in the difference in the mean predicted probabilities of the outcome between those with and without the outcome in question. The better model is characterised by a greater difference in IDI than observed in a comparatively poor prognostic model. Each survey scale, linear combination or threshold variable identified in the previous section was assessed after being added sequentially to a base model adjusted for age, gender and baseline BMI and HbA1c. Then a final enriched model was compared to the base model to evaluate the maximum possible improvement in predictive ability afforded by the addition of all significant variables.
3. RESULTS
Over the two-year study, the Young Adults with Diabetes (YADs) transition clinic at the study hospital received 72 new referrals from the local paediatric hospital. Of these, 58 attended at least one appointment and 53 (91%) volunteered for the study. Baseline demographic and biochemical features are shown in Table 1. Thirtynine participants attended three or more appointments over the 12-month study (classified as satisfactory atten-
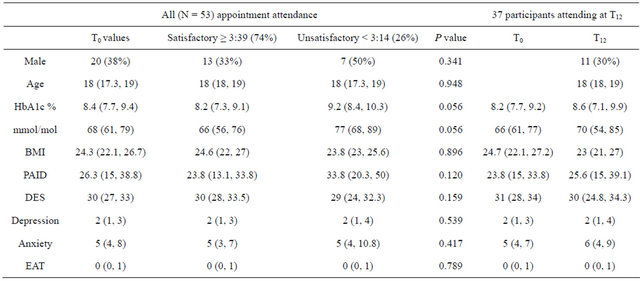
Table 1. Summary statistics at T0 for all participants, participants classified by appointment attendance and summary statistics at T0 and T12 for the 37 participants attending at T12. Values are median (quartiles) for continuous data and count (%) for categorical.
dance) and 14 attended two or less appointments (unsatisfactory attendance). Four participants in the satisfactory appointment category did not have a T12 appointment or HbA1c data. The majority of participants (35/37) for whom biochemical data were available at T0 and T12 were also in the satisfactory appointment group (Table 1).
The median age of the sample was 18 years (range 16 - 24) and 38% were male. At baseline, median BMI was 24 (22, 27) kg/m2 and HbA1c was 8.4 (7.7, 9.4)% or 68 (61, 79) mmol/mol. For the 37 participants with baseline and T12 data (Table 2), the median increase was 0.2%, however individual variations were as large as 4% (20 mmol/mol) above and below T0 HbA1c. Likewise, the differences between T0 and T12 for BMI and all the survey scales were not statistically significant (all P > 0.2).
3.1. Appointment Attendance
There were no significant differences in age, gender, BMI and the survey scales between the satisfactory and unsatisfactory appointment groups (all P > 0.1; Table 1). However, the data suggest a trend towards higher baseline HbA1c in unsatisfactory attendees (median 9.2 vs 8.2 in satisfactory attendees, P = 0.056), and towards higher PAID score (median 33.8 vs 23.8, P = 0.120). The change in HbA1c (ΔHbA1c) from T0 to T12 could not be compared between the 2 appointment groups, since unsatisfactory attendees were largely absent at T12. While EAT score did not significantly distinguish between appointment attendance categories, there was a trend towards higher scores among female participants (P = 0.055): overall more than 25% of females scored above zero compared to 5% of males. For unsatisfactory attendees, EAT scores were similar across genders, while in the satisfactory attendance group all males scored zero or one, but more than 30% of females scored above one on the test.
3.2. HbA1c Status
None of age, gender, BMI or T0 survey scales was significantly different between satisfactory and unsatisfactory HbA1c groups (all P > 0.1). When the Sat-1 and Sat-2 sub-categories were evaluated, results were similarly not significant in comparisons across the 3 groups (see Table 2). By definition, HbA1c status reflects information about T0 HbA1c as well as ΔHbA1c (∆ = change) from baseline to T12. Median HbA1c in the Sat-1 group was 7% (mmol/mol), compared with 8.6% (70 mmol/mol) and 8.5% (69 mmol/mol) respectively in the Sat-2 and Unsatisfactory groups (P < 0.005 for the comparison between Sat-1 and Sat-2 or unsatisfactory groups). Median ΔHbA1c was 2% in the unsatisfactory
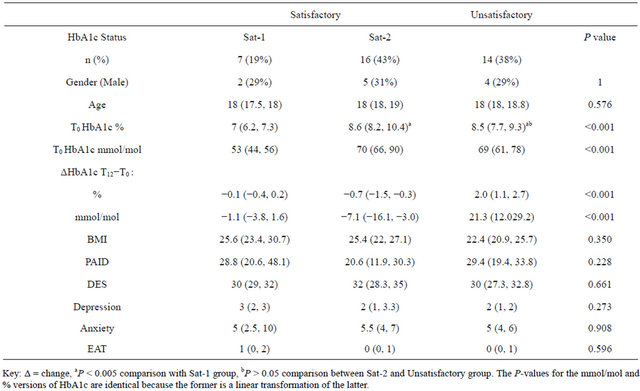
Table 2. Summary statistics by HbA1c status group at T12 (n = 37): median (LQ, UQ) for continuous variables, counts (%) for categorical variables.
group, and overall showed increases of 0.7% up to a maximum of 4% (mmol/mol). The Sat-1 participants were those who remained stable, with change confined to within ± 1% of T0 HbA1c. In Sat-2 participants, HbA1c increase was by definition less than 0.5%, but notably 75% of these participants demonstrated a decrease in HbA1c by T12. When we examined ΔHbA1c as a continuous variable, there were no significant predictors among individual survey scales (all P > 0.1), though we observed trends for ΔHbA1c to increase as depression and EAT scores decreased (P = 0.134, 0.135). That is, there was a trend for participants who had lower depression or EAT scores at T0 to also have higher HbA1c values a year later.
3.3. Threshold and Linear Combinations of Survey Scales
We explored the predictive value of linear combinations of PAID and DES, and anxiety and depression subscales. After scaling each pair to the same value range, we found that there was a trend for DES-PAID to be about 20 points lower among unsatisfactory attendees (P = 0.055, Table 3). The same combination was not statistically significant in distinguishing HbA1c status, but we note that median DES-PAID in the HbA1c Sat-2 participants was 10 to 20 points higher than in the Sat-1 or Unsatisfactory HbA1c participants (P = 0.257). Anxiety/ Depression combinations were not significant for any of the responses.
From ROC curve analysis and classification tree analysis, we identified optimal threshold values for the survey scales and their linear combinations, and used these values to make comparisons across attendance and HbA1c status groups (Table 3). We found that the unsatisfactory appointment group was characterised by higher proportions of participants with low DES-PAID and DES (P = 0.005, 0.003) and higher PAID and Anxiety scores (P = 0.046, 0.049). For example: 50% have PAID scores greater than 36, compared with 21% of satisfactory attendees; 79% have DES-PAID below 38, compared with only 31% of satisfactory attendees.
Among the 37 participants assessed for HbA1c status, we found that, while a threshold DES-PAID variable did not distinguish HbA1c satisfactory or unsatisfactory status, the Sat-2 group was characterised by a higher proportion with high DES-PAID (≥57) than either the Sat-1 or unsatisfactory groups (P = 0.026). Participants with unsatisfactory HbA1c were more likely to have a low score on the depression subscale than those with satisfactory HbA1c (93% vs 48%; P = 0.011 for unsatisfactory vs all satisfactory; P = 0.020 for test over 3 categories).
3.4. Predictive Ability of Survey Scales
The NRI and IDI results in Tables 4(a) and (b) are illustrated for variables found to be significant or of interest in the previous sections. We found the variables EAT (stratified by gender), anxiety less than 10 and DES-PAID less than 38 were significant in increasingly accurate prediction of appointment attendance when added sequentially to a model already adjusted for age, gender and T0 BMI and HbA1c. Threshold DES-PAID was chosen ahead of either scale separately, as it provided more accurate predictions in the final model. The full enriched model showed a NRI of 1.25 and IDI of 0.43 (both P < 0.001), and was 91% accurate in predicting appointment group. Among the 14 study participants who defaulted on appointments, reclassification was more accurate when these variables were included (71% correctly classified with risk greater than 50%, compared to 29% in the base model). Among the 39 satisfactory Attendees, reclassification was slightly less accurate
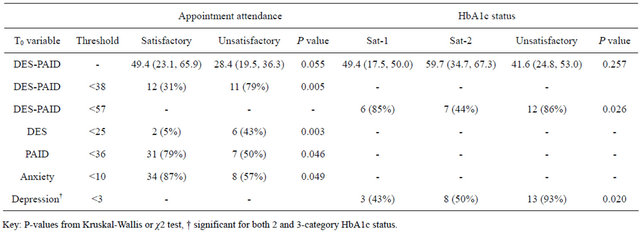
Table 3. Potential risk indicators: Median (LQ, UQ) DES-PAID and counts (%) for threshold variables by Appointment Group and the 3-category HbA1c status.
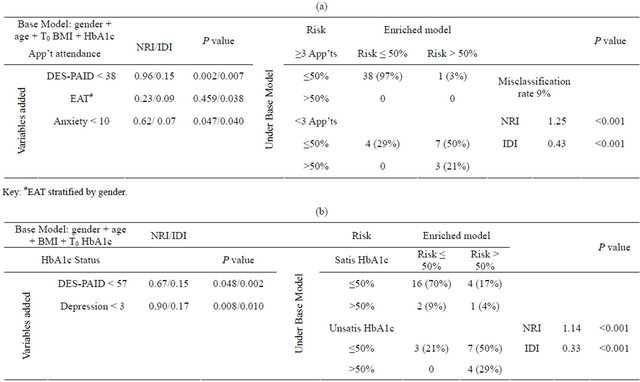
Table 4. (a) Reclassification table of appointment attendance predictions from enriched models when compared to base model with predictors gender, age, T0 BMI and T0 HbA1c. Net Reclassification and Integrated Discrimination Improvements (NRI/IDI) shown with misclassification rate; (b) Reclassification table of HbA1c predictions from enriched models when compared to base model with predictors gender, age, BMI and T0 HbA1c. Net Reclassification and Integrated Discrimination Improvements (NRI/IDI) shown with misclassification rate.
when these variables were added (3% erroneously classified with risk more than 50%, compared to 0% in the base model).
The inclusion of a DES-PAID score less than 57 and a Depression score less than three in the model for HbA1c status provided a NRI of 1.14 and IDI of 0.33 (both P < 0.001). The prediction accuracy of HbA1c status in the full model was 78%. Among the 14 participants with unsatisfactory HbA1c, this improved reclassification by more than 50% (79% correctly classified with risk more than 50%, compared with 21% in the base model). Among the 23 participants with satisfactory HbA1c, reclassification was slightly less accurate when these variables were added (79% correctly classified with risk less than 50%, compared with 87% in the base model).
4. DISCUSSION
Healthcare transition is a difficult time with potentially poor outcomes for significant numbers of the emerging adult cohort with diabetes type 1. Our findings offer an innovative use of existing metrics to identify those atrisk in a busy clinical environment—particularly when each is unknown to the other, when we know that it can be a time of worsening glycemic control, and that psychosocial functioning will continue to decline into adulthood if adjustment problems are not remedied early [1, 25] .
While three of the four psychosocial scales performed as predicted, alone they were unable to predict metabolic control or clinic attendance in this sample. Nevertheless, our findings are consistent with the prevailing view that more frequent appointments after transition are linked to improved HbA1c [2,5,26,27] . Similarly, the EAT scale, consistent with other studies [1,28,29] , re-enforces the high frequency of potential eating disorders in females of this age-group—a useful initial metric for the diabetes educator.
In relation to composite measures, at least one (DESPAID) could be a useful predictor of who might neglect their self-management during this vulnerable transition period. This novel use of two standard psychosocial measures suggests that a person’s level of diabetes self-care confidence, less their perception of diabetes as a problem, could be a useful indicator of future appointment attendance. Similarly, the use of DES-PAID with a depression score of less than three could be a useful predictor of better metabolic control following transition. Glycated haemoglobin levels are known to be related to diabetes-regimen confidence [30-32] . Diabetes-related confidence can also mediate the link between HbA1c and depression [33].
While the nexus between depression and DT1 is not consistent [34], assessment for emotional vulnerability that may impact on metabolic control [35] and or clinic attendance remains an important focus for future research. Understandably, perceptions of ineffective control over one’s health play a role in the development of depression [33]. Yet the significant difference in depression scores for participants in this study is counterintuitive but could be interpreted using Thomas Gray’s concept—“where ignorance is bliss, tis folly to be wise”. Participants are not sufficiently worried about the effects of high HbA1c levels on their body to be anxious or depressed. This notion is also consistent with the finding for pump patients [36]—higher anxiety scores being associated with better control. Therefore, further work to extend the results of this study is needed. The interaction of diabetes-management confidence, problem-focused perceptions about diabetes, anxiety and depression for atrisk emerging adults at the time of transition is unknown. Certainly, others have recommended routine depression screening after transition [3,37,38] .
This study has several limitations, the most obvious being the small volunteer sample from one hospital and missing values. The missing data were mainly due to participants’ missed appointments, the phenomenon at the heart of the study itself. This potential for biased study results requires cautious use of the findings. Apart from this, the study used four psychometrically reliable and valid self-report measures with three of the measures achieving acceptable reliability scores for this sample. Whilst the longitudinal data provide temporal relationships for participants, non-participants are either confident about their self-management and that appointments are unnecessary, or they are using avoidance as a coping tactic. This study is unable to test either assumption.
5. CONCLUSION
Life for emerging adults is more than glucose control. The concomitant and potentially dissonant need to maintain glucose control as well as peer-relationships requires choices. Short-term social rewards that strengthen peergroup bonds mean that risks associated with being different, as in overt diabetes-related activities, are to be avoided [39]. Hence, there may be little consideration by the adolescent of short or long-term health consequences of missed appointments or other decisions made for social rewards; especially when the emerging adult feels “bullet-proof”. Rather than the health professionals’ emphasis being solely on blood glucose control, it may be time to consider including psychosocial measures to identify at-risk adolescents at the first appointment in adult healthcare.
5.1. Relevance to Clinical Practice
Whilst at-risk individuals are in particular need of the recommended three-to-four appointment per year for two years post-transition [3,27,40] , the importance of their first appointment cannot be underestimated; clinically or generally. As part of the important early assessment of self-management skills around insulin management, eating behaviours and exercise [41], data from this study suggest it is time to consider including psychosocial measures to identify at-risk adolescents. An initial appointment process within an expanded diabetes educator role could help identify at-risk individuals who could benefit from targeted education or referral. A low cost initiative could be to give more attention to first appointment individuals with high HbA1c who see diabetes as a problem and or have low diabetes-related self-management confidence.
5.2. Contributions
Study design (PR, JK, GB), Data Collection (PR, GB), Manuscript preparation (PR, JK, GB, SB).
REFERENCES
- Peveler, R.C., Bryden, K.S., Neil, H.A.W., et al. (2005) The relationship of disordered eating habits and attitudes to clinical outcomes in young adult females with type 1 diabetes. Diabetes Care, 28, 84-88. doi:10.2337/diacare.28.1.84
- Wills, C.J., Scott, A., Swift, P.G.F., Davies, M.J., Mackie, A.D.R. and Mansell, P. (2003) Retrospective review of care and outcomes in young adults with type 1 diabetes. British Medical Journal, 327, 260-261. doi:10.1136/bmj.327.7409.260
- National Collaborating Centre for Women’s and Children’s Health. (2004) Type 1 diabetes: Diagnosis and management of type 1 diabetes in children and young people. RCOG Press, London.
- Farrell, K. and Holmes-Walker, J. (2011) Maintaining outcomes after 10 years of a diabetes transition support program. Australian Diabetes Society & Australian Diabetes Education Association Annual Scientific Meeting, Perth.
- Holmes-Walker, D., Llewellyn, A. and Farrell, K. (2007) A transition care programme which improves diabetes control and reduces hospital admission rates in young adults with type 1 diabetes aged 15-25 years. Diabetic Medicine, 24, 764-769. doi:10.1111/j.1464-5491.2007.02152.x
- Tan, H., Zhou, Y. and Yu, Y. (2012) Characteristics of diabetic ketoacidosis in chinese adults and adolescents – a teaching hospital-based analysis. Diabetes Research and Clinical Practice, 97, 306-312. doi:10.1016/j.diabres.2012.05.004
- Umpierrez, G. and Kitabchi, A. (2003) Diabetic ketoacidosis: Risk factors and management strategies. Treatments In Endocrinology, 2, 95-108. doi:10.2165/00024677-200302020-00003
- Saunders, S.A., Wallymahmed, M. and MacFarlane, I.A. (2004) Glycaemic control in a type 1 diabetes clinic for younger adults. Quarterly Journal of Medicine, 97, 575- 580. doi:10.1093/qjmed/hch098
- Weinert, L.S., Scheffel, R.S., Severo, M.D., et al. (2012) Precipitating factors of diabetic ketoacidosis at a public hospital in a middle-income country. Diabetes Research and Clinical Practice, 96, 29-34. doi:10.1016/j.diabres.2011.11.006
- Laffel, L. (2000) Sick-day management in type 1 diabetes. Endocrinology and Metabolism Clinics of North America, 29, 707-723. doi:10.1016/S0889-8529(05)70160-2
- Skinner, T.C. (2002) Recurrent diabetic ketoacidosis: Causes, prevention and management. Hormone Research, 57, 78-80. doi:10.1159/000053320
- Peters, A., Laffel, L. and American Diabetes Association Transitions Working Group. (2011) Diabetes care for emerging adults: Recommendations for transition from pediatric to adult diabetes care systems. Diabetes Care, 34, 2477-2485. doi:10.2337/dc11-1723
- Crowley, R., Wolfe, I., Lock, K. and McKee, M. (2011) Improving the transition between paediatric and adult healthcare: A systematic review. Archives of Disease in Childhood, 96, 548-553. doi:10.1136/adc.2010.202473
- Van Walleghem N., MacDonald C.A. and Dean H. (2008) Evaluation of a systems navigator model for transition from pediatric to adult care for young adults with type 1 diabetes. Diabetes Care, 31, 1529-1530. doi:10.2337/dc07-2247
- Polonsky, W., Anderson, B., Lohrer, P., et al. (1995) Assessment of diabetes-related distress. Diabetes Care, 18, 754-760. doi:10.2337/diacare.18.6.754
- Anderson, R., Funnell, M., Fitzgerald, J. and Marrero, D. (2000) The diabetes empowerment scale: A measure of psychosocial self-efficacy. Diabetes Care, 23, 739-743. doi:10.2337/diacare.23.6.739
- Zigmond, A. and Snaith, R. (1983) The hospital anxiety and depression scale. Acta Psychiatry Scandinavia, 67, 361-370. doi:10.1111/j.1600-0447.1983.tb09716.x
- Garner, D. (2008) Eating attitudes test© (eat-26): Scoring and interpretation.
- Hermanns, N., Kulzer, M., Krichbaum, M., Kubiak, T. and Haak, T. (2006) How to screen for depression and emotional problems in patients with diabetes: Comparison of screening characteristics of depression questionnaires, measurement of diabetes-specific emotional problems and standard clinical assessment. Diabetologia, 49, 469-477. doi:10.1007/s00125-005-0094-2
- Welch, G., Weinger, K., Anderson, B. and Polonsky, W. (2003) Responsiveness of the problem areas in diabetes (paid) questionnaire. Diabetic Medicine, 20, 69-72. doi:10.1046/j.1464-5491.2003.00832.x
- Anderson, R., Fitzgerald, J., Gruppen, L., Funnell, M. and Oh, M. (2003) The diabetes empowerment scale-short form (des-sf). Diabetes Care, 26, 1641-1642. doi:10.2337/diacare.26.5.1641-a
- Lloyd, C., Dyert, P. and Barnett, A. (2000) Prevalence of symptoms of depression and anxiety in a diabetes clinic population. Diabetic Medicine, 17, 198-202. doi:10.1046/j.1464-5491.2000.00260.x
- Garner, D., Olmsted, M., Bohr, Y. and Garfinkel, P. (1982) The eating attitude test: Psychometric features and clinical correlates. Psychological Medicine, 12, 871-878. doi:10.1017/S0033291700049163
- Pencina, M.J., D’ Agostino, R.B. and Vasan, R.S. (2008) Evaluating the added predictive ability of a new marker: From area under the roc curve to reclassification and beyond. Statistics in Medicine, 27, 157-172. doi:10.1002/sim.2929
- Bryden, K., Dunger, D., Mayou, R., Peveler, R. and Neil, H.A. (2003) Poor prognosis of young adults with type 1 diabetes: A longitudinal study. Diabetes Care, 26, 1052- 1057. doi:10.2337/diacare.26.4.1052
- Kipps, S., Bahu, T., Ong, K., et al. (2002) Current methods of transfer of young people with type 1 diabetes to adult services. Diabetic Medicine, 19, 649-654. doi:10.1046/j.1464-5491.2002.00757.x
- Greene, S. and Greene, A. (2005) Changing from the paediatric to the adult service: Guidance on the transition of care. Practical Diabetes International, 22, 41-45. doi:10.1002/pdi.743
- Howe, C.J., Jawad, A.F., Kelly, S.D. and Lipman, T.H. (2008) Weight-related concerns and behaviors in children and adolescents with type 1 diabetes. Journal of the American Psychiatric Nurses Association, 13, 376-385. doi:10.1177/1078390307310154
- Hoffman, R. (2001) Eating disorders in adolescents with type 1 diabetes: A closer look at a complicated condition. Postgraduate Medicine, 109, 67. doi:10.3810/pgm.2001.04.910
- Rubin, R., Peyrot, M. and Saudek, C. (1989) Effect of diabetes education on self-care, metabolic control, and emotional well-being. Diabetes Care, 12, 673-679. doi:10.2337/diacare.12.10.673
- Stewart, S., Lee, P., Waller, D., et al. (2003) A follow-up study of adherence and glycemic control among hong kong youths with diabetes. Journal of Pediatric Psychology, 28, 67-79. doi:10.1093/jpepsy/28.1.67
- Wallston, K., Rothman, R. and Cherrington, A. (2007) Psychometric properties of the perceived diabetes selfmanagement scale (pdsms). Journal of Behavioral Medicine, 30, 395-401. doi:10.1007/s10865-007-9110-y
- Sacco, W.P. and Bykowski, C.A. (2010) Depression and hemoglobin a1c in type 1 and type 2 diabetes: The role of self-efficacy. Diabetes Research and Clinical Practice, 90, 141-146. doi:10.1016/j.diabres.2010.06.026
- Barnard, K., Skinner, T. and Peveler, R. (2006) The prevalence of co-morbid depression in adults with type 1 diabetes: Systematic literature review. Diabetic Medicine, 23, 445-448. doi:10.1111/j.1464-5491.2006.01814.x
- Shaban, M.C., Fosbury, J., Kerr, D. and Cavan, D.A. (2006) The prevalence of depression and anxiety in adults with type 1 diabetes. Diabetic Medicine, 23, 1381-1384. doi:10.1111/j.1464-5491.2006.02012.x
- Hislop, A.L., Fegan, P.G., Schlaeppi, M.J., Duck, M. and Yeap, B.B. (2008) Prevalence and associations of psychological distress in young adults with type 1 diabetes. Diabetic Medicine, 25, 91-96. doi:10.1111/j.1464-5491.2007.02310.x
- Simon, G.E., Katon, W.J., Lin, E.H.B., et al. (2007) Costeffectiveness of systematic depression treatment among people with diabetes mellitus. Archives General Psychiatry, 64, 65-72. doi:10.1001/archpsyc.64.1.65
- Bryden, K.S., Peveler, R.C., Stein, A., Neil, A., Mayou, R.A. and Dunger, D.B. (2001) Clinical and psychological course of diabetes from adolescence to young adulthood: A longitudinal cohort study. Diabetes Care, 24, 1536- 1540. doi:10.2337/diacare.24.9.1536
- Carr-Gregg, M., Enderby, K. and Grover, S. (2003) Risktaking behaviour of young women in australia: Screening for health-risk behaviours. Medical Journal of Australia, 178, 601-604.
- Mater Hospital. (2008) Best practice guidelines for health professionals: For the effective transition of young people with diabetes from paediatric to adult care. Queensland Health, Brisbane.
- Allen, D. and Gregory, J. (2009) The transition from children’s to adult diabetes services: Understanding the “problem”. Diabetic Medicine, 26, 162-166. doi:10.1111/j.1464-5491.2008.02647.x
NOTES
*Conflict of interest: The authors declare they have no conflict of interest.