Journal of Diabetes Mellitus
Vol.2 No.2(2012), Article ID:19346,7 pages DOI:10.4236/jdm.2012.22028
Dose-dependent relationship between serum metformin levels and glycemic control, insulin resistance and leptin levels in females newly diagnosed with type 2 diabetes mellitus
![]()
1Department of Pharmacology and Therapeutics, College of Pharmacy, Al-Mustansriya University, Baghdad, Iraq
2Departments of Pharmacology and Toxicology, College of Pharmacy, University of Baghdad, Baghdad, Iraq; *Corresponding Author: saad_alzaidi@yahoo.com
3Specialized Center for Endocrinology and Diabetes, Baghdad, Iraq
Received 13 January 2012; revised 24 February 2012; accepted 22 March 2012
Keywords: Type 2 diabetes mellitus; leptin; BMI; serum metformin; glycemic control
ABSTRACT
Despite the extensive clinical experience with the use of metformin worldwide, no formal doseranging study has been conducted because the current dosing strategy of metformin was determined empirically, rather than by an understanding of its dose-response relationship in patients with type 2 diabetes. The present study was designed to evaluate the correlation between serum metformin levels and glycemic control, insulin resistance and leptin levels in females newly diagnosed with type 2 diabetes. Sixty type 2 diabetic females were recruited for the study and were allocated into 3 groups; each receiving metformin 1000, 1500 and 2000 mg/day respectively for 3 months. Blood samples withdrawn from each patient at zero time and after 3 months is used to evaluate serum levels of HbA1c, glucose, leptin and insulin, in addition, the measurement of serum level of metformin in blood after 3 months by HPLC. The results demonstrated that all the treated groups with different doses of metformin showed significant improve in all parameters; the use of increased metformin doses was only correlated with plasma leptin levels in the highest dose. In conclusion, serum metformin levels are not good predictors for correlating improvement in clinical and biochemical parameters with increasing the dose in newly diagnosed non-insulin resistant females with type 2 diabetes.
1. INTRODUCTION
Metformin is an insulin sensitizer used for treating type 2 diabetes (DM), and widely used as an oral glucose-lowering agent that improves insulin sensitivity in peripheral target organs like skeletal muscle, fat tissue, and liver [1]. In addition, metformin has long been suggested clinically to reduce food intake in diabetic and nondiabetic patients [2]. Its use is only rarely complicated by lactic acidosis. The substance is cleared from the blood through the kidneys [3], and impaired renal function may lead to accumulation. It is also well known that metformin administration reduces body weight [4]. Moreover, metformin decreases leptin concentration in morbidly obese subjects [5] and in normal-weight healthy men [6]. Although leptin concentration is closely related to body fat mass, the leptin-reducing effect of metformin cannot be fully explained by body weight reduction because metformin reduces leptin level even without changing body weight in normal-weight healthy men [6]. Despite extensive clinical research and clinical experience worldwide, no formal dose-ranging study has been conducted because, when the drug was originally developed the current dosing strategy of metformin was determined empirically, rather than by an understanding of the minimal effective dose or of its dose-response relationship in patients with type II diabetes. Metformin is a strong base and at physiological pH, it exists virtually only (>99.9%) in its cationic form. Thus, its passage across cell membranes is heavily dependent on transporters, and intestinal absorption of metformin is dose dependent and involves an active, saturable uptake process [7], while its plasma protein binding is negligible [8]. Moreover, the bioavailability of metformin is not complete, and large interindividual differences in bioavailability after oral administration in the range of 20% - 70% have been described [9]. The clinical effects of metformin develop slowly over several days of treatment at least [10] and the range of plasma concentrations over a dosage interval depends upon the formulation without any significant effect on the clinical response [11]. The present study was designed to evaluate the dose-response relationship between serum metformin levels and glycemic control, insulin resistance and leptin levels in females newly diagnosed with type 2 diabetes.
2. SUBJECTS AND METHODS
The present study was a single center, open-label, randomized parallel group study conducted at the Specialized Center for Diabetes and Endocrinology/Baghdad during the period from November 2009 till July 2011. The study protocol was approved by the local clinical research ethics committee in accordance with Helsinki declaration 1998; and all subjects gave written informed consent to participate in the study. Only females with age more than 35 yrs, BMI ranging from 25 - 29.9 kg/m2, glycosylated hemoglobin >7% and fasting plasma glucose ≥126 mg/dL (7.0 mmol/L) [12] were included in the study. The patients should not be previously treated with oral hypoglycemic agents before the time of enrollment. Patients with current insulin therapy or received insulin for more than six weeks in last 3 months, who had known hypersensitivity to biguanides and who are on chronic medication known to affect glucose metabolism were excluded from the study; all were given instructions to follow restricted diet and asked to monitor their blood glucose level, both fasting and postprandial, glycosylated hemoglobin and lipid profile at the initial visit to the center. The patient’s records were maintained for the next three month after their initial visit to hospital; they were observed for weight, height and blood pressure measurement. The patients were randomized into three groups according to the treatment they received; first group includes 20 patients treated with 500 mg metformin tablet twice daily for 3 months; second group includes 20 patients treated with 500 mg metformin tablet three times daily for 3 months; third group includes 20 patients treated with 1000 mg metformin two times daily for three months. Another group of 20 healthy females matched with patients for age were included and served as control. After 12 hrs fasting, blood samples (10 ml) were obtained from each patient for the evaluation of FPG, HbA1c, leptin and insulin levels at zero time and after three months of treatment using standard methods [13-16]. Plasma levels of metformin were analyzed by HPLC method [17,18]. Body weight and BMI were also evaluated within the same previously mentioned periods.
Statistical Analysis
Data were presented as mean ± SD or ± SEM. Preand post-treatment values were statistically analyzed using paired Student’s t test, while two ways ANOVA was utilized to compare values between different groups. Pearson’s correlation was performed to evaluate the relationship between metformin levels and the values of other parameters as a response to different doses of metformin. Values with P < 0.05 are considered significantly different.
3. RESULTS
As shown in table 1, treatment of newly diagnosed diabetic females with metformin in different doses (1000 mg, 1500 mg and 2000 mg) for 3 months significantly decreases fasting plasma glucose in all groups (19.02%, 22.04%, and 24.29% respectively; P < 0.05) compared with baseline value. All metformin doses also produced significant decrease in HbA1c levels (P < 0.05) compared to pre-treatment values. However, the percent change in HbA1c produced due to the use 2 g metformin was significantly greater (26.39%) than those produced by other doses (25.79% for 1500 mg and 25.71% for 1000 mg; P < 0.05). Meanwhile, table 1 showed that all metformin doses produced significant decrease in serum insulin levels compared to pre-treatment values; (−0.42%, −0.42%, and −0.42% respectively, P < 0.05). Concerning insulin resistance marker, the results showed that there is a significant decrease in this value all groups of patients (P < 0.05) compared with baseline values. Moreover, table 1 showed that treatment with maximum dose of metformin (2000 mg) produces the highest percent reduction in this parameter after 3 months (−24.1%) compared with the effect of other doses of metformin (1500 mg: −22.46% and 1000 mg: −19.13%). As shown in table 1, treatment of diabetic females with different doses of metformin significantly decreases the serum levels of leptin after 3 months compared to baseline values (P < 0.05), and the maximum dose of metformin (2000 mg) produced significant and highest percent reduction in this parameter (−40.58%) compared with baseline values (P < 0.05), while the other doses of lead to less effect in this respect (1500 mg: −34.7% and 1000 mg: −25.28%; P < 0.05). Concerning the effect on BMI, table 1 showed that all used doses of metformin significantly decreased BMI values after 3 months compared to baseline values (P < 0.05), and the highest reduction in BMI value was reported due to the 2000 mg dose (−7.76%), while the other doses produced less effect in this respect (−6.65 and −6.05, respectively). Figure 1, showed the average steady state (Cav,ss) serum levels of metformin in diabetic females treated with different doses of metformin (1000, 1500 and 2000 mg/day) after 3 months of treatment;
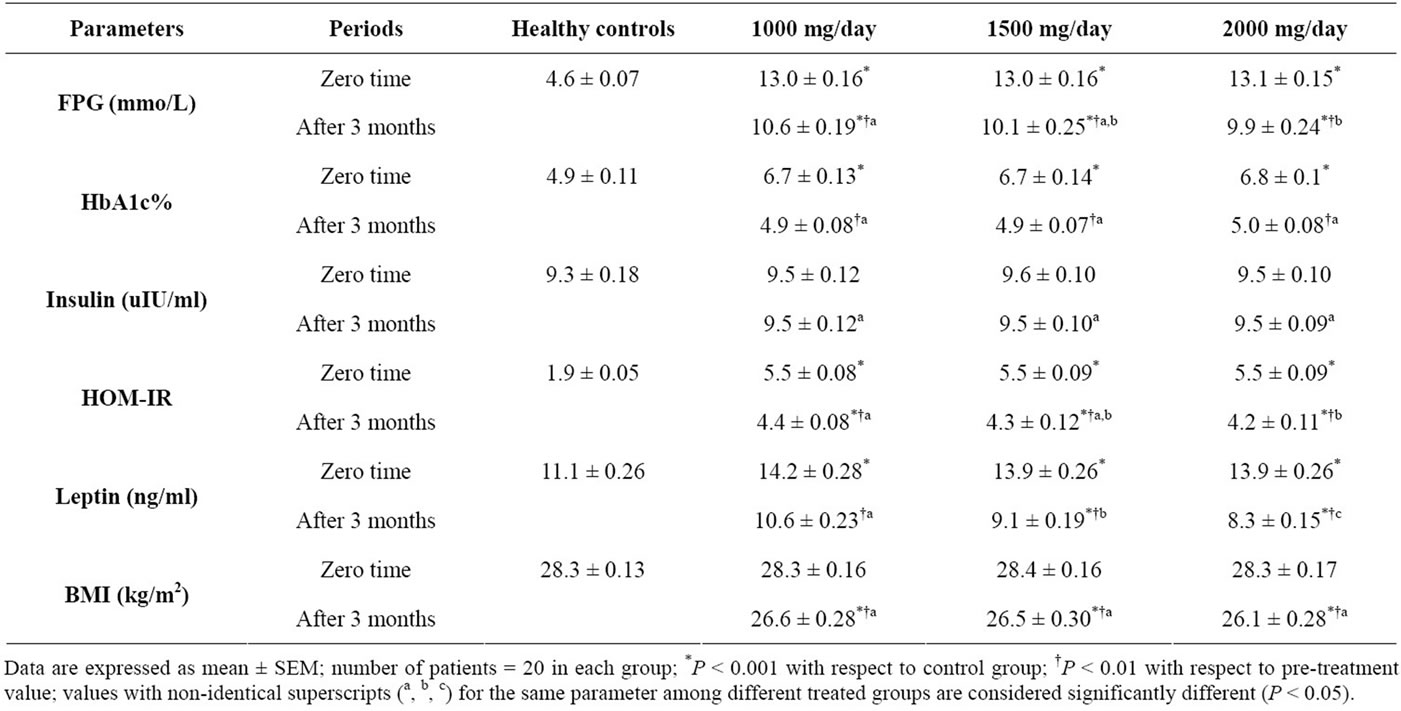
Table 1. Effects of treatment with metformin in different doses (1000 mg, 1500 mg and 2000 mg) on BMI and glycemic control, insulin level and leptin level in serum of newly diagnosed females with type 2 diabetes mellitus.
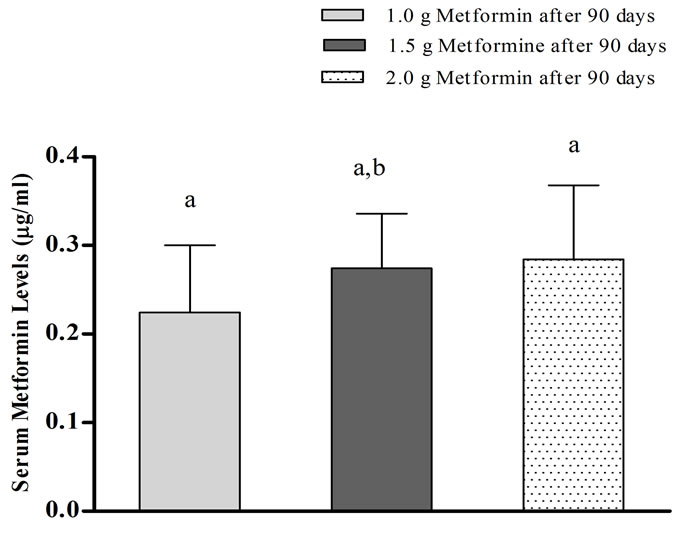
Figure 1. Serum levels of metformin in females with type 2 diabetes mellitus treated with either 1000 mg, 1500 mg or 2000 mg for 3 months; values with different letters (a, b) represent significant differences between treated groups (P < 0.05).
although they are treated with different doses of metformin, no significant differences (P > 0.05) reported between Cav,ss values in those different groups. Concerning the correlation between Cav,ss values due to treatment with different doses with some of the clinical and biochemical parameters in females with type 2 DM, figures 2-7 showed that a non-significant and weak correlation were reported between serum metformin level due to treatment with all doses of metformin (1000, 1500 and 2000 mg/day) with FPG, HbA1c, serum insulin, HOMAIR and BMI in females with type 2 DM after 3 months of
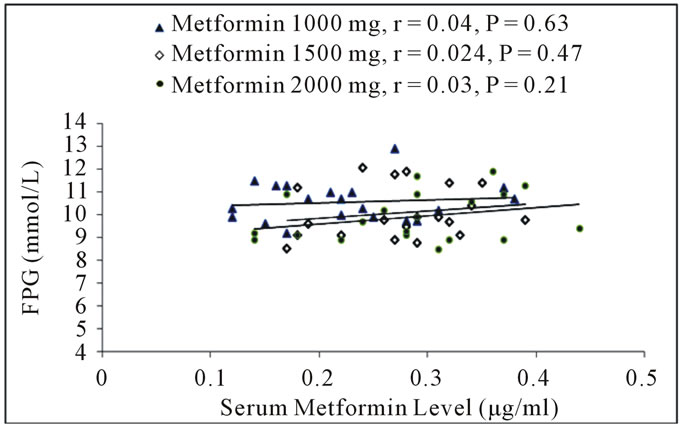
Figure 2. Correlation between serum metformin levels due to treatment with different doses with fasting plasma glucose levels in females with type 2 diabetes mellitus after 3 months.
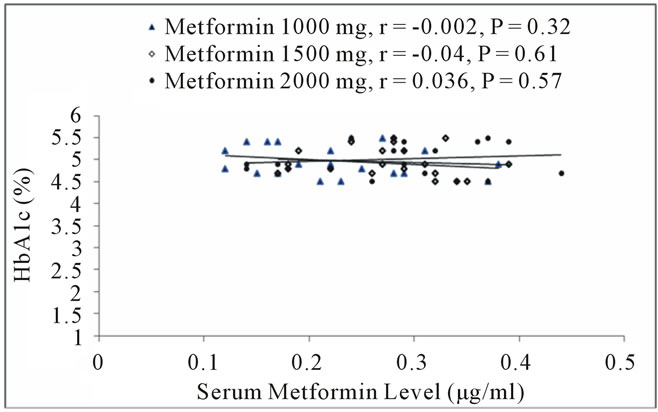
Figure 3. Correlation between serum metformin levels due to treatment with different doses with HbA1c levels in females with type 2 diabetes mellitus after 3 months.
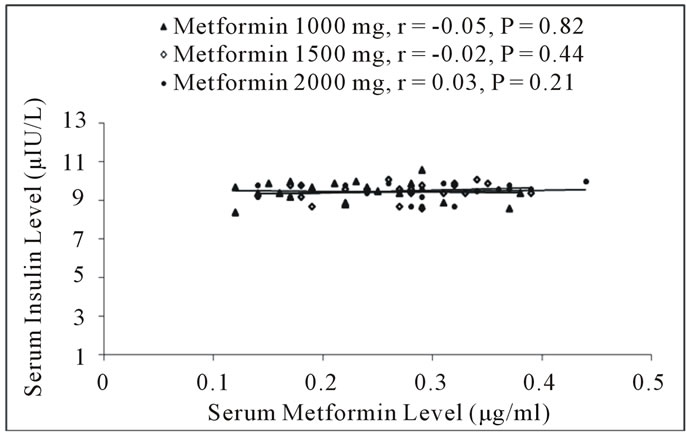
Figure 4. Correlation between serum metformin levels due to treatment with different doses with serum insulin levels in females with type 2 diabetes mellitus after 3 months.
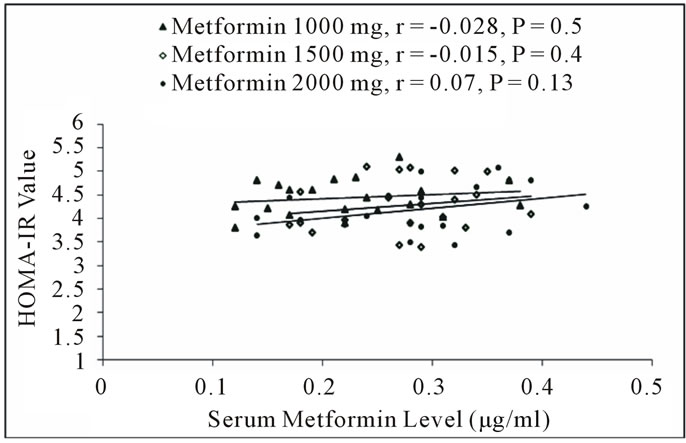
Figure 5. Correlation between serum metformin levels due to treatment with different doses with HOMA-IR value in females with type 2 diabetes mellitus after 3 months.
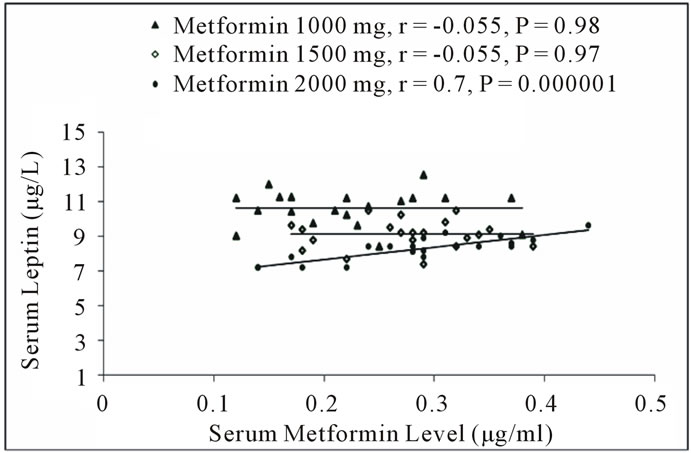
Figure 6. Correlation between serum metformin levels due to treatment with different doses with serum leptin levels in females with type 2 diabetes mellitus after 3 months.
treatment; however, figure 6 showed that serum leptin levels were poorly and non-significantly correlated with serum metformin levels except for the level achieved after 2 g/day dose, where significant and positive correlation was reported.
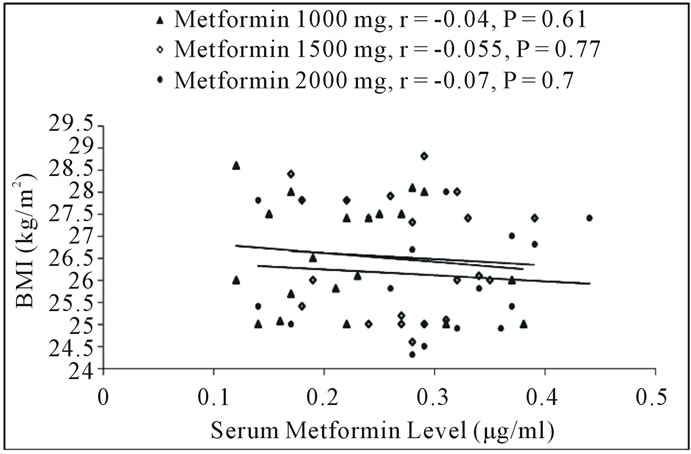
Figure 7. Correlation between serum metformin levels due to treatment with different doses with BMI values in females with type 2 diabetes mellitus after 3 months.
4. DISCUSSION
In the present study, the results showed that the use of metformin significantly improving the clinical (body mass index: BMI) and biochemical markers (FPG, HbA1c, serum insulin, insulin resistance and leptin level) in females with type 2 DM. These results are compatible with previously reported data that revealed such effect for metformin as antidiabetic agent for decreasing of blood glucose level and increasing the insulin sensitivity without increasing of insulin secretion [19] with decreasing the markers of insulin resistance (HOMA-IR) and BMI [4]. The present study showed that increasing the initial dose of metformin did not reflect a significant variation in the level of glycemic control in the three patients groups, and such finding was supported by the poor correlation coefficient reported between serum metformin levels and the indicators of glycemic control, although these parameters are significantly improved in all groups. The clinical effects of metformin develop slowly over several days of treatment at least [10] and the range of plasma concentrations over a dosage interval depends upon the formulation without any significant effect on the clinical response [11]. Consequently, one may expect that the Cav,ss should provide the best correlate with the clinical and biochemical effects of metformin, the condition which is not clearly demonstrated in the present study; this is not really attributed to the differences in the utilized metformin formulation because the patients included in the study were supplied by the same type of formulation to avoid discrepancies in this respect. Accordingly, the suggested reason for such finding is the variation and inconsistent pharmacokinetics of metformin in diabetic patients. Mette et al. demonstrate huge interindividual variations in trough steady-state metformin plasma levels in type 2 diabetics which may be attributed to the OCT1 transporter activity under trough steady-state conditions [20]. Moreover, Yasmin et al. reported that there is no benefit from increased doses of metformin in females with PCOS, but reduction of insulin resistance is more significant in those patients with lower insulin sensitivity at baseline [21]; such condition is not clearly manifested in the present study due to relatively short duration of treatment, but at least impart support the idea of avoiding dose escalation without monitoring clinical improvement. Frid et al. (2010) show considerable intra-individual variations of 29.4% for metformin levels in 20 patients with impaired renal function, which probably reflects the heterogeneity of the study population, and such wide intra-individual variation seen in this study probably also exists in daily clinical practice [22]. Moreover, genetic variation in the genes coding OCT1, OCT2, MATE1, and MATE2 (membrane transporters of metformin) have been linked to an altered pharmacodynamic and pharmacokinetic response to metformin; the genetic component to the variation in renal metformin clearance has been estimated to be approximately 90% [23]. Thus, the non-significant differences in the correlations between plasma steady-state concentrations of metformin with glycemic control and insulin resistance reported here most likely reflect a combination of variation in the renal excretion of metformin, volume of distribution, and in the bioavailability of the drug [20]. The lowering of blood glucose by metformin develops over at least 10 days [8] indicating that metformin has a long residence time in the liver or other effect compartments. Consequently, the greater fluctuation of plasma concentrations should not be clinically significant, as has been observed in the present study. Metformin exhibits flip-flop kinetics, where the slow absorption of metformin is the rate-limiting factor in its disposition, and clinical trials with metformin have demonstrated decreased bioavailability at higher doses, suggesting saturable intestinal absorption [9], and accordingly we can explain the non-significant differences between average steady state plasma concentrations after administration of increased doses. In type 2 DM patients, metformin was demonstrated to have no effect in erythrocyte insulin receptor binding, but it increased both basal and insulin stimulated insulin receptor tyrosine kinase activities of solubilized erythrocyte insulin receptors after 10 wk of treatment [24]. However, the increase of insulin binding in various cell types after metformin administration does not directly correlate with clinical and metabolic effects; the reported poor correlation between plasma metformin levels and the clinical and metabolic effects can be explained accordingly. Harborne et al. have suggested that weight loss due to long-term use of metformin may be a dose-related response with increased weight loss at higher doses [25]. Moreover, metformin appears to accumulate in erythro 0 cytes and consequently may be a part of a deep compartment for the drug [26], which supposes to affect the pharmacokinetics of the drug; such finding could explain our results, which also in accordance with the results reported by Marchetti et al. who demonstrated that metformin plasma level was not correlated with plasma glucose and HbA1c [27]. Bruno et al. compared two doses of metformin (1500 mg and 2500 mg), with BMI and waist circumference as their primary end point [28]. A significant drop in BMI and waist circumference was seen in the group using the higher of the two doses. However, in our study no significant differences reported in BMI reduction due to dose escalation; this is in agreement with the Cochrane review of insulin sensitizing drugs for polycystic ovary syndrome, which showed no evidence of effect of increasing the dose of metformin on the degree of reduction in BMI [29]. Morin et al. have demonstrated that insulin sensitizing therapy with metformin results in a decrease in leptin levels in patients PCOS [30]; meanwhile, Paolisso et al. supported the data of Morin et al. by showing that metformin decreases leptin in obese non-diabetics [31]. In the present study, serum leptin levels decreased in all patients groups after 3 months of treatment with metformin to levels lower than that reported in healthy controls, and as an exception to all evaluated parameters, the metformin-induced decrease in leptin levels was found to be dose-related, but only correlated with serum metformin due to administration of 2000 mg/day; this finding require further investigations. The present study did not establish further improved efficacy of metformin in higher doses; the changes were observed from an early period of around 12 weeks and longer follow up may be necessary for predicting more changes. The limitations of the current study are that the trial was conducted in a pilot format and no power calculation was done due to the paucity of data on dose calculation of metformin in newly diagnosed diabetic females; the numbers therefore are small. The dose escalation design was adopted as it was found to be comparable to the crossover design. The study, however, demonstrates improved insulin sensitivity of metformin in diabetic patients without insulin resistance.
5. CONCLUSION
The use of increased metformin doses as an initial treatment of diabetic non-insulin resistant females did not reveal logic correlation between serum metformin levels and improvement efficacy; we suggest more detailed and longer duration study to explore such controversy in metformin efficacy.
6. ACKNOWLEDGEMENTS
The present work was abstracted from PhD thesis submitted to the Department of Clinical Pharmacy, College of Pharmacy and University of Baghdad. The authors thank University of Baghdad for supporting the project and the Specialized Center for Diabetes and Endocrinology for clinical and technical assistance.
![]()
![]()
REFERENCES
- Kirpichnikov, D., McFarlane, S.I. and Sowers, J.R. (2002) Metformin: An update. Annals of International Medicine, 137, 25-33.
- Kahn, S.E., Haffner, S.M., Heise, M.A., Herman, W.H., Holman, R.R., Jones, N.P., et al. (2006) Glycemic durability of rosiglitazone, metformin, or glyburide monotherapy. The New England Journal of Medicine, 355, 2427-2443. doi:10.1056/NEJMoa066224
- Scheen, A.J. (1996) Clinical pharmacokinetics of metformin. Clinical Pharmacokinetics, 30, 359-371. doi:10.2165/00003088-199630050-00003
- Kay, J.P., Alemzadeh, R., Langley, G., D’Angelo, L., Smith, P. and Holshouser, S. (2001) Beneficial effects of metformin in normoglycemic morbidly obese adolescents. Metabolism, 50, 1457-1461. doi:10.1053/meta.2001.28078
- Glueck, C.J., Fontaine, R.N., Wang, P., Subbiah, M.T.R., Weber, K., Illig, E., et al. (2001) Metformin reduces weight, centropedal obesity, insulin, leptin, and low-density lipoprotein cholesterol in non-diabetic, morbidly obese subjects with body mass index greater than 30. Metabolism, 50, 856-861. doi:10.1053/meta.2001.24192
- Fruehwald-Schultes, B., Oltmanns, K.M., Toschek, B., Sopke, S., Kern, W., Born, J., et al. (2002) Short-term treatment with metformin decreases serum leptin concentration without affecting body weight and body fat content in normal-weight healthy men. Metabolism, 51, 531- 536. doi:10.1053/meta.2002.31332
- Pentikainen, P.J., Neuvonen, P.J. and Penttila, A. (1979) Pharmacokinetics of metformin after intravenous and oral administration to man. European Journal of Clinical Pharmacology, 16, 195-202. doi:10.1007/BF00562061
- Graham, G.G., Punt, J., Arora, M., Day, R.O., Doogue, M.P., Duong, J.K., et al. (2011) Clinical pharmacokinetics of metformin. Clinical Pharmacokinetics, 50, 81-98. doi:10.2165/11534750-000000000-00000
- Sambol, N.C., Chiang, J., O’Conner, M., Liu, C.Y., Lin, E.T., Goodman, A.M., et al. (1996) Pharmacokinetics and pharmacodynamics of metformin in healthy subjects and patients with noninsulin-dependent diabetes mellitus. The Journal of Clinical Pharmacology, 36, 1012-1021. doi:10.1177/009127009603601105
- Hong, Y., Rohatagi, S., Habtemariam, B., et al. (2008) Population exposure-response modeling of metformin in patients with type 2 diabetes mellitus. The Journal of Clinical Pharmacology, 48, 696-707. doi:10.1177/0091270008316884
- Schwartz, S., Fonseca, V., Berner, B., et al. (2006) Efficacy, tolerability, and safety of a novel once-daily extended-release metformin in patients with type 2 diabetes. Diabetes Care, 29, 759-764. doi:10.2337/diacare.29.04.06.dc05-1967
- American Diabetic Association. (2008) Diagnosis and classification of diabetes mellitus. Diabetes Care, 31, S55-S60. doi:10.2337/dc08-S055
- Barham, D. and Trinder, P. (1972) An improved color reagent for the determination of blood glucose by the oxidative system. Analyst, 97, 142-145. doi:10.1039/an9729700142
- Abraham, E.C., Huff, T.A., Cope, N.D., Wilson, J.B., Bransome, E.D. and Huisman, T.H. (1978) Determination of the glycosylated hemoglobin (HbA1c) with a new micro column procedure, suitability of the technique for assessing the clinical management of diabetes mellitus. Diabetes, 27, 931.
- Guillaume, M. and Bjorntorp, P. (1996) Obesity in children: Environmental and genetic aspects. Hormone and Metabolic Research, 28, 573-581. doi:10.1055/s-2007-979856
- Flier, J.S., Kahn, C.R. and Roth, J. (1979) Receptor, antireceptor antibodies and mechanisms of insulin resistance. The New England Journal of Medicine, 300, 413-419. doi:10.1056/NEJM197902223000808
- Cheng, C.L. and Chou, C.H. (2011) Determination of metformin in human plasma by high-performance liquid chromatography with spectrophotometric detection. Journal of Chromatography, 762, 51-58.
- Choi, Y.H., Lee, M.G. and Lee, I. (2008) Effects of diabetes mellitus induced by alloxan on the pharmacokinetics of metformin in rats: Restoration of pharmacokinetic parameters to the control state by insulin treatment. Journal of Pharmacy Pharmaceutical Sciences, 11, 88-103.
- UK Prospective Diabetes Study (UKPDS) Group. (1998) Effect of intensive blood-glucose control with metformin on complications in overweight patients with type 2 diabetes. The Lancet, 352, 854-865. doi:10.1016/S0140-6736(98)07037-8
- Christensen, M.M., Brasch-Andersen, C., Green, H., Nielsen, F., Damkier, P., Beck-Nielsen, H. and Brosen, K. (2011) The pharmacogenetics of metformin and its impact on plasma metformin steady-state levels and glycosylated hemoglobin A1c. Pharmacogenetics and Genomics, 21, 837-850. doi:10.1097/FPC.0b013e32834c0010
- Yasmin, E., Glanville, J., Barth, J. and Balen, A.H. (2011) Effect of dose escalation of metformin on clinical features, insulin sensitivity and androgen profile in polycystic ovary syndrome. European Journal of Obstetrics and Gynecology and Reproductive Biology, 156, 67-71. doi:10.1016/j.ejogrb.2010.12.041
- Frid, A., Sterner, G.N., Londahl, M., Wiklander, C., Cato, A., Vinge, E. and Andersson, A. (2010) Novel assay of metformin levels in patients with type 2 diabetes and varying levels of renal function. Diabetes Care, 33, 1291-1293. doi:10.2337/dc09-1284
- Leabman, M.K. and Giacomini, K.M. (2003) Estimating the contribution of genes and environment to variation in renal drug clearance. Pharmacogenetics, 13, 581-584. doi:10.1097/00008571-200309000-00007
- Santos, R.F., Nomizo, R., Wajhenberg, B.L., Reaven, G.M. and Azhar, S. (1995) Changes in insulin receptor tyrosine kinase activity associated with metformin treatment of type 2 diabetes. Diabetes and Metabolism, 21, 274-280.
- Harborne, L.R., Sattar, N., Norman, J.E. and Fleming, R. (2005) Metformin and weight loss in obese women with polycystic ovary syndrome: Comparison of doses. The Journal of Clinical Endocrinology and Metabolism, 90, 4593-4598. doi:10.1210/jc.2004-2283
- Lalau, J.D. and Lacroix, C. (2003) Measurement of metformin concentration in erythrocytes: Clinical implications. Diabetes, Obesity and Metabolism, 5, 93-98. doi:10.1046/j.1463-1326.2003.00241.x
- Marchetti, P., Benzi, L., Cecchetti, P., Giannarelli, R., Boni, C., Ciociaro, D., Ciccarone, A.M., Di Cianni, G., Zappella, A. and Navalesi, R. (1987) Plasma biguanide levels are correlated with metabolic effects in diabetic patients. Clinical Pharmacology and Therapeutics, 41, 450- 454. doi:10.1038/clpt.1987.55
- Bruno, R.V., de Avilla, M.A., Neves, F.B., Nardi, A.E., Crespo, C.M. and Sobrinho, A.T. (2007) Comparison of two doses of metformin (2.5 and 1.5 g/day) for the treatment of polycystic ovary syndrome and their effect on body mass index and waist circumference. Fertility and Sterility, 88, 510-512. doi:10.1016/j.fertnstert.2006.11.133
- Tang, T., Lord, J.M., Norman, R.J., Yasmin, E. and Balen, A.H. (2010) Insulin-sensitizing drugs (metformin, rosiglitazone, pioglitazone, d-chiro-inositol) for women with polycystic ovary syndrome, oligo amenorrhoea and subfertility. Cochrane Database of Systematic Reviews, 1. doi:10.1002/14651858
- Morin-Papunen, L.C., Koivunen, R.M., Tomas, C., Ruokonen, A. and Martikanian, H.K. (1998) Decreased serum leptin concentrations during metformin therapy in obese with PCOS. The Journal of Clinical Endocrinology and Metabolism, 83, 2566-2568. doi:10.1210/jc.83.7.2566
- Paolisso, G., Amato, L., Eccellente, R., et al. (1998) Effect of metformin on food intake in obese subjects. European Journal of Clinical Investigation, 28, 441-446. doi:10.1046/j.1365-2362.1998.00304.x