Journal of Sensor Technology
Vol.1 No.4(2011), Article ID:8947,9 pages DOI:10.4236/jst.2011.14016
Synthesis and Humidity Sensing Investigations of Nanostructured ZnSnO3
Department of Physics, University of Lucknow, Lucknow, India
E-mail: yadav.av11@gmail.com
Received August 31, 2011; revised October 14, 2011; accepted October 29, 2011
Keywords: Zinc Stannate, SEM, XRD, UV-Visible Absorption Spectroscopy, Humidity
Abstract
In this paper zinc stannate (ZnSnO3) nanoparticles was synthesized by a chemical precipitation method. The synthesized samples were characterized using X-ray powder diffraction (XRD), Differential scanning calorimetry (DSC) and UV-Visible absorption spectroscopy. Sensing material was made as pellet by hydraulic press machine under uniform pressure of 616 MPa. Then the material was annealed at 600˚C. Surface morphologies of the samples were analyzed using Scanning electron microscopy (SEM) for pellet of different weight ratio annealed at 600˚C. The XRD pattern indicates that ZnSnO3 has a perovskite phase with an orthorhombic structure having minimum crystallite size 4 nm. Further, humidity sensing investigations of these sensing materials were done. Our result indicate that ZnSnO3 in form of pellet annealed at 600˚C for 1:4 weight ratio was most sensitive of humidity in comparison to pure SnO2 under same conditions. Maximum sensitivity of the sample was 3 GΩ/% RH which is better in comparison to pure SnO2. The results were reproducible up to ± 77% after 2 months of observations.
1. Introduction
Zinc stannate or Zinc tin oxide (ZTO) is a class of ternary oxides that are known for their stable properties under extreme conditions and are useful for electrical as well as optical properties [1-6]. Its unique physical, chemical and structural properties may play important role in humidity sensing. Humidity sensors have been important for the accurate control and reliable estimate of water vapours content in atmospheres from industrial processes to the general improvement of the quality of life [7-11]. Generally a humidity sensor has to possess fast response, high sensitivity, negligible hysteresis over periods of usage and possibly a large operating range for both humidity and temperature. The importance of humidity sensing has been well understood and many researchers have been focussed on the development of humidity sensitive materials [12-16]. Most humidity detection studies have investigated on the use of polymer [17-22] and ceramic materials due to their low cost and excellent performance [23-27]. The aim of the present study has been to seek a material that possesses good sensitivity over the entire range of humidity and should be stable over time. As an n-type wide band gap semiconductor (Eg = 3.6 eV) tin oxide nanostructures having rutile structure attracted great interest in recent years. ZnO is a wide band gap material with a direct band gap (3.37 eV) and large exciton binding energy of 60 MeV. Zinc and tin compounds have recently attracted considerable attention because they exhibit technological properties [28], such as high capacity anode material, which can also be used to oxygen separation acting as a photo catalyst under the action of visible light, humidity and gas sensors [29-31]. Doping is an attractive and effective method for manipulating different applications of semiconductors. The mixture of ZnO and SnO2 show high sensitivity due to heterogeneous interface between them. Sensitivity, selectivity, response time, recovery time and stability can be improved by incorporating different additives to SnO2. Composite type sensors were suggested to improve thermal reliability because they contain many heterogeneous interfaces between different phases. For example ZnO(n)-CuO(p), SnO2(n)- CuO(p), SnO2(n)-ZnO(n) composites showed enhance sensitivities in comparison to single phase materials [32-33]. Composites are advantageous because they tend to be more porous. Especially SnO2 can be made more porous with small amount of ZnO addition [34]. This porosity may play an imperative role in the humidity sensing because the pores of the materials serve as adsorption sites. The sensitivity of the sensor directly depends on these pores size. In this investigation we have prepared ZnSnO3 by chemical precipitation method. The characterization of the materials was done by using various techniques such as X-ray powder diffraction, scanning electron microscopy and differential scanning calorimetry. Further the pellets were made using hydraulic press under uniform pressure of 616 MPa. These pellets were investigated by humidity sensing. Then results were plotted.
2. Experimental Procedure
ZnSnO3 was prepared by using high purity AR grade chemicals ZnO and SnO2. ZnO was synthesized by the typical process, stoichiometric molar amount of zinc acetate [Zn(CH3COO)2·2H2O] was dispersed in double amount of distilled water and small amount (5 - 10 ml) of polyethylene glycol as capping agent was also added. In order to obtain ZnO in hydroxide form a small amount of ammonium hydroxide was added drop wise. Magnetic stirring was done for 24 hours to ensure compete and intimate reaction between various components.The obtained precipitate was centrifuged and washed several times with deionised water to remove residual and other ions. The product was then dried for 6 hours at 120˚C in an electrical oven and calcined at 400˚C in air for 3 hours. Due to complete crystallization of precipitate, ZnO powder was obtained. Further, we have synthesized SnO2 powder via mechanochemical method. SnCl2·2H2O is dissolved in distilled water with continuous stirring for 6 hours. Ammonium hydroxide was mixed drop wise in the solution under constant stirring. Further the solution was sonicated for 30 minutes using ultrasonic machine. The precipitate was washed repeatedly with distilled water. At this stage the product is referred to as-prepared hydrous SnO2. The prepared hydrous SnO2 was again washed with ethanol and further sonicated in ethanol for 30 minutes. SrCO3 nanoparticles were prepared by dropping NH4HCO3 solution into 0.05M Sr(NO3)2 and they were stirred continuously for 2 hours. Further this solution was sonicated for 30 minutes and washed by ethanol. SrCO3 nanoparticles were dissolved in ethanol and form a suspension. This suspension was added to the ethanol treated hydrous SnO2 suspension under stirring. 10% HNO3 solution was added to this solution and further sonicated for 30 minutes. Finally HNO3 solution was added to remove SrCO3 particles. The mixture was evaporated on heating with stirring, dried at 120˚C and calcined at 600˚C for 2 hours. The solid product SnO2 powder was obtained at this stage. The powder of SnO2 and ZnO were taken in weight ratios of 1:1, 1:2, 1:3 and 1:4 respectively and were mixed in absolute ethanol with continuous stirring for 6 hours. The resulting solution was filtered and washed. Then washed sample was dried in oven at 120˚C for 2 hours. Finally a white coloured solid powder obtained after drying. The dried powder was annealed at 600˚C for 2 hours to improve the crystallinity of the material and to remove the residual stresses. Then prepared sample was examined with wide angle XRD analysis (X-Pert, PRO PANalytical XRD system, Netherland). The crystallite size of powdered material was calculated from the X-ray line broadening, using the Debye-Scherrer equation. The pellets of the powders were made by hydraulic press machine (M. B. Instruments, Delhi, India) under a uniaxial pressure of 616 MPa at room temperature. The pellets of different weight ratio were annealed at 600˚C. Hereafter, pellets synthesized in 1:1, 1:2, 1:3 and 1:4 named as ZS-1, ZS-2, ZS-3 and ZS-4 respectively. Each pellet was put within an Ag-pellet-Ag electrode system and exposed in a specially designed humidity chamber. Potassium sulphate (K2SO4) solution in a dish was put within the chamber to increase the humidity from 10% to 95% in the chamber i.e. it acts as a humidifier whereas potassium hydroxide (KOH) solution acts as a dehumidifier i.e. to decrease humidity from 95% to 10%. The electrical resistance of the various pellets was measured using Keithley Electrometer (Model: 6514A).
Thin Film Deposition Techniques
The deposition of the film as functional layers on different substrates is an essential step in many fields of modern high technology with wide application range. The most important methods in the field of interest are subdivided into physical and chemical methods [35]. Physical methods may be characterized by an adsorption and condensation process of the atoms or molecules at the substrate surface. Chemical method involves chemical reaction and so-called precursor molecules dissociate at the hot substrate surface and release the atoms of interest. Among the chemical deposition methods, chemical solution deposition (CSD) is best suited in our case. This method comprises a range of deposition techniques and of chemical routes [36]. The process starts with the preparation of a suitable coating solution from precursors according to the designated film composition and the chemical route to be used. The coating solution is then deposited onto the substrate and the wet film may undergo drying, hydrolysis and condensation reactions depending on the chemical route. Sol-gel spin coating technique is one of the best methods of chemical solution deposition used to deposit uniform thin film [37]. It is advantageous over other conventional thin film techniques because it requires less equipment and is potentially less expensive. Besides this, microstructure and uniformity of the deposited film can easily be controlled by regulating the preparation condition viz. solution concentration/fluid densityfluid viscosity [38], speed of the spinner and annealing temperature.
3. Result and Discussion
3.1. Scanning Electron Microscopy
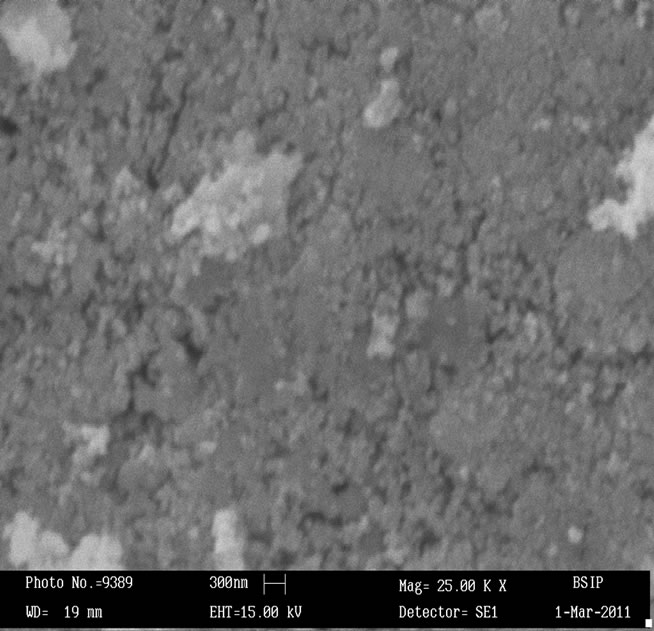
Surface morphology of the sensing pellets ZS-1, ZS-2, ZS-3 and ZS-4 were investigated using Scanning electron microscopy (SEM, LEO-0430, Cambridge). Figures 1(a)-(d) shows SEM image of sensing pellets ZS-1, ZS-2, ZS-3 and ZS-4 respectively. Figure 1(a) predicts SEM image of pellet ZS-1 which shows almost all the particles are spherical in shape leaving some space between them as pores. Surface morphology of pellet ZS-2 was shown in Figure 1(b). This Figure shows more pores as compared to pellet ZS-1. Now ZS-3 reveals that particles agglomerated each other leaving larger pores. Sensing material ZS-4 shows that most particles are spherical in shape having large amount of pores which is promising effect for good sensitivity. Higher porosity increases surface to volume ratio hence help in getting good sensitivity. As annealing temperature increases, the pores in the sample increases which results in absorption of more water vapour giving better sensitivity.
3.2. X-Ray Diffraction Analysis
X-ray powder diffraction (X-Pert, PRO PAN XRD system, Netherland) with CuKα radiation as source having wavelength 1.546 Å were performed for structural analysis and phase identification. Figure 2 shows the XRD
 (a)
(a)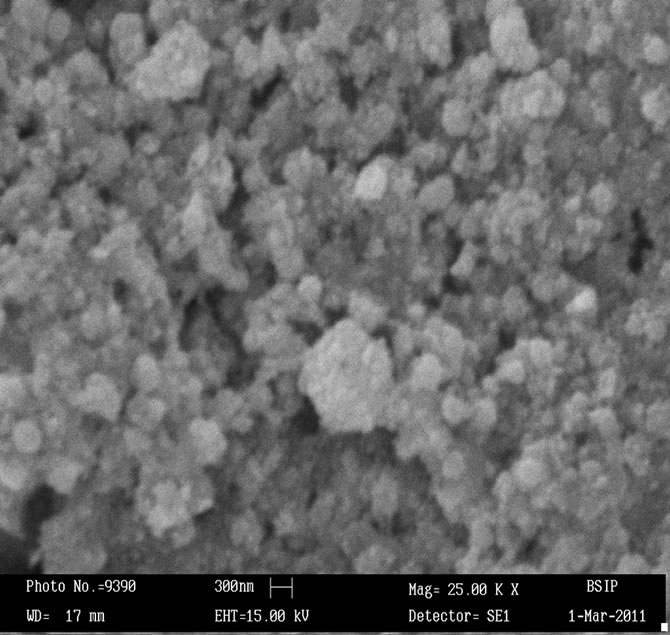 (b)
(b)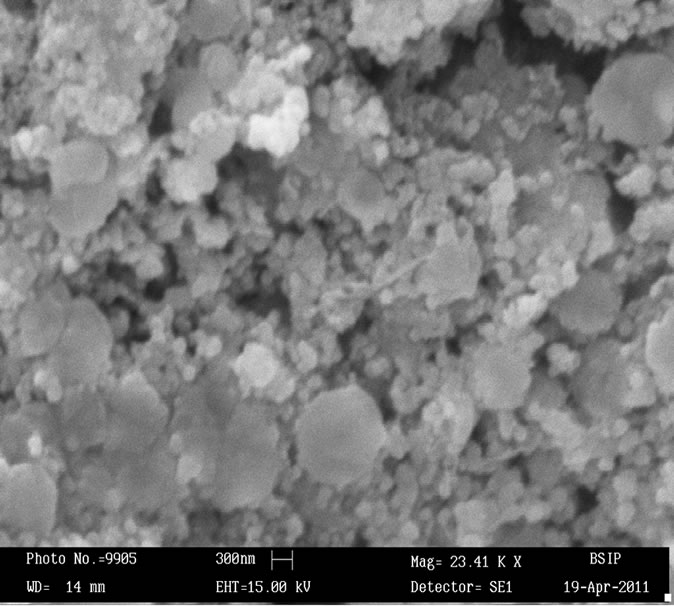 (c)
(c)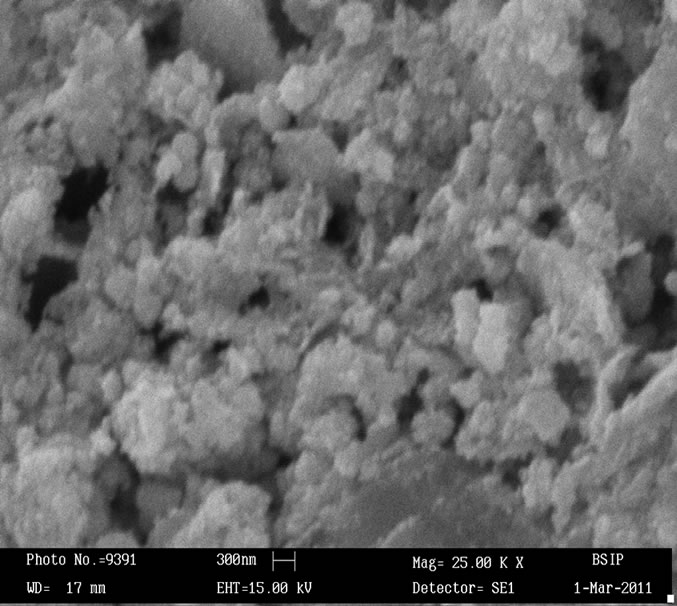 (d)
(d)
Figure 1. (a) SEM image of ZnSnO3 at 600˚C of pellet ZS-1; (b) SEM image of ZnSnO3 at 600˚C of pellet ZS-2; (c) SEM image of ZnSnO3 at 600˚C of pellet ZS-3.; (d) SEM image of ZnSnO3 at 600˚C of pellet ZS-4.
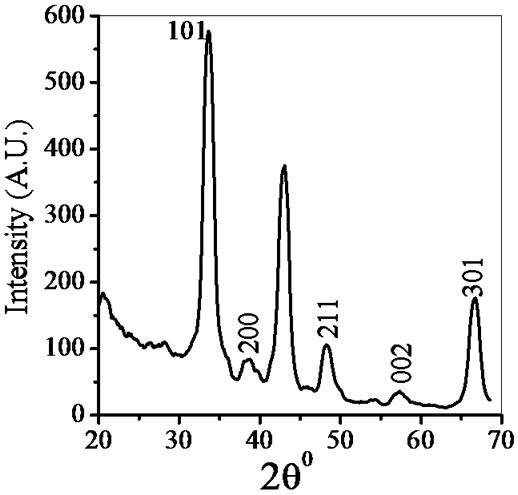
Figure 2. X-ray diffraction of ZnSnO3 at room temperature.
pattern of ZnSnO3 for 1:1 weight ratio. The XRD patterns indicate that ZnSnO3 nanoparticles have a perovskite phase with orthorhombic structure. The peaks of XRD pattern of the sample was analyzed by matching with standard JCPDS data file. Crystallite size of powder was calculated using Debye-Scherer formula which is follows as:
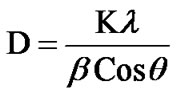
where β is the full width at half maximum (FWHM) of the peak, λ is X-ray wavelength of CuKα, θ is the diffracttion angle and K = 0.94, a dimensionless constant. The peak centered at 2θ = 38.26˚ is assigned to orthorhombic crystallite ZnSnO3 reflection having d spacing 2.95 Ǻ and FWHM value as 2.7˚ gave the smallest size 4 nm. The highest intensity peak centered at 2θ = 33.64˚ is assigned to ZnSnO3 reflection having d spacing 3.35 Ǻ and FWHM value as 1.62˚. Average crystallite size was found to be 6 nm.
3.3. Differential Scanning Calorimetry
Differential Scanning Calorimetry is a technique for recording the energy necessary to establish a zero temperature difference between a substance and a reference material against either time or temperature, as two specimens are subjected to identical temperature regimes in an environment heated or cooled at a controlled rate. The DSC pattern of ZnSnO3 is shown in the Figure 3. This DSC curve shows two endothermic peaks at 85˚C, 125˚C and an exothermic peak at 325˚C respectively. The endothermic peak corresponds to the dehydration of the precursor.
3.4. UV–Visible Absorption Spectroscopy
Optical characterization of the sensing material was done by using UV-visible spectrophotometer (Varian, Carry- 50Bio). UV–visible absorption spectroscopy is a very useful technique for characterizing optical and electronic properties of different materials such as thin films, filters and pigments. It measures the percentage of radiation in the ultra-violet (200 nm - 400 nm) and visible (400 nm - 800 nm) regions that is absorbed at each wavelength. Measurement of the electronic band gap of semiconductor or films is carried out using the data obtained by spectrophotometer. There is a sharp increase in absorption at energies close to the band gap that manifests itself as an absorption edge in the UV-visible absorption spectra. UV-visible absorption spectra of ZnSnO3 in UV and visible range are shown in the Figure 4. ZnSnO3 nanoparticles reveal a strong change of their optical absorption when their size is reduced. The absorption peaks in UVvisible absorption spectra was observed at wavelengths 275 nm and 262 nm for samples ZS-1 and ZS-4 respectively. Therefore, absorption spectra of ZnSnO3 nanoparticles shows blue shift in the absorption edge at 262 nm for ZS-4. The corresponding band gap to the peak wavelength at 262 nm was found 4.7 eV. It is evident that ZnSnO3 shows significant blue shift of the absorption
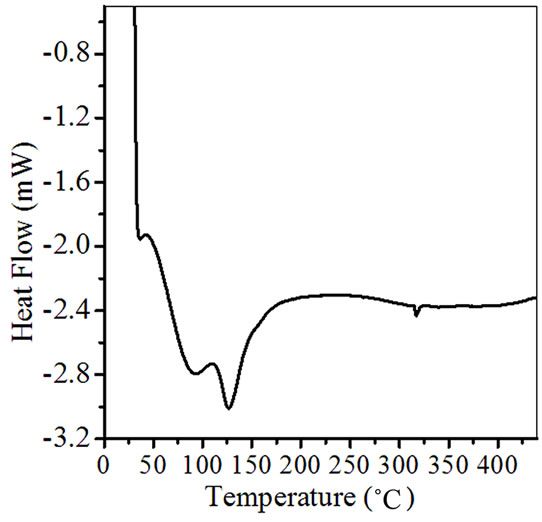
Figure 3. DSC of as synthesized ZnSnO3 for pellet ZS-4.
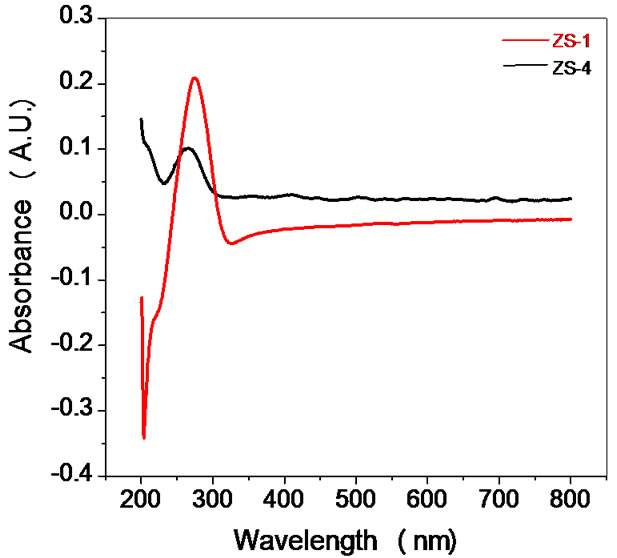
Figure 4. UV of as synthesized ZnSnO3 for samples ZS-1 and ZS-4.
green is 60% RH and red is 80% RH. At low humidity adsorption of water vapour on pores takes rapidly so peak relative to the bulk absorption. A strong UV absorption peak and peak shift (from 275 nm to 262 nm) is seen due to the particle size difference. Generally, a blue shift is attributed to the broadening of the energy gap as a result of decreasing particle size observed in semiconductors [39]. This blue shift is useful for humidity sensing applications. Since, the humidity of blue is 20 % RH, change in resistance of the material with humidity changes rapidly. Therefore, sensitivity at low humidity is useful in humidity sensing which corresponds to blue shift. The range of % RH was divided into three regions visually dry (below 40% RH), medium (40% - 70% RH) and very humid (above 70% RH). Initially the pellet surface was free of water molecules, having only dry air in its pores. When exposed to low humidity environment, adsorption of water vapour takes place rapidly on the surface of pellet. Due to high cationic charge density of metal oxide surface, the electrostatic force is high enough to break one of the O-H bonds of the H2O and form a strong chemical bond between M+ and OH−. Thus initial layer is chemisorbed [40].
3.5. Humidity Sensing Mechanism
The surface of materials was condensed due to water absorption and protons were conducted in form of aquatic layers. The mechanisms of the electrical response of semiconducting materials to humidity was explained taking consideration of the chemically and physically adsorbed layers of water molecules as well as capillary condensation of water inside tiny pores [41]. The porous microstructure and the surface reactivity with water are key parameters for the performance of semiconducting humidity materials [42]. Water is absorbed by porous materials when they were exposed to humidity leading to an increase of their electrical conductivity [43-45]. The larger is the surface area, larger is the content of adsorbed water, and consequently larger is the density of charge carriers usually protons. Sensor operation is based on either electronic or ionic conductivity. The fundamental mechanism that enables semiconducting sensors to humidity is the physisorption of water molecules on initially chemisorbed layer of hydroxyl ions [46,47]. The conduction is due to Grotthuss chain reaction mechanism, through which proton tunnel from one water molecule to next via hydrogen bonding that exists universally. Physisorbed water dissociates into H3O+ and OH– because of high electrostatic fields at the interface between the surface and adsorbed layer. Transportation of charge occurs due to movement of a proton from H3O+ ion to an adjacent water molecule and so on. Now protonic conduction set up on the surface which causes the observed drop in resistance in humid atmosphere. Exponential dependence of resistance with relative humidity can be quantified by this mechanism.
The semiconducting humidity sensors usually work on the principle of amount of water adsorbed on the pellet surface. Adsorption generates the variation in electrical resistance with humidity. As relative humidity increases resistance decreases. Curve (a) and (b) in Figures 5-9 show humidity sensing characteristics of pellet annealed at 600˚C for ZS-1, ZS-2, ZS-3 and ZS-4 respectively. Curve (a) of Figure 5 shows that resistance decreases sharply in the lower humidity range, i.e. from 10% - 35% RH and then further at high humidity there is a continuous decrease in resistance. Curve (b) of Figure 5 shows that resistance decreases sharply up to 25% RH and there is linear decrease for high range of humidity up to 65% RH, which is further continuously decreases. Curve
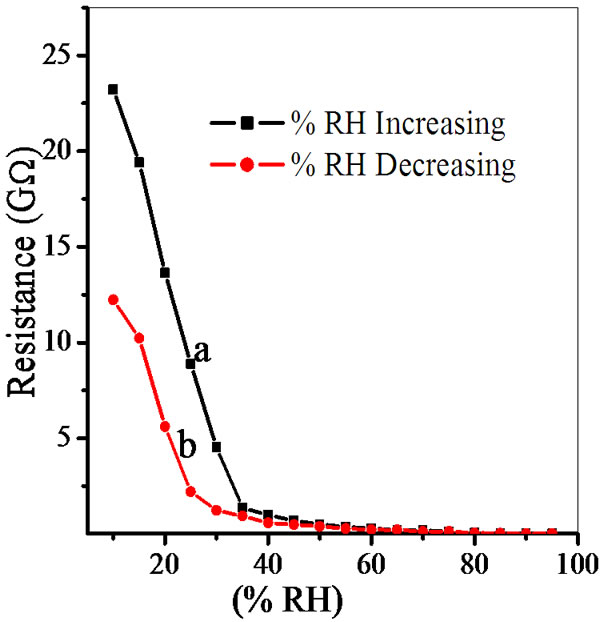
Figure 5. Hysteresis of ZnSnO3 at 600˚C for pellet ZS-1.
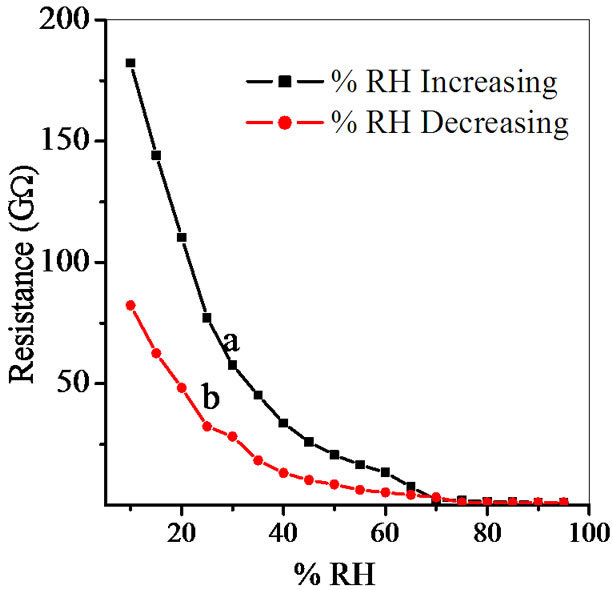
Figure 6. Hysteresis of ZnSnO3 at 600˚C for pellet ZS-2.
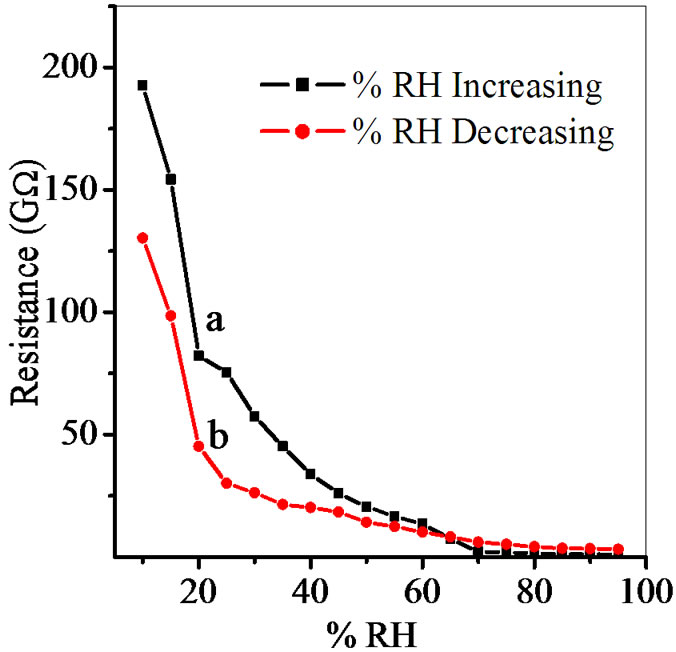
Figure 7. Hysteresis of ZnSnO3 at 600˚C for pellet ZS-3.
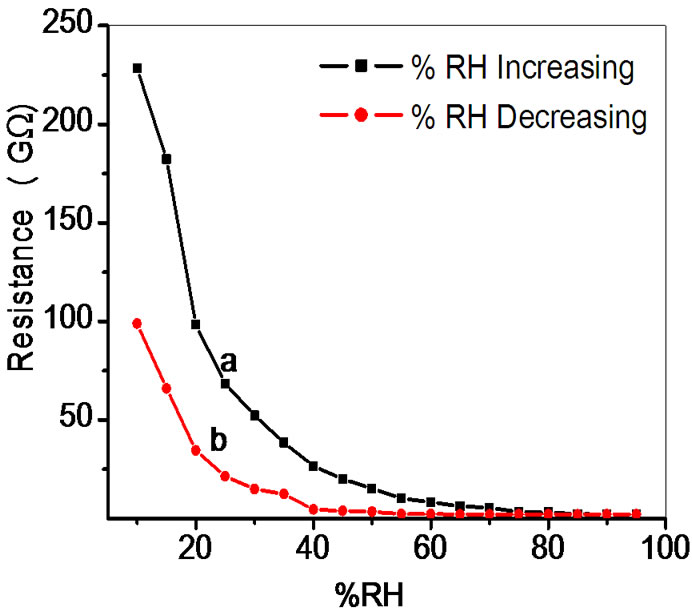
Figure 8. Hysteresis of ZnSnO3 at 600˚C for pellet ZS-4.
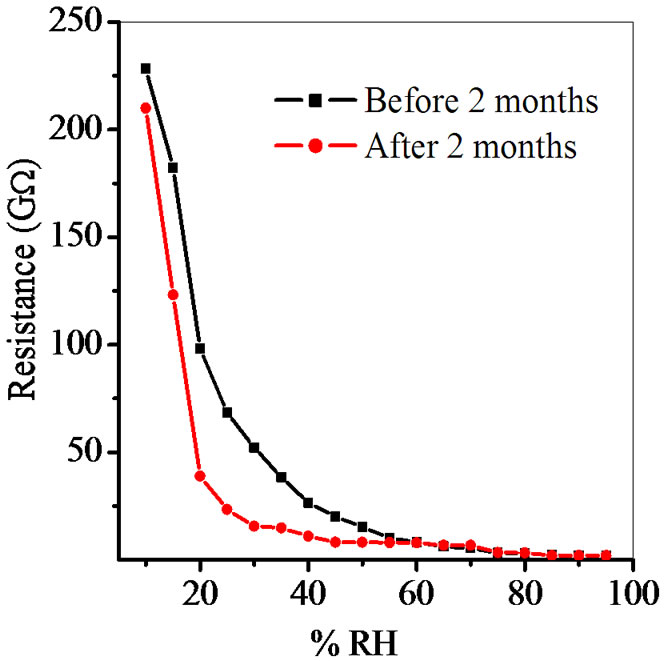
Figure 9. Reproducibility of ZnSnO3 at 600˚C for pellet ZS-4.
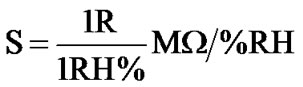
(a) of Figure 6 shows sharp decrease up to 20% RH, following by linear decrease to 65% RH and then continuous decrease for high humidity. Sensitivity of a humidity sensor can be defined as the change in resistance (R) of sensing element per unit change in relative humidity (% RH).
Average sensitivity is calculated by taking the average of all sensitivities ranging from 10 to 90% RH. Average sensitivity of the pellets, annealed at 600˚C, were found 0.2899 GΩ/%RH, 2.1294 GΩ/%RH, 2.2969 GΩ/%RH and 2.828 ~ 3 GΩ/%RH respectively. It has been observed that as the weight ratio of ZnO increases in SnO2 sensitivity of the sensing material increases and it is maximum for 1:4 weight ratios i.e. for pellet ZS-4. The change in resistance depends on how the porosity of material changes on incorporation of ZnO in SnO2. As more active surface sites are available there was more change in resistance resulting in more sensitivity which is good for sensor fabrication. Material conductivity varies with amount of water vapour adsorbed by it. The relative sensitivity of the ZnSnO3 nanoparticles based humidity sensor was determined by electrical measurements. In this process more of the surface area is exposed leading to more adsorption of water molecules. This increases the sensitivity of sensing elements. Figures 5-8 show 30%, 41%, 58% and 50% hysteresis of sensing element annealed at 600˚C for ZS-1, ZS-2, ZS-3 and ZS-4 pellets respecttively. After studying humidity sensing properties sensing elements have been kept in laboratory and their humidity characteristics were regularly monitored. To see the reproducibility, the sensing property of the sensing element was again examined in the humidity control chamber after two months. Figure 9 shows the reproducibility of sensing element annealed at 600˚C for ZS-4. The sensor was reproducible ±77% after two months. Average sensitivity of ZnSnO3 for different weight ratio annealed at 600˚C was shown in the Figure 10.
3.6. Optical Humidity Sensing
The modulation in the reflected intensity with respect to % RH can be explained on the basis of adsorption mechanism. As humidity inside the chamber increases continuously from 5% - 95% RH, water vapour replaces the dry air which was already present in the pores of the film. The increase in humidity increases the adsorption of water vapours on the surface and their condensation in the pores of the film causing an increase in the refractive index and thickness of the film. The results obtained by experimental investigation which shown in Figure 11. It shows the variation in reflected intensity with % RH for angle of incidence (θi) 54˚. This shows slow variation in intensity within the range of 10% - 40% RH and then sensor showed quick response to moisture, and the average sensitivity is 4.4 µW/%RH. In the normal region (40% - 70% RH) as the humidity increase, the water vapour starts adsorbing in the pore of sensing material which is slow process, due to which physical adsorption in this region was taken place. Average sensitivity is 3.3 µW/%RH. However, in higher humidity region (70% - 95% RH) the capillary condensation of water vapour was taken place through the pore due to which the sensitivity further increased and it become 2.9 µW/%RH. Over the entire range of %RH, the average sensitivity is 3.6 µW/%RH. The average sensitivity of the sensor can be calculated using the formula:

Using the above formula average sensitivity of the sensor for θi = 54˚ are 4.4, 3.3 and 2.9 respectively. Figure 12 shows the sensing behaviour for same angle of incidence θi of the same sensor after one month duration. The reproducibility of the sensor was tested after one month and found reproducible with 92% reproducibility for θi = 54˚.
4. Conclusions
Nanostructured ZnSnO3 was successfully prepared via chemical precipitation method. Minimum crystallite size was found 4 nm. Surface morphology of ZS-4 shows that most particles are spherical in shape leaving more space as pores and hence it was most sensitive among all. Maximum average sensitivity for ZS-4 was 3 GΩ/%RH which is better in comparison to tin oxide for which maximum sensitivity was 2 MΩ/%RH after annealing both the pellets at 600˚C. Pellet annealed at 600˚C for ZS-4 have reproducibility ±77% after two months. This nanocom-
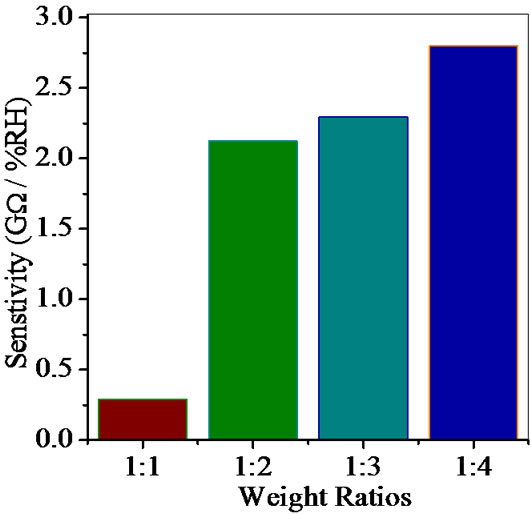
Figure 10. Average sensitivity of ZnSnO3 for different weight ratio annealed at 600˚C.
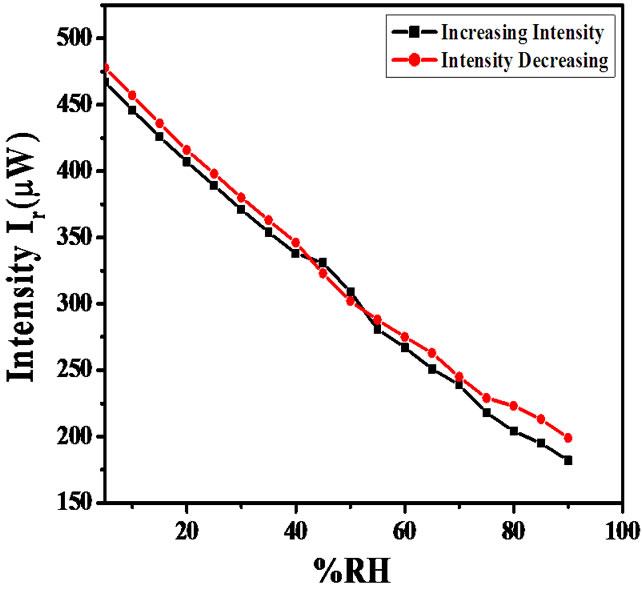
Figure 11. Variation in intensity of light with %RH for ZnSnO3 thin film at 54˚ angle of incident.
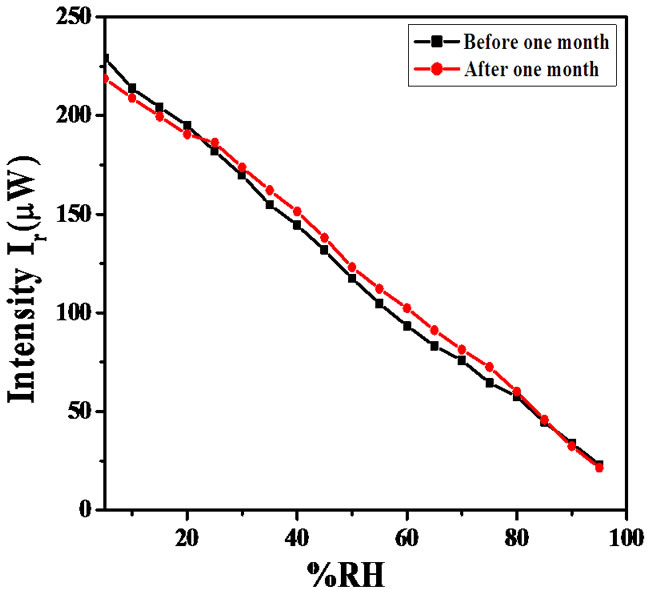
Figure 12. Variations in the intensity of light with % RH for ZnSnO3 thin film after 1 month.
posites carries a good scope for the development of moisture sensor in the range of relative humidity 10% to 90% RH.
5. References
[1] C. Y. Lee, S. Y. Li, P. Lin and T. Y. Tseng, “ZnO Nanowires Hydrothermally Grown on PET Polymer Substrates and Their Characteristics,” Journal of Nanoscience and Nanotechnology, Vol. 5, No. 7, 2005, pp. 1088-1094.
[2] Y. J. Chen, Q. H. Li, X. Y. Lang, T. H. Wang, Q. Zhao and D. P. Yu, “Field-Emission from Long SnO2 Nanobelt Arrays,” Applied Physics Letters, Vol. 85, No. 23, 2004, pp. 5682-5684. doi:10.1063/1.1833557
[3] S. Hofmann, C. Ducati, B. Kleinsorge and J. Robertson, “Low-Temperature Growth of Carbon Nanotubes by Plasma-Enhanced Chemical Vapor Deposition,” Applied Physics Letters, Vol. 83, No. 1, 2003, pp. 135-137. doi:10.1063/1.1589187
[4] O. J. Lee and K. H. Lee, “Fabrication of Flexible Field Emitter Arrays of Carbon Nanotubes Using Self-Assembly Monolayers,” Applied Physics Letters, Vol. 82, No. 21, 2003, pp. 3770-3772. doi:10.1063/1.1578520
[5] N. C. Xu, J. Tamaki, N. Miura and N. Yamazoe, “Grain Size Effects on Gas Sensitivity of Porous SnO2 Based Elements,” Sensors and Actuators B, Vol. 3, No. 2, 1991, pp. 147-155. doi:10.1016/0925-4005(91)80207-Z
[6] G. Zhang and M. Liu, “Effect of Particle Size and Dopant on Properties of SnO2 Based Gas Sensors,” Sensors and Actuators B, Vol. 69, No. 1-2, 2000, pp. 144-152. doi:10.1016/S0925-4005(00)00528-1
[7] N. Yamazoe and Y. Shimizu, “Humidity Sensors: Principles and Applications,” Sensors and Actuators, Vol.10, No. 3-4, 1986, pp. 379-398. doi:10.1016/0250-6874(86)80055-5
[8] H. Arai and T. Seiyama, “Sensors: A Comprehensive Survey,” VCH, Weinheim, Vol. 3, 1992, pp. 981-1012.
[9] G. J. C. Verdijck, H. A. Preisig and G. Van Straten, “Direct Product Quality Control for Energy Efficient Climate Controlled Transport of Agro-Material,” Journal of Process Control, Vol. 15, No. 2, 2005, pp. 235-246.
[10] C. Chen, “Humidity in Plant Tissue Culture Vessels,” Biosystems Engineering, Vol. 88, No. 2, 2004, pp. 231- 241. doi:10.1016/j.biosystemseng.2004.02.007
[11] M. Pelino, C. Cantalini and M. Faccio, “Principles and Applications of Ceramic Humidity Sensors,” Active and Passive Electronic Components, Vol.16, No. 2, 1994, pp. 69-87.
[12] Z. M. Rittersma, “Recent Achievements in Miniaturized Humidity Sensor—A Review of Transduction Techniques,” Sensors and Actuators A, Vol. 96, No. 2-3, 2002, pp. 196-210. doi:10.1016/S0924-4247(01)00788-9
[13] G. Gusmano, G. Montesperelli, B. Morten, M. Prudenziati, A. Pumo and E. Traversa, “Thick Films of MgFe2O4 for Humidity Sensors,” Journal of Materials Processing Technology, Vol. 56, No. 1-4, 1996, pp. 589-599. doi:10.1016/0924-0136(96)85112-0
[14] K. I. Arshak and K. Twomey, “Investigation into a Novel Humidity Sensor Operating at Room Temperature,” Microelectronics Journal, Vol. 33, No. 2, 2002, pp. 213-220. doi:10.1016/S0026-2692(01)00150-1
[15] Y. Le, M. J. Yang and Y. She, “Humidity Sensors Using in Situ Synthesized Sodium Polysterene Sulfonate/ZnO,” Talanta, Vol. 62, No. 4, 2004, pp. 707-712. doi:10.1016/j.talanta.2003.09.011
[16] R. V. Dabhade, D. S. Bodas and S. A. Gangal, “Plasmatreated Polymer as Humidity Sensing Materials: A Feasibility Study,” Sensors and Actuators B, Vol. 98, No. 1, 2004, pp. 37-40. doi:10.1016/j.snb.2003.08.020
[17] B. M. Kulwicki, “Humidity Sensors,” Journal of American Ceramic Society, Vol. 74, No. 4, 1991, pp. 697-708. doi:10.1111/j.1151-2916.1991.tb06911.x
[18] I. Bearzotti, L. Fratoddi, S. Palummo, A. Petrocco, C. Fulrani, Lo. Sterzo and M. V. Russo, “Highly Ethynylated Polymers: Synthesis and Application for Humidity Sensors,” Sensors and Actuators B, Vol. 76, No. 1-3, 2001, pp. 316-321. doi:10.1016/S0925-4005(01)00607-4
[19] Y. Sakai, Y. Sadaoka and M. Matsuguchi, “Humidity Sensors Based on Polymer Thin Films,” Sensors and Actuators B, Vol. 35, No. 1-3, 1996, pp. 85-90. doi:10.1016/S0925-4005(96)02019-9
[20] C. A. Grimes and D. Kouzoudis, “Remote Query Measurement of Pressure, Fluid Flow Velocity and Humidity Using Magneto Elastic Thick Film Sensors,” Sensors and Actuators A, Vol. 84, No. 3, 2000, pp. 205-212. doi:10.1016/S0924-4247(00)00306-X
[21] K. G. Ong, C. A. Grimes, C. L. Robbins and R. S. Singh, “Design and Application of a Wireless, Passive, Resonant-Circuit Environmental Monitoring Sensor,” Sensors and Actuators A, Vol. 93, No. 1, 2001, pp. 33-43. doi:10.1016/S0924-4247(01)00624-0
[22] T. Seiyama, N. Yamazoe and H. Arai, “Ceramic Humidity Sensors,” Sensors and Actuators, Vol. 4, No. 1983, pp. 85-96.
[23] L. Ketron, “Ceramic Sensor,” Ceramic Bulletin, Vol. 68, 1989, pp. 860-865.
[24] E. Traversa, G. Gusmano and A. Monteneero, “Innovative Humidity Sensitive Electrical Properties of Sol-Gel Processed Ceramic Thin Films,” European Journal of Solid State & Inorganic Chemistry, Vol. 32, 1995, pp. 719-729.
[25] G. Sberveglieri, R. Murri and N. Pinto, “Characterization of Porous Al2O3-SiO2/Si Sensor for Low and Medium Ranges,” Sensors and Actuators B, Vol. 23, No. 2-3, 1995, pp. 177-180. doi:10.1016/0925-4005(94)01270-R
[26] K. S. Chou, T. K. Lee and F. J. Liu., “Sensing Mechanism of a Porous Ceramic as a Humidity Sensor,” Sensors and Actuators B, Vol. 56, No. 1-2, 1999, pp. 106- 111. doi:10.1016/S0925-4005(99)00187-2
[27] E. Traversa, G. Gnappi, A. Montenero and G. Gusmano, “Ceramic Thin Films by Sol-Gel Processing as Novel Materials for Integrated Humidity Sensors,” Sensors and Actuators B, Vol. 31, No. 1-2, 1996, pp. 59-70. doi:10.1016/0925-4005(96)80017-7
[28] C. Wang, X. Wang, J. Zhao, B. Mai, G. Sheng, P. Peng and J. Fu, “Synthesis, Characterization and Phtocatalytic Property Of Nano-Sized Zn2SnO4,” Journal of Materials Science, Vol. 37, No. 14, 2002, pp. 2989-2996. doi:10.1023/A:1016077216172
[29] D. L. Young, D. L. Williamson and T. J. Coutts, “Structural Characterization of Zinc Stannate Thin Films,” Journal of Applied Physics, Vol. 91, No. 3, 2002, p. 1464. doi:10.1063/1.1429793
[30] I. Stambolova, K. Konstantinov, D. Kovacheva, P. Peshev and T. Donchev, “Spray Pyrolysis Preparation and Humidity Sensing Characterstics of Spinel Zinc Stannate Thin Films,” Journal of Solid State Chemistry, Vol. 128, No. 2, 1997, pp. 305-309. doi:10.1006/jssc.1996.7174
[31] C. G. Granqvist, A. Azens, A. Hjelm, L. Kullman, G. A. Niklasson, D. Ronnow, M. S. Mattssonb, M. Veszelei and G. Vaivars, “Recent Advances in Electrochromics for Smart Windows Applications,” Solar Energy, Vol. 63, No. 4, 1998, pp. 199-216. doi:10.1016/S0038-092X(98)00074-7
[32] W. J. Moon, J. H. Yu and G. M. Choi, “Selective CO Gas Detection of SnO2-Zn2SnO4 Composite Gas Sensor,” Sensors and Actuators B, Vol. 80, No. 1, 2001, pp. 21-27. doi:10.1016/S0925-4005(01)00884-X
[33] Y. S. Shen and T. S. Zhang, “Preparation, Structure and Gas-Sensing Properties of Ultramicro ZnSnO3 Powder,” Sensors and Actuators B, Vol. 12, No.1, 1993, pp. 5-9. doi:10.1016/0925-4005(93)85003-S
[34] M. S. Wagh, L. A. Patil, T. Seth and D. P. Amalnerkar, “Surface Cupricated SnO2-ZnO Thick Film as a H2S Gas Sensor,” Materials Chemistry and Physics, Vol. 84, No. 2-3, 2004, pp. 228-233. doi:10.1016/S0254-0584(03)00232-3
[35] P. Ehrhart and R. Waser, “New Thin Film Technologies,” In: S. Somiya, F. Aldinger, N. Claussen, R. M. Spriggs, K. Uchino, K. Koumoto and M. Kaneno, Eds., Handbook of Advanced Ceramics: Materials Science, Academic Press (Elsevier), New Delhi, 2006, pp. 515-533.
[36] R. W. Schwartz, “Chemical Solution Deposition of Perovskite Thin Films,” Chemistry of Materical, Vol. 9, No. 11, 1997, pp. 2325-2340. doi:10.1021/cm970286f
[37] D. Meyerhofer, “Characteristics of Resist Films Produced by Spinning,” Journal of Applied Physics, Vol. 49, No. 7, 1978, pp. 3993-3997. doi:10.1063/1.325357
[38] G. Carcano, M. Ceriani and F. Soglio, “Spin Coating with High Viscosity Photo Resist on Square Substrates- Application in the Thin Hybrid Microwave Integrated Circuit Field,” Microelectronics International, Vol. 10, No. 3, 1993, pp. 12-20. doi:10.1108/eb044507
[39] H. M. Kim, D. S. Kim, D. Y. Kim, T. W. Kang, Y. H. Cho and K. S. Chung, “Growth and Characterization of Single-Crystal GaN Nanorods by Hydride Vapor Phase Epitaxy,” Applied Physics Letters, Vol. 81, No. 12, 2002, pp. 2193-2195. doi:10.1063/1.1507617
[40] K. P. Biju and M. K. Jain, “Sol-Gel Derived TiO2:ZrO2 Multilayer Thin Films for Humidity Sensing Application,” Sensors and Actuators B, Vol.128, No. 2, 2008, pp. 407-413. doi:10.1016/j.snb.2007.06.029
[41] A. Chowdhri, P. Sharma, V. Gupta, K. Sreenivas and K. V. Rao, “H2S Gas Sensing Mechanism of SnO2 Films with Ultrathin CuO Dotted Islands,” Journal of Applied Physics, Vol. 92, No. 4, 2002, pp. 2172. doi:10.1063/1.1490154
[42] I. C. Cosentino, E. N. S. Muccillo and R. Muccillo, “The Influence of Fe2O3 in the Humidity Sensor Performance of ZrO2:TiO2-Based Porous Ceramics,” Materials Chemistry and Physics, Vol. 103, No. 2-3, 2007, pp. 407-414. doi:10.1016/j.matchemphys.2007.02.051
[43] G. Fu, H. Chen, Z. Chen, J. Zhang and H. Kohler, “Humidity Sensitive Characteristics of Zn2SnO4-LiZnVO4 Thick Films Prepared by the Sol-Gel Method,” Sensors and Actuators B, Vol. 81, No. 2-3, 2002, pp. 308-312. doi:10.1016/S0925-4005(01)00971-6
[44] J. H. Anderson and G. A. Parks, “The Electrical Conductivity of Silica Gel in the Presence of Adsorbed Water,” Journal of Physics and Chemistry, Vol. 72, No. 10, 1968, pp. 3362-3368. doi:10.1021/j100856a051
[45] E. McCafferty and A. C. Zettlemoyer, “Adsorption of Water Vapor on α-Fe2O3,” Discussions of Faraday Society, Vol. 52, No. 10, 1971, pp. 239-254. doi:10.1039/df9715200239
[46] E. Traversa, “Ceramic Sensors for Humidity Detection: The State-of-Art and Future Developments,” Sensors and Actuators B, Vol. 23, No. 2-3, 1995, pp. 135-156. doi:10.1016/0925-4005(94)01268-M
[47] W. J. Fleming, “A Physical Understanding of Solid State Humidity Sensors,” Society of Automotive Engineers Transactions, Vol. 90, No. 2, 1981, pp. 1656-1667.