Agricultural Sciences
Vol.08 No.04(2017), Article ID:75857,14 pages
10.4236/as.2017.84022
Development of GPS-Based Multi-Channel Controllers for Research Plot Pesticide Applicators
Ahmad Khalilian1*, Young J. Han1, Joe M. Maja2, James Thomas2, Michael W. Marshall2, Ali Mirzakhani-Nafchi1, Jose O. Payero2, Daniel J. Anco3
1Department of Agricultural Sciences, Clemson University, Clemson, USA
2Edisto Research and Education Center, Clemson University, Blackville, USA
3Department of Plant and Environmental Sciences, Clemson University, Clemson, USA

Copyright © 2017 by authors and Scientific Research Publishing Inc.
This work is licensed under the Creative Commons Attribution International License (CC BY 4.0).
http://creativecommons.org/licenses/by/4.0/


Received: March 28, 2017; Accepted: April 27, 2017; Published: April 30, 2017
ABSTRACT
Pesticide efficacy tests are typically conducted in experimental plots which involve applying multiple chemical treatments at different application rates and timings. Utilizing a single boom pesticide applicator requires navigating to individual plots, applying a pesticide assigned to those plots and when all replications are completed, cleaning the equipment and reloading the next pesticide treatment into the tank. It usually takes several hours to accomplish this task, especially when the left hand side of a plot requires a different pesticide treatment than the right hand side. In order to facilitate application of pesticide treatments in experimental plots, two map-based controller systems were developed to drive multi-channel pesticide applicators. The Clemson “Multi-Channel Chemical Controllers” consist of solid-state relays controlled by custom software, solenoid valves, and GPS receivers. The first system can control up to 24 individual booms which could independently apply up to 24 different chemical treatments in each field plot area. The second system is the Clemson “Intelligent Farm Controller” (iFc), which could be connected to a variety of devices, such as spray and motor actuators. For this study, the controller was designed to handle four output pins to control four relays; however, it could easily be expanded to control more relays, if needed. On average, these systems reduced application times in test fields from six hours to 20 minutes, compared to single-boom applicators (p = 0.001), thereby reducing the time interval between treatment applications and significantly reducing the potential effect of adverse weather.
Keywords:
Controllers, Spray Booms, Precision Agriculture, GPS, Pesticides

1. Introduction
Agricultural pests cost US farmers approximately $120 billion annually in yield losses and control costs, endangering the nation’s food security and threatening the agricultural economy and the environment [1] [2] [3] [4] . The efficiency of controlling these pests can therefore, significantly affect the success and sustainability of crop production in many areas of the United States. Growers mainly rely on the recommendations generated by researchers for making pest management decisions regarding pesticide types and application rates. To develop these recommendations, researchers often conduct pesticide efficacy tests in small experimental plots which involve applying multiple chemicals at different application rates and/or timings. In most cases, these pesticide treatments should be applied within a given time window for effective comparisons. Utilizing a single boom pesticide applicator requires navigating to individual plots for applying a pesticide assigned to those plots and when all replications are applied, cleaning the applicator and reloading another treatment into the system. It requires a considerable amount of time to accomplish this task, especially when the left hand side of a plot requires a different pesticide treatment than the right hand side or when different combinations of granular and liquid pesticides are required. Tank mixing of chemicals reduces overall application time; however, in most cases this is not feasible due to different application rates for each che- mical.
To solve this problem, researchers conducting experiments involving plot spraying, use sprayers equipped with multiple booms [5] [6] [7] [8] , with each boom attached to an individual stainless steel tank, pressurized by compressed air (Figure 1). Different combinations of pesticides (single or multiple chemicals) are placed in these pressurized tanks based on pesticide treatments. The tanks are mounted on the sprayer with steel support brackets and springs to hold the tanks in position during field applications. This arrangement facilitates removal of the tank for cleaning, rinsing, and refilling. Quick-coupling air and spray line fittings allow rapid disassembly and removal of the tanks. Each spray boom is equipped with on/off ball valves [9] or an electric solenoid valve [10] for turning the boom on and off for applying a pesticide treatment to an experimental plot. Depending on the needs of the research program, a multi-boom sprayer could have between 10 and 30 solenoid valves. Currently these valves are controlled manually from the tractor cab utilizing a set of electric on-off manual switches (Figure 1). One major drawback of this arrangement is that it requires two people, one for driving the tractor and one for controlling the manual switches based on plot plans. In addition, when several chemical treatments are needed in a given plot, there is a chance that the operator might activate an incorrect combination of switches and apply the wrong treatment. Loussaert [11] described a portable computer-based controller, in which the user marks the start of the first plot and the computer turns on and off the remaining plot in the direction of travel. After changing the direction of travel for spraying the next row of plots, the procedure for starting the controller had to be repeated. With

Figure 1. A multi-boom sprayer and the manual switches for controlling booms 1 to 11.
this system, the plot length, alley length, and tractor speed had to be entered during the setup stage. This system was not based on a georeferenced application map, and any changes in the tractor speed, would result in chemicals being applied at the wrong rate in the plots. Therefore, the objective of this project was to develop two map-based controller systems for multi-chemical pesticide applicators which would improve the efficiency and spatial accuracy of pesticide applications to experimental plots while reducing application time and labor.
2. Methodology
2.1. Design Specifications
Two map-based multi-channel plot pesticide application systems were developed for applying herbicides, inoculants, insecticides, and fungicides in cotton, corn, soybean, and peanut research plots. The first system (System-1) was designed according to the following specifications: 1) the system should be able to spray up to 24 different pesticide treatments through 24 different spray booms; 2) The right hand and left hand booms should be independently controlled; 3) The system should utilize software-generated plot maps and a GPS to switch from one pesticide treatment to another when booms are over an alley between the experimental plots; 4) Individual booms should be equipped with pressure sensors to indicate when the correct line pressure is achieved on every boom by turning green lights on inside the tractor’s cab; 5). The sprayer system should have enough pressurized air capacity or volume to support simultaneous treatment applications using multiple tanks and booms; and 6) The operator should be able to clean all of the booms in the field in a few minutes if application of additional treatments are needed.
The second system (System-2) was designed to apply a combination of fluid and granular fungicides or inoculants in peanut research plots. The design specifications required controlling the application of two liquid and two granular fungicides, either individually or in combination. Also, similar to the System 1, the right hand and left hand side of the applicator should be individually controlled with the system following predetermined software generated plot plans.
2.2. System Description
System-1: Figure 2 shows the Clemson multi-boom sprayer used for pesticide efficacy research. The system consisted of 24 spray booms (12 right-hand and 12 left-hand booms) which could spray up to 24 different treatments at a time. Depending on the direction of travel, it could spray out of 12 right- or left-boom or both booms as it travels through the experimental plot area. Each boom was attached to a stainless steel chemical tank (11.4 L), pressurized by compressed air, using quick-coupling fittings (for both chemicals and air). A 12VDC air compressor (Model Phoenix AC3P) was used to generate 96 L/min air for pressurizing the chemical tanks. In addition to 11.4 L tank on the compressor, a 19 L air reservoir was installed to increase the air supply buffering capacity in the system. A 19 L pressurized CO2 tank was also used as a backup if the air compressor system failed and backup air pressure was needed.
Twenty-four normally open 12VDC solenoid valves (Model 72Z0320, Peter Paul Electric, New Britain, CT) were used to turn spray booms on or off. When a solenoid receives a 12VDC signal from the controller, the valve opens, allowing the pesticide solution to flow into the designated spray boom. The electrical signals sent to the solenoids were controlled by a solid-state relay board (SSR- RACK24, Measurement Computing, Middleboro, MA) with DC-switch solid-state relays (SSR-ODC-05, Measurement Computing). The relay board was mounted inside a 60 × 25 × 25 cm, weatherproof enclosure mounted inside the tractor cab (Figure 3). Quick connectors were used to allow the controller box to

Figure 2. The Clemson Intelligent multi-boom plot sprayer.

Figure 3. Controls components for the Clemson multi-boom plot sprayer (System-1).
be moved from one tractor to another. An onboard computer with custom software, signals the relay board via a USB-based analog and digital I/O module (Minilab 1008, Measurement Computing). The Minilab is supported under Microsoft Windows operating system and features eight 12-bit analog input signal connections and 28 digital I/O connections. In addition to the automatic electronic control system, 24 manual electric switches were added as a backup.
Electric pressure sensors, model A6-651221 (Dwyer Instruments, Michigan City, Indiana) were installed in the chemical supply line of each boom, to monitor the line pressure. When a boom was switched on and the correct pressure was detected, a green light associated with that boom was turned on inside the tractor’s cab. The light indicated red if either boom was not spraying or the pressure was too low.
Another important feature of the Clemson multi-boom plot sprayer is the ability to clean all the booms in the field in a few minutes if additional treatments were needed. This cleaning process involved carrying ammonia solution in the front tank of the tractor and spraying this through the booms, followed by application of compressed air to purge the lines of any residual ammonia solutions.
A GPS receiver with differential correction was used to determine the position of the sprayer in the field. When the tractor was equipped with a cm accuracy RTK-GPS auto steering system, the tractor drove itself on every pass and turned the proper solenoid on and off in each plot.
System-2: The second system was comprised of the Clemson “Intelligent Farm Controller” (iFc), developed by the Clemson Sensor and Automation Laboratory at the Edisto Research and Education Center. The iFc could be connected to a variety of devices (such as spray and motor actuators) through connector shields. The iFc included an Atmel microcontroller (Atmega 644P, Atmel, San Jose, CA) with USB connectivity (Figure 4). The board was designed to handle four output pins to control four relays, five input pins to accept switches for manual control, and a joystick interface for configuration purposes. However,

Figure 4. Clemson “Intelligent Farm Controller” (iFc) used for System-2.
it could easily be expanded to control more relays (for example 24), if needed.
System-2 was installed on a four-row SRES Flex Plot Planter (Seed Research Equipment Solutions, South Hutchinson, KS). The system controlled two 12VDC electric motors on granular hoppers (Gandy Company, Owatonna, MN). It also controlled four electric solenoid shutoff valves (e-Chemsaver, TeeJet Technologies, Glendale Heights, IL) which were used to control injection of fungicides in the seed furrow (Figure 5). This system could control applications of two liquid and two granular fungicides, either individually or collectively. Also, the right-hand and left-hand applicators could be controlled independently.
2.3. Control Software
The first step in using the automated boom control software was to develop a plot plan or pesticide prescription map in shape file format. This is done using GIS software, such as Farm Works or SSToolbox. The shape file must have four numeric fields (plot number, replication, and the left and right-booms numbers). The boom numbers are the values assigned to each spray boom (in this case between 1 and 24). Figure 6 shows an example of plot plan (in a shape-file format) developed using Farm Works GIS software. In this example, plots are divided into left-hand and right-hand sections. For example, a plot with values 7 and 14, will receive pesticide treatment #7 in the left-hand side of the plot and pesticide treatment #14 in the right-hand side of the plot. The pesticide prescription maps can be generated in advance when planning an experiment. Up to 24 pesticides can be assigned to each plot. However, pressurized air supply may not be enough to operate 24 booms simultaneously for an extended period of time. Additional air reservoirs may be needed to accomplish this task.
Custom software was developed to support the Clemson multi-boom plot sprayer systems. The “Clemson Auto-Boom Sprayer” (CABS) software uses the pesticide prescription application map developed using GIS software and deter-

Figure 5. The Gandy granular hoppers (left), and the TeeJet 55280 e-Chemsaver, electric solenoid shutoff valves (right).

Figure 6. An example of plot plan (shape-file format) developed using Farm Works GIS software.
mines which spray boom needs to be activated while traversing the experimental plot area. The CABS program can control up to 24 individual booms. Figure 7 shows an example screenshot of the CABS software.
The CABS program starts with the last shape file used. If the last file could not be found, or the operator wants to load a different shape file, a new shape file could be selected using “Open Shape File” under the “File” menu. The program will also remember the last successful GPS port number. If the GPS is connected to a different port, the operator can change the GPS port. In addition, the program will try the next available COM port automatically.
The software allows entering the “System Offset Distance” (distance between the GPS antenna and the spray boom). The program will retain this distance in memory once it is entered. The exact location of the spray boom is calculated from the system offset distance using the current GPS speed and heading

Figure 7. An example of the auto-boom sprayer software screenshot.
data. The following assumptions were used in calculating the system offset distance: One latitudinal degree measures 110,946.3 m; one latitudinal minute measures 1849.1 m; and one latitudinal second measures 30.818 m (assuming Earth’s average meridional radius R = 6,367,449 m). The width of one longitudinal degree on latitude (Lat) was calculated using the following equation: (π/180)*cos (Lat)*R.
GPS coordinates of the sprayer’s current location are displayed regardless of whether the shape file is open, if the program receives the GPS signal. Other information (such as plot number, replication, right-boom, and left-boom numbers) is obtained from the selected shape file. The “L, R” box on the display shows the left-boom and right-boom treatment numbers.
Chemical numbers shown in the (L, R) box does not mean that the indicated chemical spray boom is ON. The spray turns on only when the “START” button is pushed. The chemicals being sprayed will be shown as yellow buttons in each of the “Left Boom” and “Right Boom” boxes (Figure 7). Blue buttons mean chemical booms with those numbers are OFF. Pressing the red “STOP” button during spraying will turn off every spray boom.
Another useful feature of the Clemson Auto-Boom sprayer is its Demo/ Simulation capability. A CABS-Demo program has the same user interface as the CABS program, without controlling the hardware. This feature can be used to easily demonstrate the operation of the CABS program to interested researchers, technicians, and graduate students without being tied to the sprayer system. The CABS-Demo program is used with an accompanying software called “Read Shape File V2” that simulates GPS coordinates in a given shape file with a click of the mouse. This program reads all shape file information and sends out simulated GPS location signals with spray chemical information from the shape file. The yellow crosshair can be positioned anywhere on the map with a mouse click, like the one shown in Figure 7. It also simulates sprayer heading and speed information that can be changed. The “Record” shows the plot number (28), rep number (3) and the last two numbers show the left-side and right-side chemical number (7 & 4). The CABS and CABS-Demo programs keep detailed log files of all control function during its operation, a useful feature for system diagnostics/repair.
The firmware for System-2 was written in the C language to handle special communication from the auto-boom software through the USB. The system can parse a channel number from the Auto-Boom Sprayer software and update the status of each channel. This minimizes the transmission and provides capable expansion for future setup. The current communication protocol between the Auto-boom sprayer software and the system is to change the status of the channel to either on or off. For instance, if the status is off for channel 1, and the system receives input from channel 1, then the controller will turn channel 1 on and retain the current status of the other channels. If the controller will receive input from channel 1 again from the Auto-Boom Sprayer software, it will turn channel 1 off (Figure 8).
Field test were conducted to compare the Clemson plot sprayer with three different sprayers (backpack, single-boom, and multi-boom with manual controller), in terms of time required to complete application to one pesticide treatment. These treatments were replicated four times, using a randomized

Figure 8. Communication protocol for System-2.
complete block experimental design. The statistical analyses (ANOVA and means separation) were conducted using the SAS software (Version: 9.4; SAS Institute Inc., Cary, NC, USA).
3. Results
The Clemson multi-boom pesticide applicators were tested in 2 field trials at the Clemson University Edisto Research & Education Center. The first sprayer (System-1) with the right and left boom control was used for herbicide and fungicide efficacy tests. The experimental plot for peanuts had 8 crop rows with the traffic lanes confined to two border rows of every plot, so yield rows were not affected by soil compaction due to equipment traffic (Figure 9). Therefore, on either side of the tractor, there was a 4-row plot (2 traffic and 2 yield rows). With a single boom sprayer, the driver would have had to navigate to individual plots for spraying a pesticide assigned to those plots and when all replications were sprayed, would have to flush the boom with clean water, and reload the next treatment into the tank. This would require two field trips across each plot, and over six hours to accomplish this task, since the left hand side of the plots needed different pesticide than the right hand side.
In a subsequent field trial, the objective was to determine the effects of time between fungicide application and rainfall events on the efficacy of the pesticide. The rainfall was simulated using an overhead irrigation system on two hour intervals. Therefore, the six hour difference between applications of different fungicides (using a single boom sprayer) was not acceptable according to the experimental protocol. Using a multi-boom sprayer with manual switches was helpful; however, there were few a cases in which the operator activated wrong booms, even when one person was driving and the other person operating the booms. The computer-based, multi-boom system automatically and precisely applied up to 12 treatments per continuous field pass from 24 left and right 4-row booms using a GIS map and RTK GPS guidance. When used with a tractor auto steering system, the hands-free operation eliminated potential errors associated with hand-held plot maps and manual switches, and enhanced the
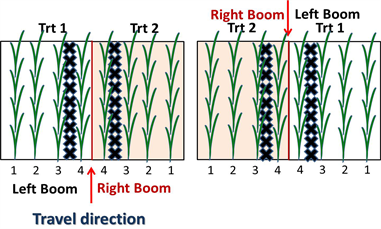
Figure 9. Tractor-mounted sprayer (split application).
operator’s ability to monitor the total application process. The system significantly reduced treatment application time (p = 0.001) in the field from six hours to about 20 minutes, making short interval treatment timing experiments feasible and significantly reducing the risk of thunderstorms affecting experiments. Figure 10 shows average time required to complete application of one treatment for different spray systems.
In addition, a modified version of System-1 was utilized to improve the efficiency of the Weed Science herbicide research program at Clemson University. The main difference between these two systems was in the number of booms (18 vs, 24) and the herbicide sprayer unit did not control right and left booms separately. The Weed Science program currently conducts research on all agronomic crops in South Carolina. Previously, treatments were applied using hand boom sprayers and temporary labor where they could only spray one treatment at a time in the field. With the large number of treatments per experiment, this process was very time consuming. For example, a 15-treatment test replicated six times applied with hand booms would take nearly 4 hours to spray, clean the tanks and hand booms, and load and mix the next batch of treatments. Since the crops in our plots are taken to yield, they are typically large plots (3.8 × 12 m). With the development of the tractor mounted multi-boom system, the herbicide screening program can now put out 4 to 5 large experiments per day. Using the CABS system on this sprayer has increased the productivity significantly. We could generate more research results to share with farmers through demonstration plots at field days and presentations at county meetings. The advent of this system has greatly increased the productivity of the Weed Science program.
System-2 was used in several Agronomic Crop Variety Evaluation trials (known as OVT) for corn, soybean, cotton, and peanut, to help growers to select the most profitable cultivars for individual farm conditions and management programs. The system allowed map-based application of different combinations

Figure 10. Average time for completing one treatment for different spray systems.
of liquid and granular chemicals (such as fungicides, inoculants, and insecticides) to the experimental plots, while controlling the right hand and left hand applicators individually. This helped reduce the number of trips over the experimental plots, increased application accuracy, and significantly reduced application time in the field (P = 0.001); thereby, making short interval treatment timing experiments feasible and significantly reducing the risk of thunderstorms affecting experiments.
The controller systems were designed to switch from one pesticide treatment to another when the booms were passing over an alley between the experimental plots. These alleys are typically 3-m wide and this is where the chemical applicator starts and stops in the middle of these alleys (1.5 m from beginning of each plot). However, tractor speed could have an effect on the exact locations where pesticide treatments are switched. Therefore, system accuracy tests were conducted under actual field conditions at six different tractor speeds (1.5 to 10 km/h), replicated three times. For these tests, the center of alleys were marked with a flag; a blue spray indicator (Turf Mark, BASF, Research Triangle Park, NC 27709) was added to the sprayer’s tanks; and the exact locations where the booms were turned on or off were identified using white indicator paper placed on the ground in the alleys. The distance between the flag and the point where the sprayer was turned on (as indicated by blue color on the white paper), was measured and designated as deviation or the error from the actual center of the alley between the experimental plots. The results showed these systems could accurately operate at a travel speed ranging from 1 to 10 km/h and switch from one pesticide treatment to another. For travel speed greater than 10 km/h, the System Offset Distance can be adjusted so that chemical treatments will be switched while the booms are still over the alley between the experimental plots.
Both application systems closely followed design specifications and switched from one pesticide treatment to another when applicators were over an alley between the experimental plots. In addition, both systems could also control right hand and left hand applicators individually. However, System-1 is only suitable for applying fluid pesticides, while System-2 can control applications of liquid and granular pesticides, either individually or collectively.
4. Summary
Two map-based controller systems were developed for multi-chemical applicators for applying herbicides, inoculants, insecticides, and fungicides treatments in cotton, corn, soybean, and peanut research plots. Both systems closely followed design specifications as described in the Methodology section. The System-1 was designed to control up to 24 individual booms which could apply 24 different chemicals in a given field location. System-2 was designed to control two liquid chemical injectors and two granular applicators, either individually or collectively. However, it could easily be expanded to control up to 24 relays, if needed. Both systems can also control right hand and left hand applicators individually. The systems followed GPS-based maps and applied pesticide according to plot plans using GPS signals to precisely switch from one pesticide treatment to another when applicators were over an alley between the experimental plots. Pressure sensors on spray booms (System-1) indicated correct line pressure on every boom by turning green lights on inside tractor’s cab. The System-1 had enough pressurized air capacity to support simultaneous treatment applications using multiple spray tanks. Both systems considerably reduced application time in the field (up to 18-times faster), compared to single-boom applicators, thereby making short-interval treatment timing experiments feasible and significantly reducing the effect of weather on the applied treatments. The advent of these systems has greatly increased the productivity of the weed science, variety evaluation, and other pesticide screening programs at Clemson University.
Acknowledgements
Technical Contribution No. 6551 of the Clemson University Experiment Station. This material is based upon work supported by NIFA/USDA, under Project number SC-1700498 and SC-1700512.
Disclaimer
Mention of a trade name does not imply endorsement of the product by Clemson University to the exclusion of others that might be available.
Cite this paper
Khalilian, A., Han, Y.J., Maja, J.M., Thomas, J., Marshall, M.W., Mirzakhani-Nafchi, A., Payero, J.O. and Anco, D.J. (2017) Development of GPS- Based Multi-Channel Controllers for Research Plot Pesticide Applicators. Agricultural Sciences, 8, 302-315. https://doi.org/10.4236/as.2017.84022
References
- 1. USDA (2014) USDA Provides Farm Bill Funding for Pest and Disease Management Programs. Washington DC. http://www.usda.gov/wps/portal/usda/usdahome?contentid=2014/04/0050.xml
- 2. Williams, M.R. (2014) Cotton Insect Losses. Proceedings of Beltwide Cotton Production Research Conferences—National Cotton Council of America, Memphis, 7 January 2014. http://www.cotton.org/beltwide/proceeding.
- 3. Oerke, E.C. (2006) Centenary Review, Crop Losses to Pest. Journal of Agricultural Science, 144, 31-43. https://doi.org/10.1017/S0021859605005708
- 4. Hamill, A.S., Holt, J.S. and Mallory-Smith, C.A. (2004) Contribution of Weed Science to Weed Control and Management. Weed Technology, 18, 1563-1565.
- 5. Curran, T.A. (1989) Multi-Boom Field Sprayer. US Patent No 4813604.
- 6. Heinz, S. and Priest, J.A. (1975) High-Clearance Sprayer for Small Plot Research. Agronomy Journal, 65, 1001-1002.
- 7. Oplinger, E.S. and Wright, J.P. (1980) A Multi-Boom Research Plot Sprayer Experimental Chemicals to Field Crops. Proceedings of the Plant Growth Regulator Working Group, Dallas, 13-17 July 1980, 141-145.
- 8. Whitehead, J.D. and Prochaska, M.H. (1992) Multi-Boom Plot Sprayer for Field Research: Designed with Safety and Efficiency in Mind. 1992 Proceedings Beltwide Cotton Conferences—National cotton Council of America, 860-886.
- 9. Stachowski, P.J. and Hahn, R.R. (1999) Spider Spray Trac Multi-Boom Small Plot Sprayer. Proceedings of Northeastern Weed Science Society, 53, 110. http://www.newss.org/proceedings/proceedings_1999_vol53.pdf
- 10. Bowman Manufacturing (2017) Small Plot and Research Customization. Newport. http://www.bowmanmanufacturing.com/products/mudmaster-multi-purpose-sprayer/small-plot-and-research-customization/
- 11. Loussaert, D. (1992) Computer Controlled Chemical Field Applicator for Research. Agronomy Journal, 65, 1001-1002. https://doi.org/10.2134/agronj1992.00021962008400040041x