Agricultural Sciences
Vol.5 No.4(2014), Article ID:43734,16 pages DOI:10.4236/as.2014.54030
Genotypic Variation for Tolerance to Low Soil Phosphorous in Common Bean under Controlled Screen House Conditions
Annet Namayanja1*, Johnson Semoka2, Robin Burucharawang#_s:sup3, Susan Nchimbi4, Moses Waswa1
1National Crops Resources Research Institute (NaCRRI)-Namulonge, Kampala, Uganda
2Department of Soil Science, Sokoine University of Agriculture, Morogoro, Tanzania
3International Center for Tropical Agriculture (CIAT), Coordinator for Africa, Nairobi, Kenya
4Department of Crop Science and Production, Sokoine University of Agriculture, Morogoro, Tanzania
Email: *annetnama@yahoo.com
Copyright © 2014 by authors and Scientific Research Publishing Inc.
This work is licensed under the Creative Commons Attribution International License (CC BY).
http://creativecommons.org/licenses/by/4.0/


Received 24 December 2013; revised 11 February 2014; accepted 4 March 2014
ABSTRACT
Production of common bean (Phaseolus vulgaris) is often limited by the low availability of soil phosphorus (P). Identification of common bean genotypes adapted to low phosphorus (P) availability may be a feasible strategy to overcome the poor plant growth and production in P-deficient soils. Genetic variation for P response of thirteen common bean genotypes was studied under screen house controlled conditions using triple super phosphate as P source. The common bean genotypes varied in leaf area, shoot mass, root mass, total root length, basal and lateral roots production, shoot P concentration and P uptake under phosphorous deficiency and high phosphorous. All the measured variables were significantly correlated with each other, which in turn were correlated to P uptake. Generally the large-seeded genotypes RWR 1946 and RWR 2075 appeared to have the best growth, hence superior P efficiency under low P availability, while at the same time they were more responsive to added P. These results complement the earlier field based observed tolerance to low soil phosphorous of the selected genotypes under the BILFA strategy.
Keywords: BILFA; Phaseolus vulgaris; Phosphorus; P-Uptake; Shoot Mass

1. Introduction
Low soil phosphorous is a widespread constraint to common bean production on tropical and sub-tropical soils in Latin America and Africa [1] , mostly in soils that have been over cultivated with pH below 5.5 or above 8.0 [2] . In Eastern and Southern Africa, it is the most frequently deficient soil nutrient with the supply low in 65% and 80% of the bean production areas [3] . For example, in Uganda, this problem is mainly characteristic of the Southwestern Highlands, central and eastern tall grass zones, and north short grass zones where associated annual mean losses of 200 kg/ha have been reported [3] . Moderate levels resulting into annual mean losses of 100 kg/ha have also been reported in the Western Highlands, Mt Elgon, North Central, and North West parts of the country [3] . And yet all the above mentioned areas form part of the major bean growing and consumption areas of the country. In Tanzania, the problem is reported in the Northern Highlands with very high levels resulting in annual mean losses of 200 kg/ha; in the Usambara, Uluguru, West Kigoma, South Lake, the Southern Highlands and Morogoro, moderate levels of mean annual losses of 100 kg/ha have also been reported [3] .
Symptoms of phosphorous deficiency in common bean plants can be seen on the leaves where by the young leaves become very small with a dark green colour, while the older leaves senescence prematurely [2] . In most soil conditions, phosphorous is the least mobile and least available nutrient to plants [4] [5] . Some soils such as sandy soils possess low total phosphorous content and are also not able to retain the phosphorous added by fertilizer application according to the WRB soil classification system [6] . However, most soils that have little phosphorous available for the plant may contain considerable amounts of phosphorous but a large proportion is bound to different soil constituents, forming complexes of limited availability [6] [7] . On the other hand, some soils with high total phosphorous content fix most of it and will also equally fix a large proportion of the added phosphorous. In both cases, the concentration of phosphate in soil solution is suboptimal for crop production.
Furthermore, the use of fertilizers to correct soil phosphorous deficiency may not be a practical option for the small scale farmers in developing countries because inorganic fertilizers are expensive. In addition to this, recovery of phosphorous nutrient applied as fertilizer by crop plants is also reported to be usually low, because most of the nutrient becomes unavailable due to adsorption, precipitation or conversion to organic forms [8] . Worse still, part of the applied P in intensive cropping systems can enter the waterways through runoff and erosion, contributing to pollution of surrounding lakes and marine environments [9] . Probably an alternative approach to all the above problems is to enhance the plant’s efficiency to acquire soil phosphorous [10] -[12] . Hence the need to identify and use genotypes tolerant to phosphorous deficiency which would also reduce production costs and dependence of farmers on soil amendments.
Tolerance to low phosphorous requires maintenance of plant growth and yields in soils with limited available phosphorous and is reported to occur by two distinct routes namely acquisition efficiency and utilization efficiency [13] . Acquisition efficiency is the plant’s ability to extract phosphorous from the soil and is expected to be related to root system traits that increase root surface area or facilitate phosphorous acquisition [14] . Utilization efficiency is a function of plant growth, remobilization and physiological traits that translate phosphorous acquired by the roots into yield. Therefore phosphorus efficiency is defined as the ability of plants to produce higher biomass or yield, and/or take up more phosphorous under inadequate phosphorous conditions [15] .
Genetic variability for tolerance to low phosphorous soils has been identified in common bean [16] [17] . Breeding of improved common bean lines with greater phosphorous acquisition and better tolerance to low phosphorous soils is a feasible strategy as shown by a range of inheritance studies. Several research efforts have focused on screening of available germplasm such as landraces and several improved genotypes using green house, growth chamber, nutrient solutions and or field screening methods [17] -[19] . Outside Africa, some of the identified sources include the following: 1) G19833, a Peruvian landrace with large yellow and red mottled seed and an indeterminate (Type III) growth habit [18] [20] , 2) G19839, another Peruvian landrace (Andean gene pool) of indeterminate prostrate growth habit (Type III) with a high phosphorus acquisition efficiency [21] , and 3) G4017, a Brazilian cultivar “Carioca” (Mesoamerican gene pool) with intermediate prostrate habit (type III), responsive to phosphorus fertilization, and characterized as having intermediate phosphorus efficiency [21] . While some of the known phosphorus-inefficient breeding lines include 1) DOR 364, of Mesoamerican origin and has an indeterminate bush habit (Type II), erect stems and small seeds, 2) AND 696, a CIAT improved line from the race Nueva Granada, with a determinate growth habit (Type I) and large red and white mottled seed [22] .
In Africa, genotypes tolerant to low soil phosphorous have also been selected [23] -[25] . Genotypes tolerant to low soil phosphorous and other soil fertility stresses such as low Nitrogen and Aluminum toxicity have been put together in nurseries. Nurseries for these genotypes are referred to as BILFA (Bean Improvement for Low soil Fertility soils in Africa). Currently there are seven BILFA nurseries [26] . For example, in BILFA 1 and 11, the low phosphorous lines reported include Carioca, BAT 25, RAO 55, XAN 76 and MMS 224, ACC 433 and Ikinimba [26] . Tolerance was reported among mostly the small seeded types. In BILFA 111, the genotypes ARA 4, A 286, AFR 675, AFR 708, AFR 714, AND 871, CIM 9314-3, CIM 9314-36, CIM 9331-1, CIM 9331-3, DB 196, FEB 192, FEB 196, G 5889, LSA 32, PAN 150, RAB 482, RWR 1873, RWR 1946, RWR 2075, VEF 88(40) L1PYT6 were also reported with tolerance to low P [26] . Some of these low soil phosphorous tolerant genotypes have also been reported to be resistant to Pythium root rot disease under both field and controlled screen house conditions and consequently they have been released as commercial varieties in some African counties such as Uganda and Kenya [27] [28] .
Unfortunately, the current results on low soil fertility tolerances (such as low phosphorous, low nitrogen, and aluminium toxicity) in most of the BILFA genotypes such as RWR 1946 and RWR 2075 have been mainly based on field screening, with possibility of many other confounding factors. Therefore the objective of this research was to reconfirm the earlier observed field tolerant reaction to low soil phosphorous for selected genotypes from the BILFA nursery, particularly those which are also resistant to Pythium root rot disease under controlled screen house conditions.
2. Materials and Methods
2.1. Genetic Materials and Soil Preparation
The experiment was carried out in the screen house at Sokoine University of Agriculture, Morogoro, Tanzania following a completely randomized block design, arranged as split plot with the phosphorous levels as the main plots and the genotypes as sub plots. Three replications were used. Thirteen common bean genotypes as described in Table 1 were grown in four fertilizer levels/treatments namely: 1) absolute control, 2) control for

Table 1. Characteristics of the common bean genotypes used in the experiment.
DRC = Democratic Republic of Congo; M = Mesoamerican; A = Andean; IBN = International Breeding Nursery at CIAT-Colombia.
phosphorous, 3) low phosphorous and 4) high phosphorous.
The substrate was a 6-mm sieved soil originally with the following physical and chemical properties: pH of 4.94 (in H2O), 50.33% clay, 11 .00% silt, 38.67% sand, clay textural class, 3.5 mg of extractable P/kg of soil (p-Bray-1), 0.21% N, 1.37 mg Cu/kg of soil, 0.86 mg Zn/kg of soil, 48.14 mg Mn/kg of soil, 22.19 mg Fe/kg of soil, 1.073% bulk weight of organic carbon, cation exchange capacity of 10 cmol/kg of soil, 1.167 cmol Ca2+/kg of soil, 1.107 cmol Mg2+/kg of soil, 0.513 cmol K+/kg of soil, 0.25 cmol Na+/kg of soil, 0.33 mg H+/kg of soil and 0.583 mg Al3+/kg of soil.
Before potting, soil for each treatment was handled separately and mixed thoroughly well with the respective phosphorous and base fertilizers. For the absolute control, no any fertilizer was added, for the control treatment for P only the base fertilizers i.e. 100 mg K/kg of soil (as potassium choloride), 10 mg Zn/kg of soil (as Zinc sulphate) and 1 mg B/kg of soil (as boric acid) were added with no any phosphorous, the low phosphorous treatment consisted of 10 mg P/kg of soil as triple super phosphate and the same rate of the above base fertilizers and the high phosphorous treatment consisted of 160 mg P/kg of soil as tripple super phosphate also with the same rate of the mentioned base fertilizers. For each treatment, 4 kg of soil was potted into 4 litre plastic buckets which were later placed in the open air above on a metallic screen house bench. Watering was done to field capacity. Sowing was done when the soil had reached field capacity. One bucket for each treatment was kept unplanted to measure soil evaporation losses from the buckets. 5 seeds of each genotype were sown and 7 days after emergence, thinning was done leaving only three plants per bucket. Watering was done as adequately as possible. For each of the buckets for the control, low phosphorous and high phosphorous treatments, nitrogen fertilizers i.e. 200 mg N/kg of soil (as ammonium sulphate) and 200 mg N/kg of soil as Urea were applied via dilute solution 12 and 25 days after emergence respectively.
2.2. Plant Measurements
At 45 days after planting, the most fully expanded top trifoliate leaf (including petioles) from one plant per bucket was detached, and leaf length and leaf width measured. For each leaf among the trifoliate, leaf length was measured from lamina tip to the point of intersection of the lamina and the petiole, along the mid rib of the lamina. Leaf width was measured from end to end between the widest lobes of the lamina perpendicular to the mid rib. These linear measurements were then used to estimate the average leaf area per genotype following the model below as described by Bhatt and Chanda [29] ;

where LA = Leaf area; L= Length of the leaf midrib; W = Maximium leaf width.
At mid pod filling stage, which ranged from 48 to 54 days after planting, shoots (including petioles, leaves, stems) were harvested per bucket and oven dried for 4 days at 70˚C. Shoot dry weights were recorded. Roots including nodules were separated from soil by washing with water, left to dry in the open air and then put in the oven at 70˚C for 4 days. Root dry weights were recorded. Note that after pod setting, root growth is less intense. Using one representative root sample per bucket, total root length was determined from the base of the hypocotyl along the length of the longest basal root with the lateral roots that emerge from them. It is important to note that basal roots arise from the base of the hypocotyl and in conjunction with the lateral roots that emerge from them, basal roots usually comprise the majority of total root length [30] . Basal and lateral root production in response to phosphorus availability was visually scored based on a scale of 1 - 9, where 1 is excellent and 9 is very poor according to the common bean Shovelomics. Shoot P concentration was determined following the calorimetric determination method as described by Murphy and Riley [31] . P uptake was also calculated as the product of the shoot biomass and shoot P concentration.
2.3. Data Analysis
Analysis of variance and correlation among variables was performed using GENSTAT v.14. software (VNS International Hempstead, UK). Where means were different significantly, fisher’s protected LSD was used. Leaf area, shoot mass and root mass data for two of the genotypes namely G 19839 and AND 1055 was excluded from the analysis and is therefore not presented.
3. Results
3.1. Phosphorous Response
Treatment (P level) effects were highly significant (P = 0.05) on all the variables measured (Table 2). In contrast, effect of genotype was also highly significant (P = 0.05) on all the other variables, except root mass, shoot P concentration and P uptake. Only leaf area, total root length, and basal and lateral roots production were influenced by both genotype and P level. In addition, the F values for all the measured variables at either the genotype or treatment level were higher than the F values for genotype × interaction level.
The mean values for the leaf size, shoot mass, root mass, total root length, basal and lateral roots production scores, shoot P concentration and P uptake for the 13 common bean genotypes evaluated in four different phosphorous levels were highly significant (Table 3). Leaf area increased with increase in phosphorous levels, ranging from 7.63 cm2/leaf to 17.08 cm2/leaf. Shoot mass also increased with increase in phosphorous level, being very significantly different with the high phosphorous treatment at 10.175 gm/plant. However it did not differ significantly for the control and the absolute control treatments. The root mass also increased significantly with increase in phosphorous levels, with mean values ranging from 0.3258 gm/plant to 1.4545 gm/plant. However there was no significant difference for the low phosphorous and absolute control treatments. On the other hand, for the total root length highly significant mean values of 22.29 cm and 21.59 cm were observed for the absolute control and high phosphorous treatments respectively. Basal and lateral roots production also varied significant
Table 2. Analysis of variance for the different variables evaluated for the common bean genotypes.
Trt. = Treatment (phosphorous levels); Gen. × Trt. = Genotype × treatment interaction. Levels of P ≤ 0.001 were highly significant.
ly with excellent average scores of 1.378 recorded at the high phosphorous treatment and poor average score of 6.974 recorded at the control for phosphorous treatment. Shoot P concentration ranged from 0.1157% to 0.2323%. P uptake was also highly variable ranging from 1.647 to 22.638 mg P/Plant, but was not significantly different for the absolute control and control for P treatments. In general, high phosphorous level resulted into better performance of all the variables that were measured. While for all the variables, the absolute control was always higher than the control treatment.
High P level markedly increased the leaf size (leaf area per leaf), shoot mass, total root length, basal and lateral roots production, shoot P concentration and P uptake (Table 4). While extreme phosphorus deficiency strongly reduced the leaf area and shoot mass more than the root mass. The control for phosphorous treatment had the strongest reduction effect on all the measured plant traits more than the absolute control and the low phosphorous treatments.
3.2. Genotypic Variability
Genotypic variation for each variable under each of the four treatment levels is presentable in Figures 1-4 and Table 5 separately. Leaf area: For this variable, both the genotype and treatment as sources of variation were highly significant (<0.001). Under extreme phosphorous deficiency (i.e. the absolute control and control for phosphorous treatment), the leaf area was reduced ranging from 8.60 to 11.43 cm2/leaf, where genotype RWR 1946 had the biggest leaf area. When phosphorous was applied at a rate of 10 mg P/kg of soil (low phosphorous), genotype RWR 1946 and RWR 2075 had the highest leaf area of 16.33 and 15. 58 cm2/leaf respectively (Figure 1). At high phosphorous level of 160 mg P/kg of soil, genotype RWR 1946 had the highest response to phos
Table 3. Mean values for the leaf size, shoot mass, root mass, total root length, basal and lateral roots production scores, shoot P concentration and P uptake for the 13 common bean genotypes evaluated under four different phosphorous levels.
Means followed by the same letter within the same column are not significantly different (P = 0.05) by Fisher’s protected least significant difference test. Absolute control = no any fertilizer was added; Control treatment = only the base fertilizers i.e. 100 mg K/kg of soil (as potassium choloride), 10 mg Zn/kg of soil (as Zinc sulphate) and 1 mg B/kg of soil (as boric acid) and nitrogen fertilizers i.e. 200 mg N/kg of soil (as ammonium sulphate) and 200 mg N/kg of soil (as Urea) were added with no any phosphorous; low phosphorous treatment = consisted of 10 mg P/kg of soil as triple super phosphate and the same rate of the above base and nitrogen fertilizers and; the high phosphorous treatment = consisted of 160 mg P/kg of soil as triple super phosphate also with the same rate of the above base and nitrogen fertilizers.
Table 4. Effect of phosphorous levels on leaf area, shoot mass, root mass, total root length and basal and lateral roots production, shoot P concentration and P uptake.
Table 5. Genetic variability for basal and lateral roots production score in response to phosphorous availability on a scale of 1 - 9.
CV% = 23.7; LSD (5%) = 1.926; 1 - 9 scale, where 1 is excellent and 9 is very poor according to the common bean Shovelomics.
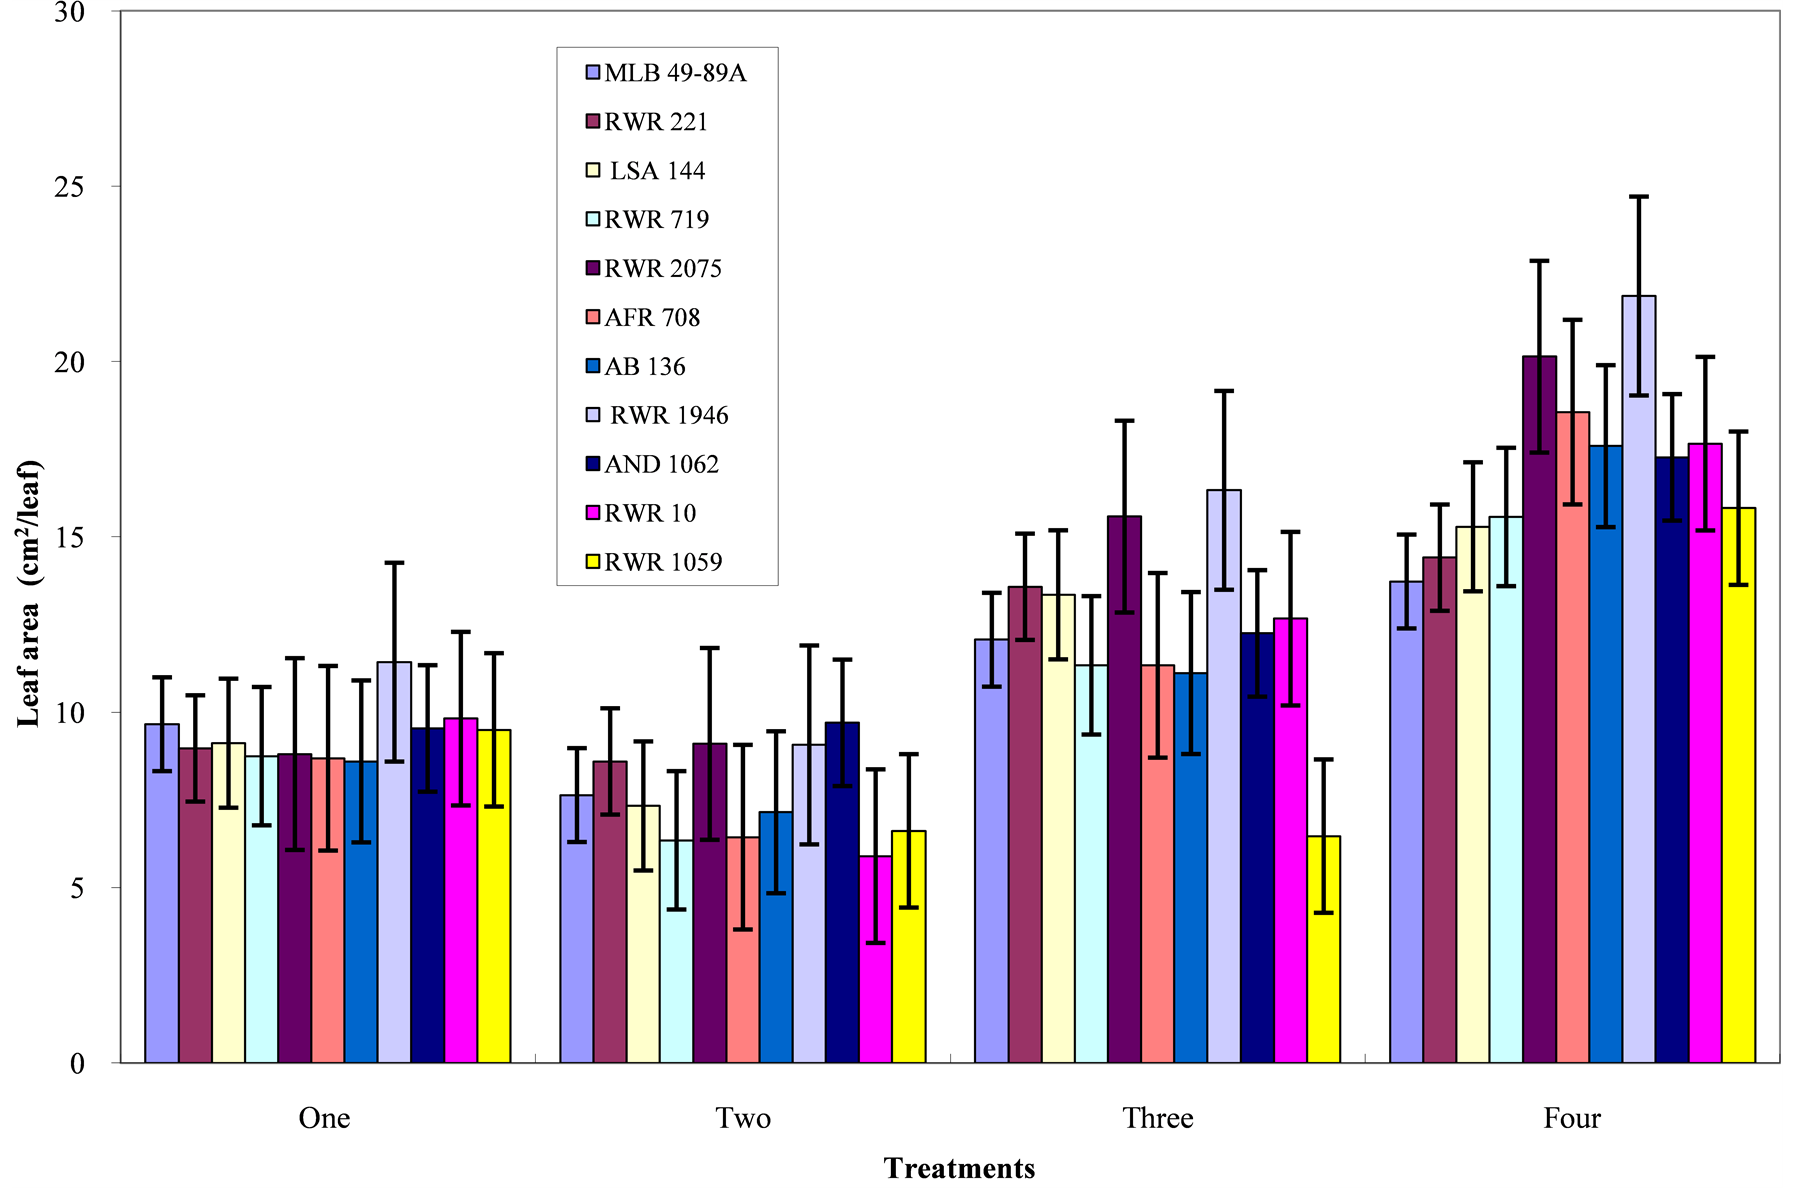
Figure 1. Phosphorous level and genotype interaction effects on leaf area; Treatments one = absolute control; Two = control for phosphorous; Three = low phosphorous; Four = high phosphorous.
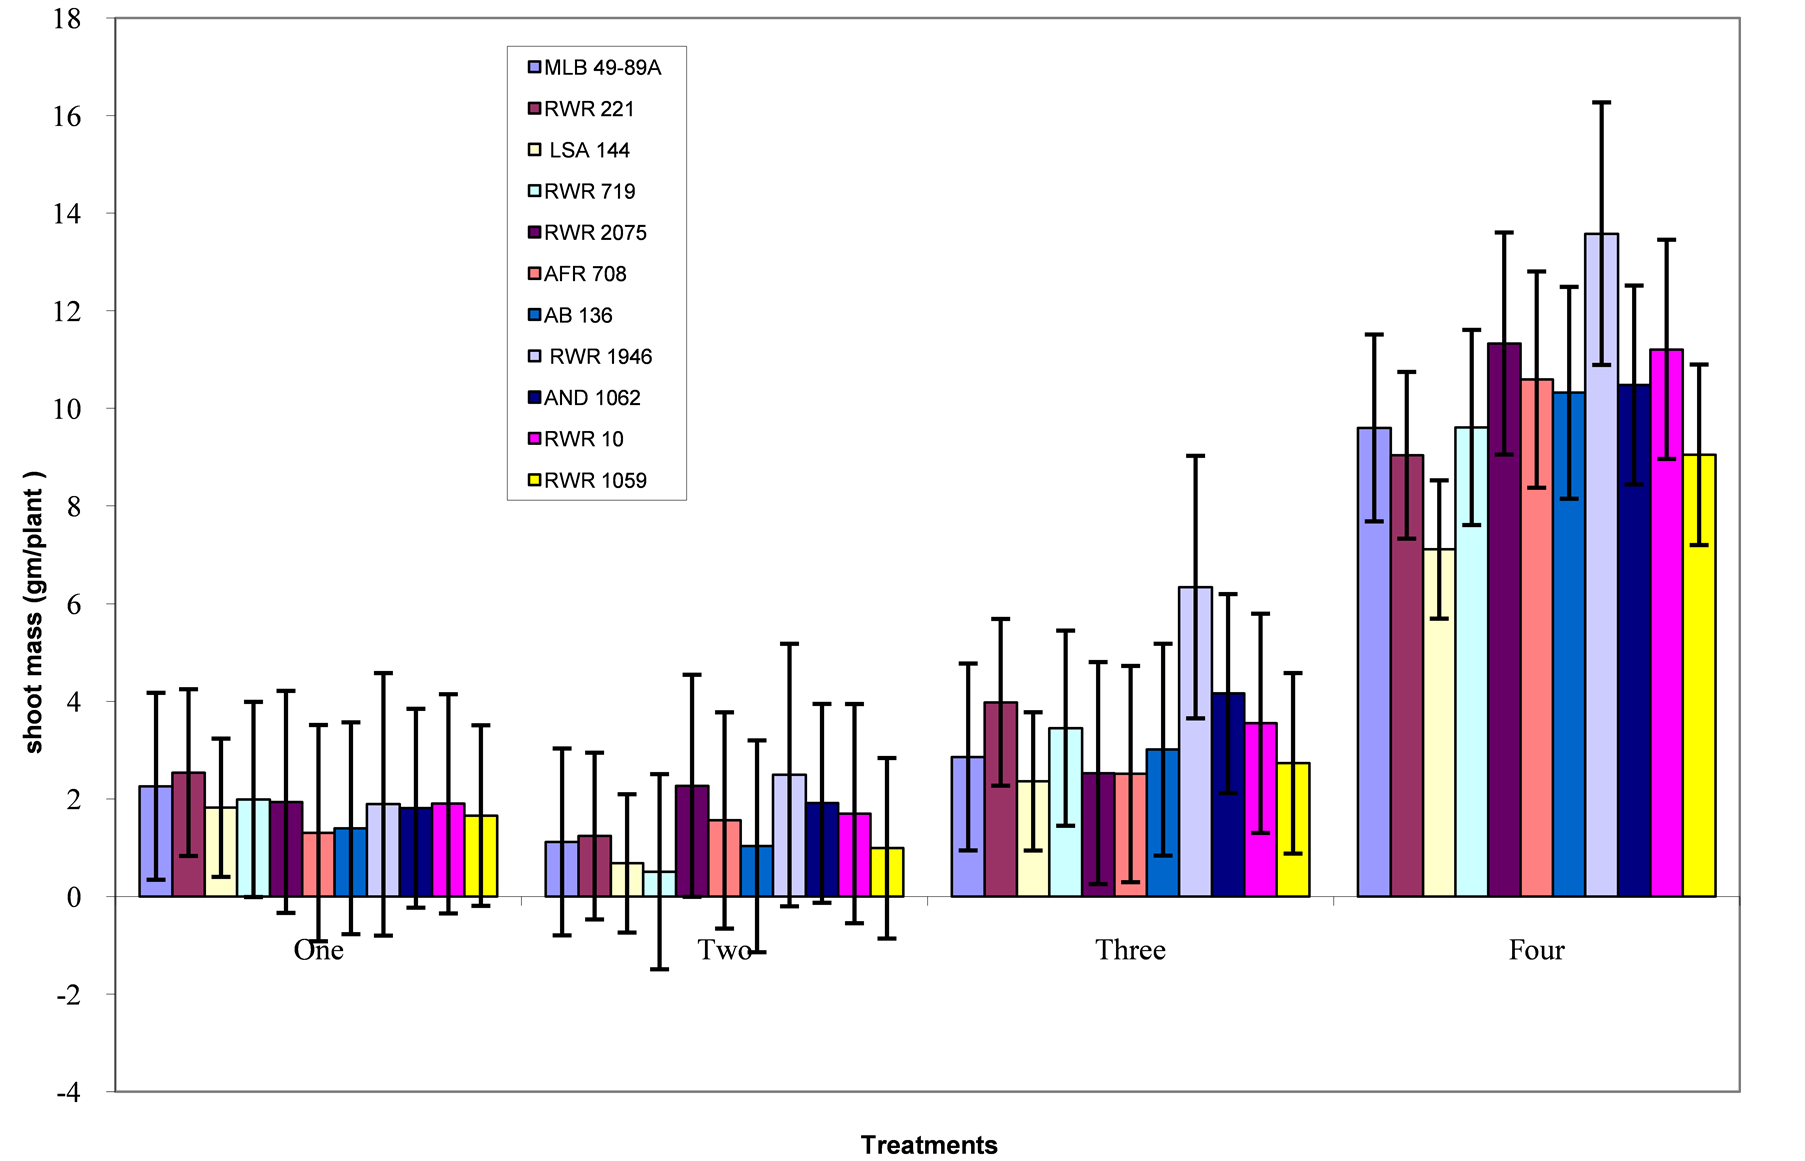
Figure 2. Phosphorous level and genotype interaction effects on shoot mass: Treatment 1 = absolute control; 2 = control for phosphorous; 3 = low phosphorous; 4 = high phosphorous.
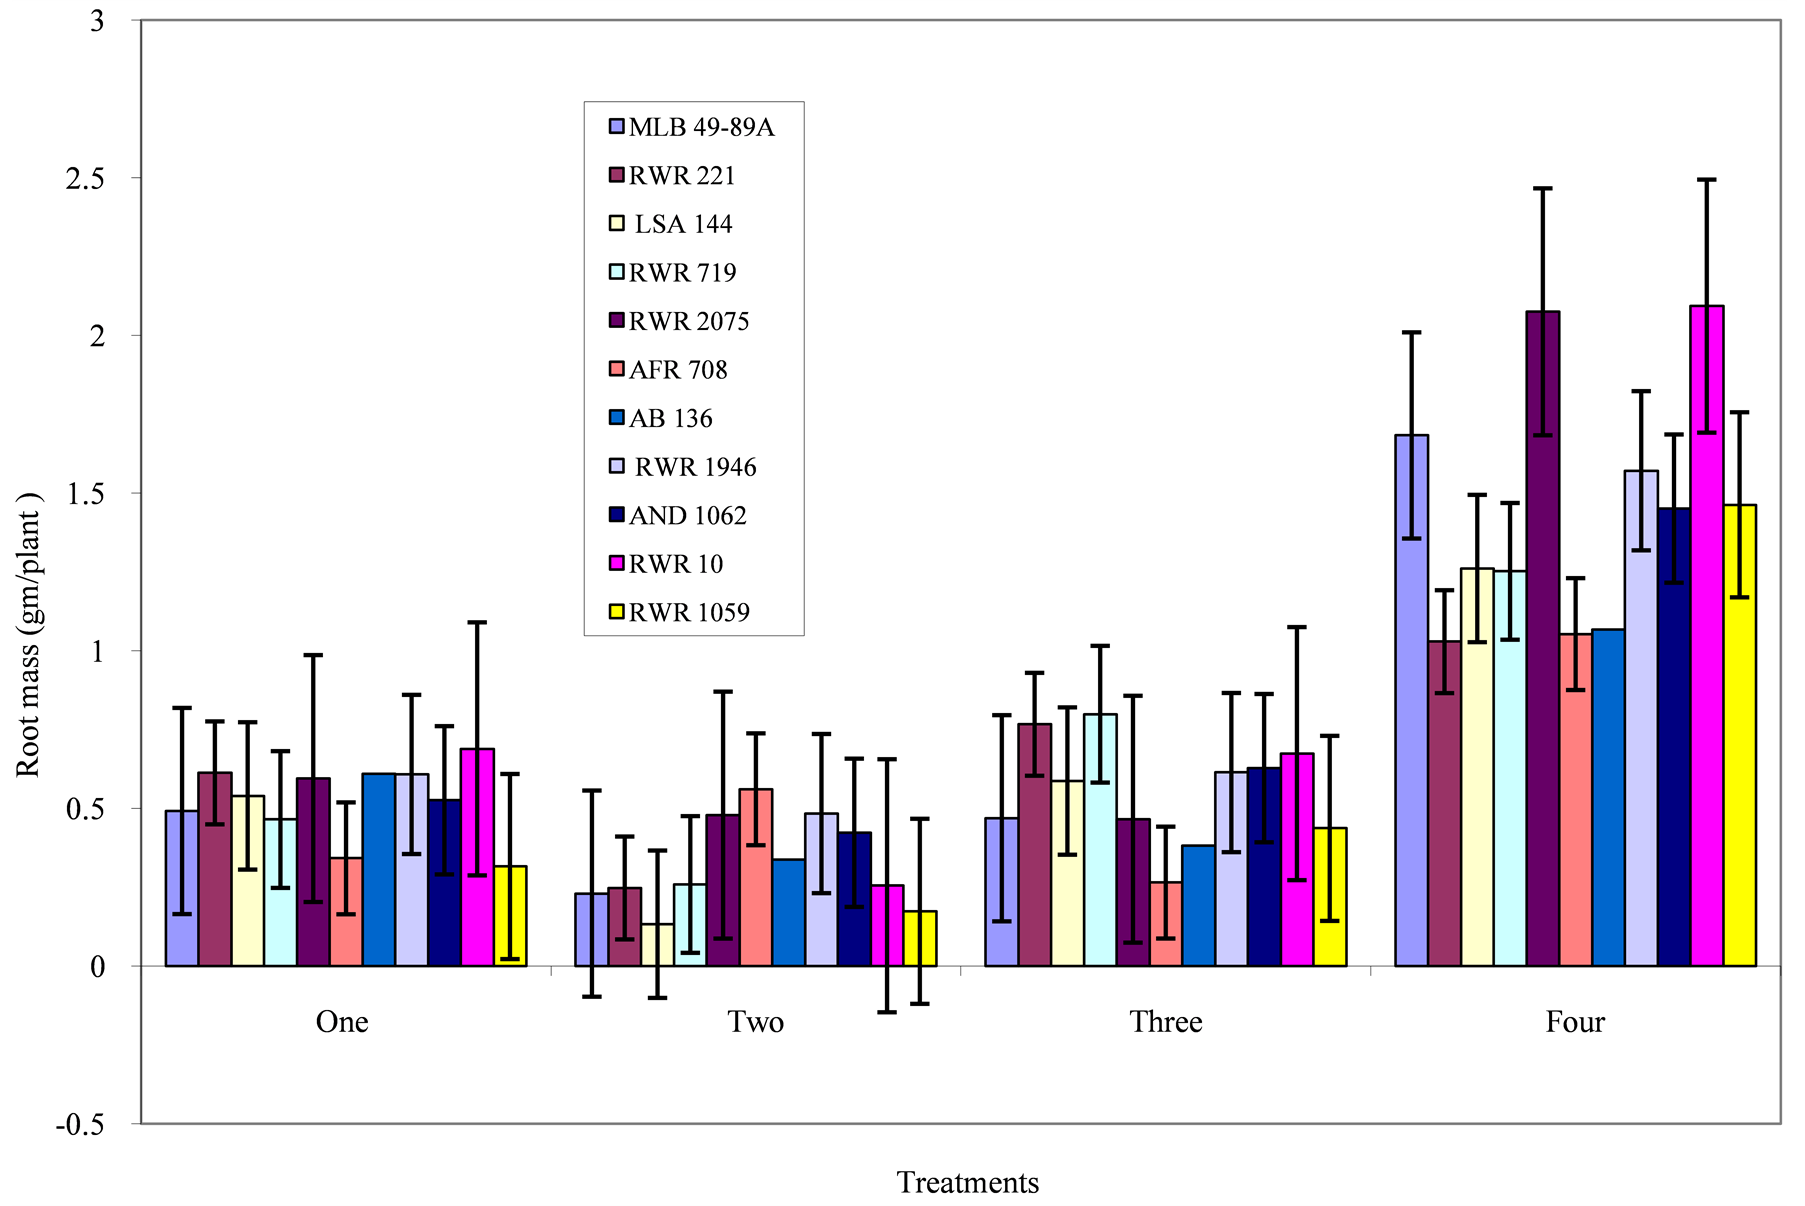
Figure 3. Phosphorous level and genotype interaction effects on root mass: Treatment 1 = absolute control; 2 = control for phosphorous; 3 = low phosphorous; 4 = high phosphorous.
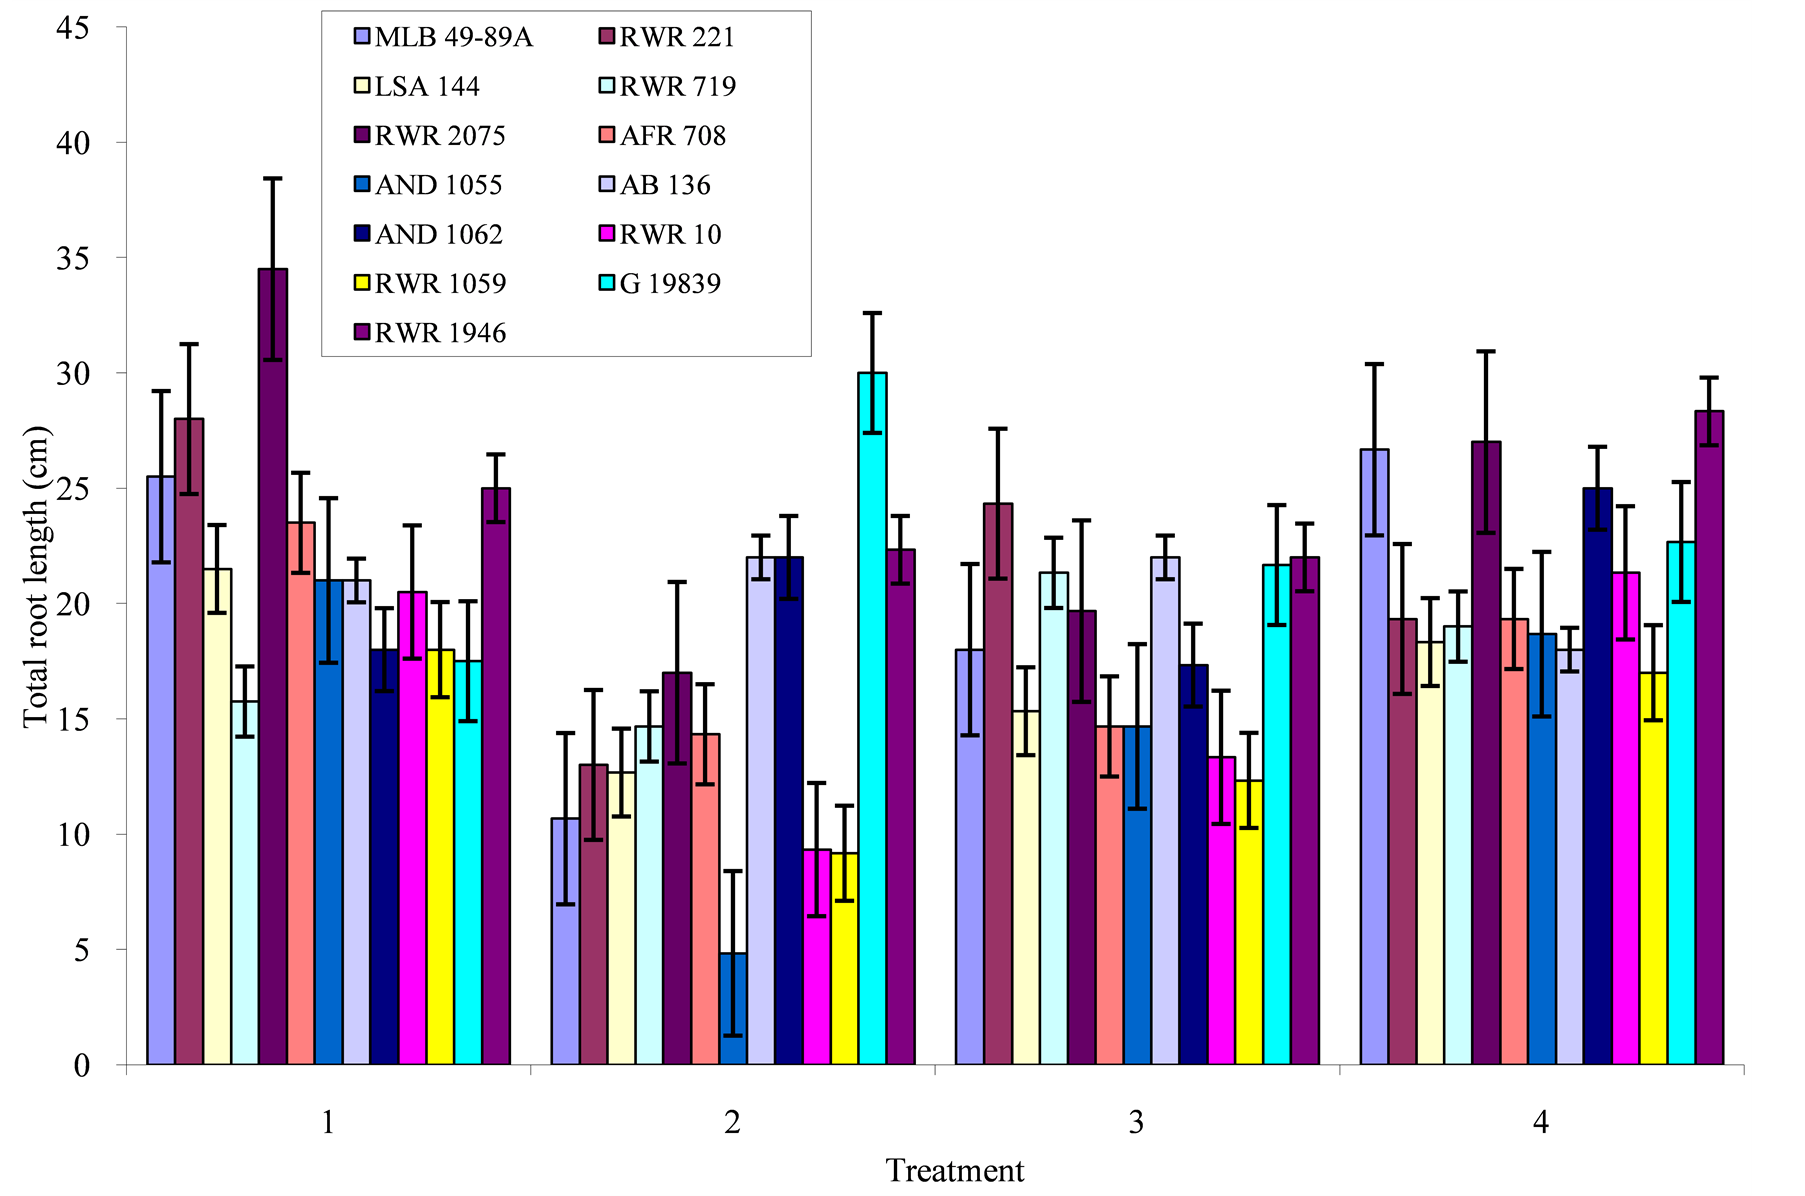
Figure 4. Phosphorous level and genotype interaction effects on total root length: Treatment 1 = absolute control; 2 = control for phosphorous; 3 = low phosphorous; 4 = high phosphorous.
phorous, followed by genotypes RWR 2075 and AFR 708.
Shoot mass: The genotypes did not have significantly different shoot mass under extreme phosphorous deficiency. Highest shoot mass of 2.54 gm/plant and 2.26 gm/plant was observed among genotypes RWR 221 and MLB 49-89A respectively under the absolute control treatment (Figure 2). While under the control for phosphorous treatment, genotypes RWR 1946 and RWR 2075 had the highest mass of 2.49 and 2.27 gm/plant respectively. At a rate of 10 mg P/kg of soil, genotype RWR 1946, had the highest shoot mass of 6.34 gm/plant. While at high phosphorous level of 160 mg P/kg of soil, all the genotypes significantly responded with the highest shoot mass of 13.58, 11.33 and 11.21 gm/plant being recorded with genotypes RWR 1946, RWR 2075 and RWR 10 respectively.
Root mass: Mean genotypic variation for root mass was lowest in the control for phosphorous treatment (Figure 3). Under the absolute control and low phosphorous treatments, the genotypes had moderately high root mass. A high response in the root mass was observed with an increase in phosphorous application for all the genotypes. However, the highest root mass of 2.093 and 2.075 gm/plant was recorded on genotype RWR 10 and RWR 2075 respectively.
Total root length: Genotypic variation for total root length was highest in the absolute control (Figure 4), where genotypes RWR 2075, RWR 221, and RWR 1946 had the highest values of 34.50, 28.00 and 25.00 cm respectively. When phosphorous was applied at a rate of 10 mg P/kg of soil, genotypes RWR 221, RWR 1946, AB 136 and G 19839 had the highest total root lengths. An increase in phosphorous did not lead to an increase in root length for some genotypes such as RWR 719 and AB 136. In other genotypes such as RWR 1946, RWR 2075, MLB 49-89A, and AND 1062, increase in phosphorous to 160 mg P/kg of soil the total root length increased. Genotype RWR 1946 produced nearly the same total root lengths of 25.00, 22.33 and 22.00 cm under phosphorous deficiency and 28.33 cm under high phosphorous. Phosphorous deficiency reduced the root length in some genotypes, while in other genotypes such as G 19839, RWR 1946, AB 136, root length was increased.
Basal and lateral roots production score in response to phosphorous availability: Generally genotypic variation for production of basal and lateral roots was more evident under phosphorous deficiency than high phosphorous. It was poorest under the control for phosphorous treatment (Table 5). Under the absolute control, genotypes produced slightly more and longer basal and lateral roots where genotypes such as RWR 1946 and RWR 2075 had vigorous and good root production scores. Under the low phosphorous treatment, some genotypes such as RWR 2075 and AB 136 had more vigorous and increased production of roots than the others. However, much as production of these roots was greatest at high phosphorous level, there was no significant difference among the response of the genotypes because at this level all genotypes extremely responded in a similar way.
Shoot P concentration: There was significant difference in shoot P concentration for the treatment levels. Under the absolute control, genotypes AFR 708, AB 136 and RWR 1946 had the highest shoot P concentration of 0.1976%, 0.1999% and 0.1855% respectively (Figure 5). While LSAA 144 and RWR 221 had the lowest. For the control treatment, genotypes RWR 2075, RWR 719, AFR 708 and RWR 1946 had the highest values, the lowest being observed with genotype AND 1055. Under low phosphorous treatment, genotypes RWR 2075, LSAA 144 and RWR 1946 had the highest shoot P concentration. When phosphorous level was highly increased, genotype AFR 708, LSAA 144, RWR 221 and AND 1055 had the highest values.
P uptake: Generally the studied genotypes had the poorest P uptake under the control for phosphorous treatment followed by the absolute control (Figure 6). Genotypes AND 1055 and RWR 1946 had the highest P uptake under the absolute control. While under the control for phosphorous treatment, genotypes RWR 2075 and RWR 1946 had the highest, with the lowest P uptake being observed among genotype AND 1055. Under the low phosphorous treatment, genotypes RWR 1946, RWR 221, RWR 10, AND 1062 and RWR 2075 had the highest P uptake. At the high phosphorous treatment, P uptake was highest in genotypes AFR 708, RWR 1946, RWR 2075 and AB 136.
Simple correlations for measured variables: Correlations between the measured variables were highly significant as shown in Table 6. However, no correlation existed between treatment (phosphorous levels) and genotypes. Genotypes had weak correlation coefficients with any of the variables under study. Unlike genotypes, a strong positive correlation existed between treatments and all the variables, except total root length. Leaf area was positively correlated with all variables, and had the highest correlation coefficient with shoot mass and the lowest was with total root length. Shoot mass was positively correlated with all variables, with the highest correlation coefficient being with P uptake and the lowest was with total root length. Root mass was positively correlated with all variables. Total root length had weak correlations with shoot P concentration and P-uptake, but negatively correlated with treatment. Lateral and basal roots production had a strong positive correlation with the root mass. Shoot P concentration was highly and positively correlated with P uptake and shoot mass. On the other hand, P-uptake was positively and strongly correlated with treatment, leaf area, shoot mass, root mass, shoot P concentration and lateral roots production. However, it was weakly correlated with genotype and total root length.
Table 6. Pearson simple correlations (r-values) between variables measured on 13 common bean genotypes under phosphorous deficiency and high phosphorous.
**. Correlation is significant at the 0.01 level (2-tailed).
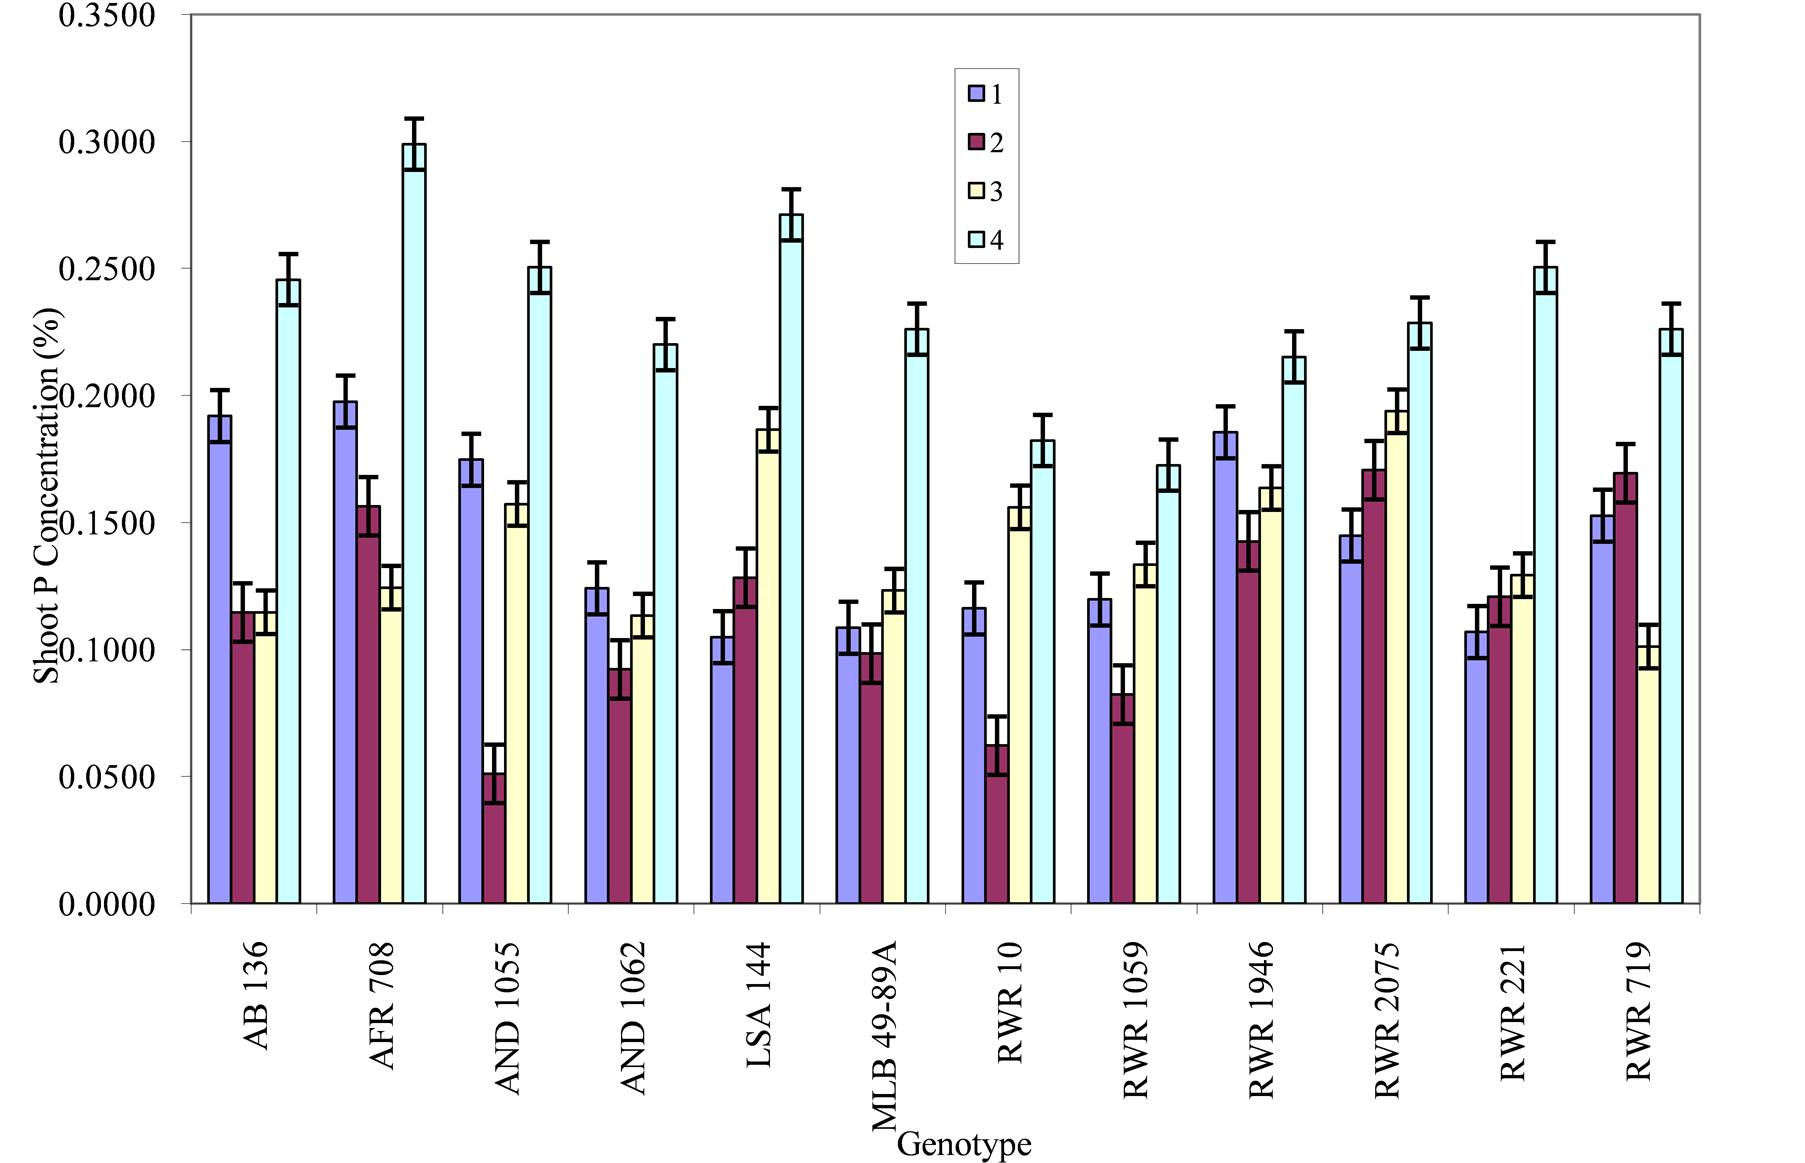
Figure 5. Phosphorous level and genotype interaction effects on shoot P concentration: Treatment 1 = absolute control; 2= control for phosphorous; 3= low phosphorous; 4= high phosphorous.
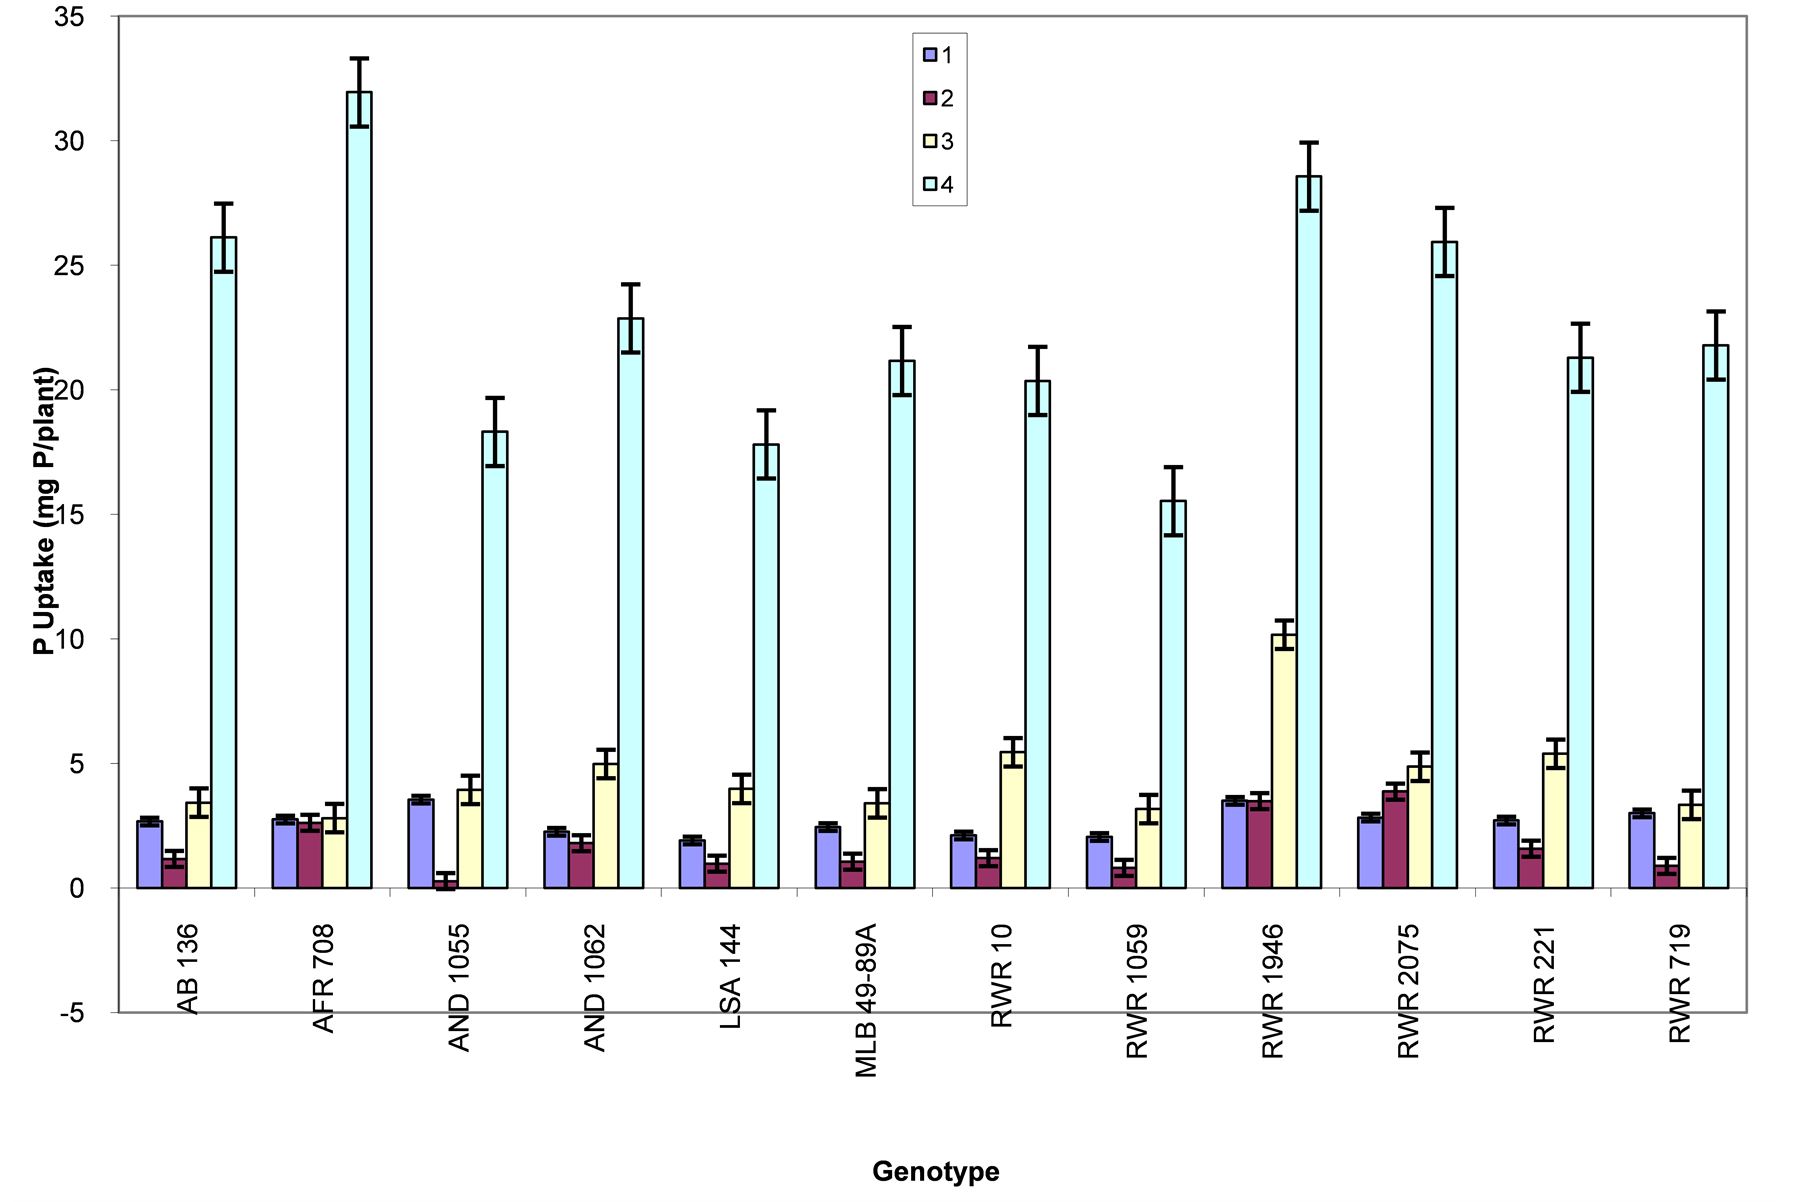
Figure 6. Phosphorous level and genotype interaction effects on P uptake: Treatment 1 = absolute control; 2 = control for phosphorous; 3 = low phosphorous; 4 = high phosphorous.
4. Discussion
The genotypes used in this study varied in leaf area, shoot mass, root mass, total root length, basal and lateral roots production, shoot P concentration and P uptake under varying phosphorous availability levels. These observations confirm that there is genetic variability for response to soil phosphorous availability in common bean [13] [16] [32] [33] . Phosphorus deficiency strongly reduced the leaf area of bean plants implying that genotypes such as RWR 1946 and RWR 2075 observed with the highest leaf area were able to maintain their leaf growth under low phosphorous availability. Leaf area production is important for energy transference and processes for dry matter accumulation in the crop canopy. According to Trindade et al. [34] , low phosphorus supply markedly limits leaf growth in common bean and genotypes able to maintain adequate leaf area at low P could adapt better to limited-P conditions. The observation that low P reduced leaf area is consistent with several earlier findings; for example [35] , and [36] reported that leaf area development was reduced by phosphorus deficiency in common bean. [37] also showed that phosphorus deficiency reduced leaf expansion in cotton. Decreases in leaf area were also observed in soybean plants deprived of P [38] . It is hypothesized that the restricted rate of expansion of individual leaves could result from reduced leaf epidermal cell area [38] , fewer cells per leaf primordia or limited cell elongation [39] . On the other hand, the significant increase in leaf area observed among all genotypes at 160 mg P/kg of soil, most especially for genotypes RWR 1946 and RWR 2075 confirms that leaf area of bean plants responds to increased P supply mainly by improving the leaf appearance and by enhancing leaf expansion [35] .
The decrease in leaf area due to phosphorous deficiency was also accompanied by decrease in shoot biomass. This is because when leaf expansion is reduced, there is less carbon assimilation which results into low shoot biomass. Therefore the genotypes observed with higher mean values for the shoot biomass at low phosphorous availability were more efficient. P efficiency is defined as the ability of plants to produce relatively more yield (either biomass or grain) with suboptimal P availability or take up more P under in adequate P conditions [15] [20] . The root biomass also increased with increase in phosphorous level. In our results, phosphorus deficiency strongly reduced the shoot mass more than the root mass. This is in agreement with other studies that showed that root growth is less affected by phosphorus stress than shoot growth [35] [36] [40] . This is also in accordance with the Brouwer hypothesis, which states that if there is a suboptimal nutrient supply, the growth of the shoots will be checked sooner than that of roots because the latter are closer to the source of the deficient nutrient [41] .
Increased production (length and number) of lateral roots and total root length in some genotypes, confirmed that low phosphorous availability modifies root architecture traits such as number and length of lateral roots, primary root length, root branching, enhancement of root hair and cluster root formation, adventitious rooting, top soil foraging in common bean and in other cultivated crops [21] [42] -[47] . From our results, lateral and basal roots production was also positively correlated to P-uptake confirming the fact that, lateral roots play an important role in plant adaptation to low phosphorous availability by increasing soil exploration [48] [49] , the absorptive surface of the root system [50] and P solubilization [11] , which results into increased P uptake. Several other studies have also reported that plant roots typically respond to P deficiency through allocation of more carbon to roots resulting in increased root growth, enhanced lateral root formation, greater exploration of the surface soil, increased length and number of root hairs [43] [51] [52] that increase P availability. Well as some genotypes showed increased and vigorous production of lateral and basal roots under low phosphorous availability, others showed the opposite. This is because the response of lateral roots to P deficiency shows genotypic and species variations. For example, in arabidopsis low P availability also promotes the development of a highly branched root system characterized by the stimulated formation and emergence of lateral roots and root hairs [53] -[55] . This is because under low P concentrations, the mitotic activity is relocated to the sites of lateral root formation, which leads to increased lateral root density [56] and that each lateral root can produce more lateral roots and a complex root system is constructed by the reiteration of a single developmental process. Consequently because of increased lateral elongation, the total root length increased such that in this study we also observed that phosphorous deficiency increased the total root length in some genotypes such as G 19839, RWR 1946, AB 136 and RWR 221 and reduced it in others. Genotype RWR 1946 produced nearly the same total root length under phosphorous deficiency and high phosphorous, implying it was phosphorous efficient. Phosphorus-efficient genotypes G2333 and G19839 were also reported to have greater and statistically significant root length under both medium and low phosphorus than the phosphorus-inefficient genotypes [21] . According to Lynch and Van Beem, [57] , a P efficient genotype had a vigorous, highly branched root system with numerous basal roots while a P inefficient genotype had a smaller, less branched root system. Yan et al., [20] reported that P efficient genotypes had more root length than inefficient genotypes.
High and significant correlations between leaf area and shoot mass, leaf area and root mass, leaf area and P uptake, shoot mass and root mass, shoot mass and P-uptake, and root mass and P uptake indicates that direction selection for either improved leaf area or shoot mass under limited phosphorous supply would result into increased root mass and P uptake, also confirming that leaf and shoot growth was determined by the amount of phosphorous absorbed [8] . Several morphological characters including root and shoot dry weights have been identified as important to low P tolerance in common bean [23] . From our results, the negative effect of phosphorous deficiency on P uptake confirms that uptake of P also depends on its availability in the soil. The observed variation in P uptake among the genotypes under the four treatments shows the diversity in efficiency with which bean plants are able to absorb phosphorus from the soils of varying phosphorous availability. Therefore, P uptake would be a good indicator of P acquisition efficiency which is the plant’s ability to extract P from the soil.
A positive and high response of all bean genotypes to increased phosphorous levels confirmed that phosphorous is an important macronutrient for common bean growth and production. On the other hand, the absolute control treatment where no any fertilizer was added at all resulted into better performance of the measured variables than the control for phosphorous treatment where at least base fertilizers i.e. 100 mg K/kg of soil (as potassium choloride), 10 mg Zn/kg of soil (as Zinc sulphate) and 1 mg B/kg of soil (as boric acid) and nitrogen fertilisers i.e. 200 mg N/kg of soil (as ammonium sulphate) and 200 mg N/kg of soil (as Urea) were added but with no any phosphorous. This was not expected and it is hypothesized that adding of nitrogen and the base fertilizers alone without phosphorous in the control treatment may have triggered processes that might have made the little available soil phosphorous to become the more unavailable. Application of Urea and ammonium sulphate increases acidity of the soil. Furthermore, the relatively poor performance of variables in the control treatment despite having received nitrogen and base fertilisers but with no phosphorous unlike in the absolute control with none at all, strongly shows that nitrogen cannot be utilized in the absence of phosphorous.
5. Conclusion
It can be concluded that out of the studied common bean genotypes, some genotypes were more tolerant to low phosphorous availability and greatly responded to added P than others. Generally the large-seeded genotypes RWR 1946 and RWR 2075 appeared to have superior P efficiency under low P availability, while at the same time they are more responsive to added P. The root rot resistant genotypes namely RWR 719, MLB 49-89A, AND 1062, AND 1055 and genotypes AFR 708 and RWR 221 were of moderate tolerance. While genotypes LSA 144 and RWR 1059 were the least efficient. This controlled screen house study therefore complements the earlier observed field findings for tolerance to low soil phosphorous under the BILFA strategy that had highlighted genotypes such as RWR 2075 (red), AFR 708 (Calima) and many others as tolerant to low soil phosphorous [24] [25] . In addition, the higher F values observed for all the measured variables at either the genotype or treatment level than the F values for genotype × interaction level suggest that phosphorous tolerance in the studied genotypes is likely to be stable. We therefore hypothesize that existing genetic variation for P efficiency in the studied common bean genotypes is likely to be due to variation in P acquisition efficiency rather than P use efficiency.
Acknowledgements
The authors wish to extend their sincere appreciation to the management of the Department of Soil Science, Faculty of Agriculture, Sokoine Univeristy of Agriculture, Morogoro, Tanzania for allowing them to use the screen house space and the facilities. We thank Mr. Salum Shomary Marangi, Mr. Kilosa and Mr. G. P. Malekela for their technical guidance during the experiment. This research was implemented under the financial support of the Rockefeller Foundation, Grant 2006 FS 056.
References
- Beebe, S.E., Rojas-Pierce, M., Yan, X.L., Blair, M.W., Pedraza, F. and Munoz, F. (2006) Quantitative Trait Loci for Root Architecture Traits Correlated with Phosphorus Acquisition in Common Bean. Crop Science, 46, 413-423. http://dx.doi.org/10.2135/cropsci2005.0226
- Allen, D.J., Ampofo, J.K. and Wortmann, C.S. (1996) Pests, Diseases and Nutrition Disorders of Common Bean in Africa. A Field Guide, 96.
- Wortman, C.S., Kirkby, R.A., Eledu, C.A. and Allen, D.J. (1998) Atlas of Common Bean (Phaseolus vulgaris L.) Production in Africa. CIAT, Cali, 131.
- Schachtman, D.P., Reid, R.J. and Ayling, S.M. (1998) Update on Phosphorus Uptake. 689 Phosphorus Uptake by Plants: From Soil to Cell. Plant Phyisiology, 116, 447-453. http://dx.doi.org/10.1104/pp.116.2.447
- Hinsinger, P. (2001) Bioavailability of Soil Inorganic P in the Rhizosphere as Affected by Root-Induced Chemical Changes: A Review. Plant Soil, 237, 173-195. http://dx.doi.org/10.1023/A:1013351617532
- Driessen, P., Deckers, S., Spaargaren, O. and Nachtergaele, F. (2001) Lecture Notes on the Major Soils of the World. FAO, Rome.
- Fairhust, T., Lefroy, E., Mutert, E. and Batjes, N. (1999) The Importance, Distribution and Causes of Phosphorus Deficiency as a Constraint to Crop Production in the Tropics. Agroforestry Forum, 9, 2-8.
- Araujo, A.P., Ferreira, A.I. and Grande Teixeira, M. (2005) Inheritance of Root Traits and Phosphorous Uptake in Common Bean (Phaseolus vulgaris) under Limited Soil Phosphorous Supply. Euphytica, 145, 1-2, 33-40. http://dx.doi.org/10.1007/s10681-005-8772-1
- Tesfaye, M., Liu, J.Q., Allan, D.L. and Vance, C.P. (2007) Genomic and Genetic Control of Phosphate Stress in Legumes. Plant Physiology, 144, 594-603. http://dx.doi.org/10.1104/pp.107.097386
- Shenoy, V.V. and Kalagudi, G.M. (2005) Enhancing Plant Phosphorus Use Efficiency for Sustainable Cropping. Biotechnology Advances, 23, 501-513. http://dx.doi.org/10.1016/j.biotechadv.2005.01.004
- Lynch, J.P. (2007) Roots of the Second Green Revolution. Australian Journal of Botany, 55, 493-512. http://dx.doi.org/10.1071/BT06118
- Fageria, N.K., Baligar, V.C. and Li, Y.C. (2008) The Role of Nutrient Efficient Plants in Improving Crop Yields in the Twenty First Century. Journal of Plant Nutrition, 31, 1121-1157. http://dx.doi.org/10.1080/01904160802116068
- Lynch, J.P. and Beebe, S.E. (1995) Adaptation of Beans (Phaseolus vulgaris L.) to Low Phosphorus Availability. Horticulture Science, 30, 1165-1171.
- Gahoonia, T.S. and Nielsen, N.E. (2003) Phosphorus Uptake and Growth of a Root Hairless Barley Mutant (Bald Root Barley, BRB) and Wild Type in Lowand High-P Soils. Plant Cell Environment, 26, 1759-1766. http://dx.doi.org/10.1046/j.1365-3040.2003.01093.x
- Yan, X.L., Wu, P., Ling, H.Q., Xu, G.H., Xu, F.S. and Zhang, Q.F. (2006) Plant Nutriomics in China: An Overview. Annals of Botany, 98, 473-482. http://dx.doi.org/10.1093/aob/mcl116
- Beebe, S., Lynch J., Galwey, N., Tohme, J. and Ochoa, I. (1997) A Geographical Approach to Identify Phosphorus-Efficient Genotypes among Landraces and Wild Ancestors of Common Bean. Euphytica, 95, 325-336. http://dx.doi.org/10.1023/A:1003008617829
- Singh, S.P., Teran, H., Munoz, C.G., Oscorno, J.M., Takegami, J.C. and Thung, M.D.T. (2003) Low Soil Fertility Tolerance in Landraces and Improved Common Bean Genotypes. Crop Science, 43, 110-119. http://dx.doi.org/10.2135/cropsci2003.0110
- Cichy, K.A.C., Blair, M.W., Mendoza, C.H.G., Snapp, S.S. and Kelly, J.D. (2009) QTL Analysis of Root Architecture Traits and Low Phosphorous Tolerance in an Andean Bean Population. Crop Science, 49, 59-68. http://dx.doi.org/10.2135/cropsci2008.03.0142
- Beebe, S., Rao, I.M., Blair, M.W. and Butare, L. (2009) Breeding for Abiotic Stress Tolerance in Common Bean: Present and Future Challenges. Proceedings of the 14th Australian Plant Breeding and 11th Society for the Advancement of Breeding Research in Asia and Oceania (SABRAO) Conference, Brisbane, 10-14 August 2009.
- Yan, X.L., Beebe, S.E. and Lynch, J.P. (1995) Genetic Variation for Phosphorus Efficiency of Common Bean in Contrasting Soil Types: II. Yield Response. Crop Science, 35, 1094-1099. http://dx.doi.org/10.2135/cropsci1995.0011183X003500040029x
- Miller, C.R., Ochoa, I., Nielsen, K.L., Beck, D. and Lynch, J.P. (2003) Genetic Variation for Adventitious Rooting in Response to Low Phosphorus Availability: Potential Utility for Phosphorus Acquisition from Stratified Soils. Functional Plant Biology, 30, 973-985. http://dx.doi.org/10.1071/FP03078
- CIAT (2000) Inheritance of Low Phosphorus Tolerance in the Andean Population AND696 × G19833. Bean Improvement for the Tropics Unit Annual Report. CIAT, Cali.
- Wortman, C.S., Lunze L., Ochwoh, V.A. and Lynch, J.P. (1995) Bean Improvement for Low Soil Fertility Soils in Africa. African Crop Science Journal, 3, 469-477.
- Lunze, L., Kimani, P.M., Ndakidemi, P., Rabary, B., Rachier, G.O., Ugen, M.M. and Nabahungu, L. (2002) Selection of Bean Lines Tolerant to Low Soil Fertility Conditions in Africa. Bean Improvement Cooperative, 45, 182-183.
- Lunze, L., Abang, M.M., Buruchara, R., Ugen, M.A., Nabahungu, N.L., Rachier, G.O., Ngongo, M. and Rao, I. (2012) Integrated Soil Fertility Management in Bean-Based Cropping Systems of Eastern, Central and Southern Africa, Soil Fertility Improvement and Integrated Nutrient Management—A Global Perspective. Whalen J., Ed., InTech. http://www.intechopen.com/books/soil-fertility-improvement-and-integrated-nutrientmanagement-global-perspective/integrated-soil-fertility-management-in-bean-based-cropping-systems-of easterncentral-and-southern
- Kimani, P., Buruchara, R. and Lubanga, L. (2006) Enhancing the Resilience of Agroecosystems in Central Africa through Improved, Nutrient Dense and Marketable Bean Germplasm Tolerant to Low Fertility Acid Soils. CIALCA Second Planning Workshop, Kigali, 28 August-1 September 2006.
- Namayanja, A., Tukamuhabwa, P., Opio, F., Ugen, M.A., Kimani, P.M., Babirye, A., Kitinda, X., Kabayi, P. and Takusewanya, R. (2003) Selection for Low Soil Fertility Bean Tolerant to Root Rot. Bean Improvement Co-Operative, 46, 95-96.
- PABRA (Pan Africa, Bean Research Alliance) (2007) Narrative Annual Report 2006-2007. http://www.pabra.org/pdfs/AnnualReport
- Bhatt, M. and Chanda, S.V. (2003) Prediction of Leaf Area in Phaseolus vulgaris by Non-Destructive Method. Bulgaria Journal of Plant Physiology, 29, 96-100.
- Vieira, R.F., Carneiro, J.E.S. and Lynch, J.P. (2008) Root Traits of Common Bean Genotypes Used in Breeding Programs for Disease Resistance. Pesquisa Agropecuária Brasileira, 43.
- Murphy, J. and Riley, J.P. (1962) A Modified Single Solution Method for the Determination of Phosphate in Natural Waters. Analytica Chimica Acta, 27, 31-36. http://dx.doi.org/10.1016/S0003-2670(00)88444-5
- Broughton, W.J., Hernández, G., Blair, M., Beebe, S., Gepts, P. and Vanderleyden, J. (2003) Beans (Phaseolus spp.): Model Food Legume. Plant and Soil, 252, 55-128. http://dx.doi.org/10.1023/A:1024146710611
- Ochoa, I.E., Blair, M.W. and Lynch, J.P. (2006) QTL Analysis of Adventitious Root Formation in Common Bean under Contrasting Phosphorous Availability. Crop Science, 46, 1609-1621. http://dx.doi.org/10.2135/cropsci2005.12-0446
- Trindade, R.S., Araújo, A.P. and Teixeira, M.G. (2010) Leaf Area of Common Bean Genotypes during Early Pod Filling as Related to Plant Adaptation to Limited Phosphorus Supply. Revista Brasileira de Ciência do Solo, 34, 115-124. http://dx.doi.org/10.1590/S0100-06832010000100012
- Lynch, J.P., Lauchli, A. and Epstein, E. (1991) Vegetative Growth of the Common Bean in Response to Phosphorus Nutrition. Crop Science, 31, 380-387. http://dx.doi.org/10.2135/cropsci1991.0011183X003100020031x
- Oliveira, A.A.R. (1995) Mycorrhizal Effects on the Growth of Common Bean (Phaseolus vulgaris L.). PhD Thesis, Leeds University, Leeds.
- Radian, J.W. and Eidenbock, M.P. (1984) Hydraulic Conductance as a Factor Limiting Leaf Expansion of Phosphorus- Deficient Cotton Plants. Plant Physiology, 76, 392-394.
- Fredeen, A.L., Rao, I.M. and Terry, N. (1989) Influence of Phosphorus Nutrition on Growth and Carbon Partitioning on Glycine max. Plant Physiology, 89, 225-223. http://dx.doi.org/10.1104/pp.89.1.225
- Rodríguez, D., Keltjens, W.G. and Goudriaan, J. (1998) Plant Leaf Area Expansion and Assimilate Production in Wheat (Triticum aestivum L.) Growing under Low Phosphorus Conditions. Plant Soil, 200, 227-240. http://dx.doi.org/10.1023/A:1004310217694
- Fist, A.J. and Edwards, D.G. (1987) External Phosphorus Requirements of Five Tropical Grain Legumes Grown in Flowing-Solution Culture. Plant and Soil, 99, 75-84. http://dx.doi.org/10.1007/BF02370155
- Brouwer, R. (1962) Nutritive Influences on the Distribution of Dry Matter in the Plants. Netherlands Journal of Agricultural Sciences, 10, 399-408.
- Borch, K., Bouma, T.J., Lynch, J.P. and Brown, K.M. (1999) Ethylene: A Regulator of Root Architectural Responses to Soil Phosphorus Availability. Plant Cell and Environment, 22, 425-431. http://dx.doi.org/10.1046/j.1365-3040.1999.00405.x
- Lynch, J.P. and Brown, K.M. (2001) Topsoil Foraging—An Architectural Adaptation of Plants to Low Phosphorus Availability. Plant and Soil, 237, 225-237. http://dx.doi.org/10.1023/A:1013324727040
- Kim, H.J., Lynch, J.P. and Brown, K.M. (2008) Ethylene Insensitivity Impedes a Subset of Responses to Phosphorus Deficiency in Tomato and Petunia. Plant Cell and Environment, 31, 1744-1755. http://dx.doi.org/10.1111/j.1365-3040.2008.01886.x
- Lambers, H., Finnegan, P.M. and Laliberté, E. (2011) Phosphorus Nutrition of Proteaceae in Severely Phosphorus-Impoverished Soils: Are There Lessons to Be Learned for Future Crops? Plant Physiology, 156, 1058-1066. http://dx.doi.org/10.1104/pp.111.174318
- Jin, J., Tang, C.X., Armstrong, R. and Sale, P. (2012) Phosphorus Supply Enhances the Response of Legumes to Elevated CO2 (FACE) in a Phosphorus-Deficient Vertisol. Plant and Soil, 358, 86-99. http://dx.doi.org/10.1007/s11104-012-1270-z
- Niu, Y.F., Chai, R.S., Jin, G.L., Wang, H., Tang, C.X. and Zhang, Y.S. (2012) Responses of Root Architecture Development to Low Phosphorus Availability: A Review. Annals of Botany, 112, 391-408. http://dx.doi.org/10.1093/aob/mcs285
- Zhu, J. and Lynch, J.L. (2004) The Contribution of Lateral Rooting to Phosphorus Acquisition Efficiency in Maize (Zea mays L.) Seedlings. Functional Plant Biology, 31, 949-958. http://dx.doi.org/10.1071/FP04046
- Zhu, J.M., Kaeppler S.M. and Lynch J.P. (2005) Mapping of QTL Controlling Root Hair Length in Maize (Zea mays L.) under Phosphorus Deficiency. Plant and Soil, 270, 299-310. http://dx.doi.org/10.1007/s11104-004-1697-y
- Pérez-Torres, C.A., López-Bucio, J. and Cruz-Ramírez, A. (2008) Phosphate Availability Alters Lateral Root Development in Arabidopsis by Modulating Auxin Sensitivity via a Mechanism Involving the TIR1 Auxin Receptor. The Plant Cell, 20, 3258-3272. http://dx.doi.org/10.1105/tpc.108.058719
- Liao, H., Rubio, G., Yan, X., Cao, A., Brown, K.M. and Lynch, J.P. (2001) Effect of Phosphorus Availability on Basal Root Shallowness in Common Bean. Plant Soil, 232, 69-79. http://dx.doi.org/10.1023/A:1010381919003
- Williamson, L.C., Ribrioux, S.P.C.P., Fitter, A.H. and Leyser, H.M.O. (2001) Phosphate Availability Regulates Root System Architecture in Arabidopsis. Plant Physiology, 126, 875-882. http://dx.doi.org/10.1104/pp.126.2.875
- Bates, T.R. and Lynch, J.P. (1996) Stimulation of Root Hair Elongation in Arabidopsis thaliana by Low Phosphorus Availability. Plant Cell and Environment, 19, 529-538. http://dx.doi.org/10.1111/j.1365-3040.1996.tb00386.x
- Pérez-Torres, C.A., López-Bucio, J. and Cruz-Ramírez, A. (2008) Phosphate Availability Alters Lateral Root Development in Arabidopsis by Modulating Auxin Sensitivity via a Mechanism Involving the TIR1 Auxin Receptor. The Plant Cell, 20, 3258-3272. http://dx.doi.org/10.1105/tpc.108.058719
- Péret, B., Clément, M., Nussaume, L. and Desnos T. (2011) Root Developmental Adaptation to Phosphate Starvation: Better Safe than Sorry. Trends in Plant Science, 16, 442-450. http://dx.doi.org/10.1016/j.tplants.2011.05.006
- Tyburski, J., Dunajska-Ordak, K., Skorupa, M. and Tretyn, A. (2012) Role of Ascorbate in the Regulation of the Arabidopsis Thaliana Root Growth by Phosphate Availability. Journal of Botany, 2012, 580342. http://dx.doi.org/10.1155/2012/580342
NOTES

*Corresponding author.