Low Carbon Economy
Vol. 4 No. 2 (2013) , Article ID: 32445 , 15 pages DOI:10.4236/lce.2013.42009
Emissions Mitigation Schemes in Australia—The Past, Present and Future
![]()
1Finance Discipline Group University of Technology, Sydney, Australia; 2Department of Applied Finance & Actuarial Studies Macquarie University, Sydney, Australia.
Email: Deborah.Cotton@uts.edu.au, Stefan.Trueck@mq.edu.au
Copyright © 2013 Deborah Cotton, Stefan Trück. This is an open access article distributed under the Creative Commons Attribution License, which permits unrestricted use, distribution, and reproduction in any medium, provided the original work is properly cited.
Received December 15th, 2012; revised January 23rd, 2013; accepted February 22nd, 2013
Keywords: Climate Change Mitigation; Emissions Trading; Carbon Tax
ABSTRACT
Australia was one of the first countries in the world to adopt mandatory emissions trading schemes as part of its emissions mitigation program. To date there have been six states and one federal emissions mitigation schemes. Some state schemes operate in conjunction with other states or the federal scheme and some operate independently. This complex set of regulations and requirements for emitters has led to a deficiency in nationwide coverage with no firm target set for Australia. In July 2011 the Federal Labor Government released details of a carbon tax proposal which was passed by the two houses of Parliament by the end of 2011 and was introduced in July 2012. The Government states that an emissions trading scheme will be introduced in 2015 with a possible link to the European Emissions Trading Scheme (EU ETS). This paper provides a critical overview of Australian responses to climate change, with a particular emphasis on the numerous emissions mitigation schemes.
1. Introduction
Global warming is seen by many as one of the greatest challenges the world faces today. In the 1800’s Fourier [1] discovered that the earth’s atmosphere provided an insulation effect known from that time as the greenhouse effect. Later, Tyndall [2], proved that the greenhouse effect existed by concluding that water vapour was the strongest absorber of radiant heat in the atmosphere. In 1972 the United Nations convened a conference on the Human Environment in Stockholm that was the first major international conference to be held to discuss global environment issues [3]. Twenty years later the United Nations Framework Convention on Climate Change (UNFCCC) was established with the goal of stabilising atmospheric greenhouse gas concentrations. At the Kyoto Conference of Parties (COP) in 1997 it was agreed to reduce overall emissions of six greenhouse gases to around 5% below 1990 levels by 2010 (targets varied for different countries). Australia’s target enabled it to increase its greenhouse gas emissions over the first 5 year commitment period to 108% of their 1990 levels. This protocol was ratified by Australia in 2007 but remains unratified by the USA. The election of Barak Obama, of the Democratic Party, as President of the USA in 2008 saw what appeared to be a clear signal to move forward on the fight against climate change and possibly see them sign the Kyoto Protocol. At the 2009 UNFCCC COP in Copenhagen there were 23 decisions made, however Obama stated that better agreements needed to occur between emerging, least developed and developed countries before a legally binding global agreement on climate change could be made. A new set of targets for the Annex 1 parties, i.e. industrialised countries that were members of the Organisation for Economic Co-operation and Development (OECD) in 1992, was agreed to. Fundamentally, all countries agreed to some reduction in emissions for 2020 however there are many specified conditions. Australia agreed to a 25% cut if there was global agreement to stabilise greenhouse gas emissions to 450 ppm CO2-equivalent (CO2-e) or less, a 5% cut unconditionally or a 15% cut dependent upon global agreement by developing and advanced economies to make a comparable agreement [4]. The dominant condition was that all developed countries commit to comparable levels and that also developing countries contribute adequately.
In 2005 the Chancellor of the Exchequer of the United Kingdom engaged Sir Nicholas Stern to lead a review into the economics of climate change. The Stern Report looked at policy responses for mitigation with eight key messages noted on carbon pricing and emissions markets. They included the need for tax and trading to be used to create an explicit price for carbon and that regulation could create an implicit price. Further it was noted “To reap the benefits of emissions trading, deep and liquid markets and well-designed rules are important. Broadening the scope of schemes will tend to lower costs and reduce volatility. Increasing the use of auctioning is likely to have benefits for efficiency, distribution and potentially the public finances” (Stern, 2006: p.324) [5].
Legislation for pollution control began in Australia in the 1960s and 1970s with different policies associated with land, water and air in most states and nationally. These policies have continued to cover a wider variety of pollution types predominantly through legislation with little contribution from common law over the years [6]. A number of reviews have been undertaken to determine how best to proceed on action against climate change since a task force was set up by the Federal Government in 2006, including reports by Martin Parkinson in 2007 and Ross Garnaut in 2008. The seven differing emission mitigation schemes have led to a complex set of regulations and requirements for emitters and have been seen to lead to an imbalance in coverage and requirements for business. At the 6th Australia-New Zealand Climate Change and Business Conference in 2010 the resounding opinion from all the business sectors was for a clear carbon price to be determined. The general agreement at this conference was that a cut of greenhouse gas emissions by at least 15% by 2020 would be economically beneficial. The companies involved in electricity generation and sales called for certainty in order to plan for the future.
In 2010 the Australian Labor Party’s website stated that “Climate change is the most dangerous long-term threat to Australia’s prosperity. As one of the hottest and driest continents on Earth, Australia’s environment and economy will be one of the hardest and fastest hit by climate change if we do not act.” [7]. The dilemma facing governments, businesses and consumers around the world was summarised by Tietenberg, “The risks of being wrong are clearly asymmetric. If it turns out that we controlled more than we needed, current generations would bear a larger than necessary cost. On the other hand, if the problem turns out to be as serious as the worst predictions indicate, catastrophic and largely ireversible damage to the planet could be inflicted on future generations.” [8]. This level of investigation and the nature of statements made by political parties would seem to indicate the importance of climate change as an issue and would suggest urgent action would be undertaken.
This paper, to our best knowledge, provides the first overview of the Australian responses to international developments addressing climate change with a particular emphasis on the numerous emissions mitigation schemes. It is set out in the following way: Section 2 initially outlines all the emissions mitigation schemes that have been and are currently operating in Australia. It does not endeavour to cover the various subsidies for solar panels and similar schemes as these are both too numerous and in many cases too short term to be included. It does include an overview of the current legislated carbon tax to be followed by an emissions trading scheme. Section 3 discusses some of the major issues to be decided in setting up an appropriate scheme and Section 4 concludes with a look at the possible future perspectives for emissions mitigation in Australia.
2. Australian Emissions Mitigation Schemes
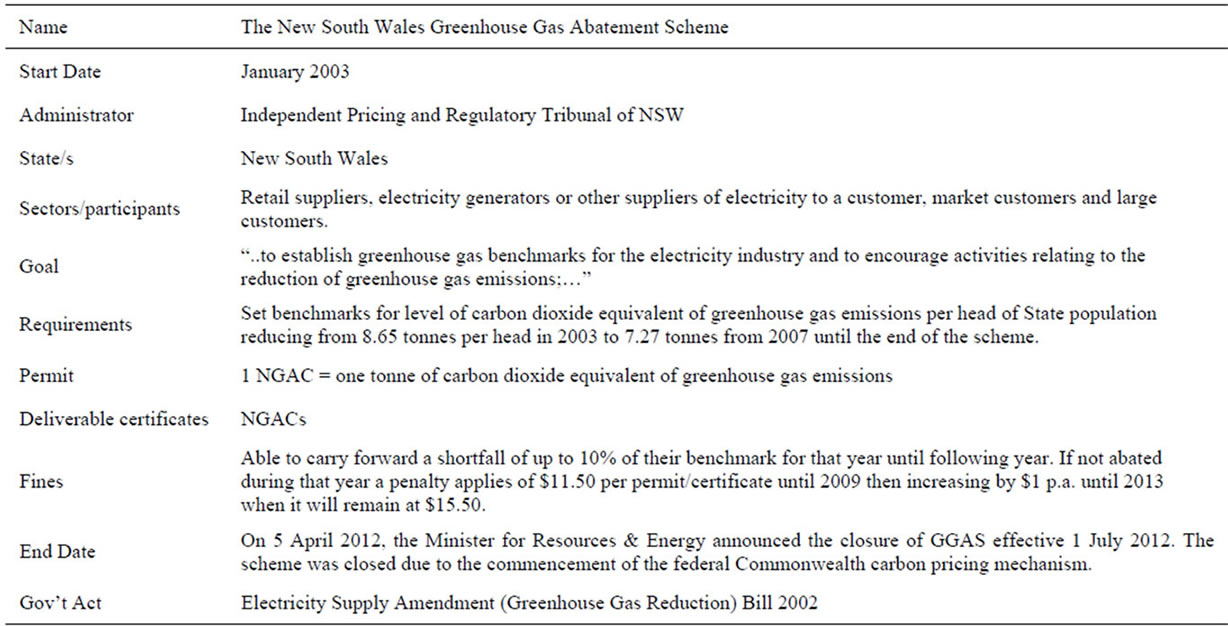
2.1. The New South Wales Greenhouse Gas Abatement Scheme
The New South Wales Greenhouse Gas Abatement Scheme (GGAS) commenced in January 2003 and was one of the first mandatory trading systems in the world. It was introduced under the Electricity Supply Amendment (Greenhouse Gas Emission Reduction) Bill 2002 (ESA Bill 2002) which was passed in the Legislative Assembly on 15 November, 2002 and the Legislative Council on 6 December, 2002 [9]. The Amendment Act was introduced to “amend the Electricity Supply Act 1995 in order to encourage the reduction of greenhouse gas emissions through the use of benchmarks. It was originally planned to continue at least until 2012 however it is uncertain at this time whether or not it will continue past that date. The scheme ceased operation on 30 June, 2012 with the introduction of the carbon tax to be discussed in Section 2.9. The Federal and NSW governments have proposed that they work together to ensure a smooth transition for stakeholders. Certificates not surrendered after meeting compliance for the year to June 30 2012 are still able to be traded and surrendered in the voluntary market.
Section 97B of this amendment sets out the New South Wales greenhouse gas benchmarks in the form of the level of carbon dioxide equivalent of greenhouse gas emission per head of State population [10]. These decreased from 8.65 tonnes per head for the year commencing 1 January 2003 to 7.27 tonnes from 2007 until the end of the scheme. They form the basis for calculating the benchmarks for each of the participants. These include retail suppliers, electricity generators or other suppliers of electricity to a customer, and market customers. The latter are customers who have classified any of their electricity loads as a market load and are registered with the Australian Energy Market Operator (AEMO), formerly the National Electricity Market Management Company Limited (NEMMCO), as a market customer under the National Electricity Code, and large customers who are identified as users of 100 gigawatt hours or more of electricity at one or more sites in New South Wales (Section 97BB ESA Bill 2002). This paper will refer to these participants in a general way as “suppliers” and “large use customers”. The calculation of each participant’s benchmark is done by multiplying the State population by the benchmark allowances of greenhouse gas emissions per head and multiplying this amount by the proportion of total electricity demand in the State applicable to each participant (Section 97BC ESA Bill 2002). Compliance is therefore determined by calculating the megawatt hours of electricity supplied or purchased by the participant and deducting that from the benchmark allowance. Any “greenhouse shortfall” (S97Be ESA Bill 2002) for a year, other than the year commencing 1 January 2007, may be carried forward to the next year. To the extent that this shortfall is not abated by the surrendering of abatement certificates by the participant during the following year they will be subject to a penalty. The participant is not permitted to carry forward more than 10% of their benchmark for that year. The penalties imposed were amended in Section 97CA of the ESA Bill 2006 to be $11.50 per ton of CO2 until end 2009, then increasing by $1 p.a. until 2013 to a maximum of $15.50 in 2013. This was amended in 2012 to a level of $17.00 to be adjusted by the consumer price index thereafter.
Abatement certificates may be created if the person creating them has been accredited and they are in respect of activities or a class of activities that promote greenhouse gas emission reduction. They may also be classed as eligible activities if the activities involve:
1) the generation of electricity in a manner that results in reduced emissions of greenhouse gases.
2) activities that result in reduced consumption of electricity.
3) activities of elective participants, associated with production processes that use electricity in this State, that result in reduced emissions of greenhouse gases” (S97 DA ESA Bill 2002).
Each certificate represents one tonne of carbon dioxide equivalent of greenhouse gas emissions that the activity has abated. Further the rules may allow eligibility for accreditation of carbon sequestration, the process of removing carbon from the atmosphere, through the planting of forests or other means only if it occurs in New South Wales or as approved by the Minister. The abatement certificates can only be received if the activity has not already received a similar certificate from another mandatory scheme. Each abatement certificate must be created immediately after and no later than six months after the end of the year in which the activity it relates to takes place. These certificates remain in force until cancelled by the Scheme Administrator. The Demand Side Abatement component, predominantly the market customers outlined above, of the GGAS ceased on 1 July 2009 becoming incorporated into the Energy Savings Scheme in Section 2.2.
Any accreditation of a person as an abatement certificate provider remains in force until suspended or cancelled by the Scheme Administrator. The Scheme Administrator is the Independent Pricing and Regulatory Tribunal of NSW (IPART). IPART is the independent economic regulator in NSW and they oversee the regulation of the electricity, gas, water and transport industries [11].
There are two types of NSW Greenhouse Gas Abatement Certificates (NGAC), transferable and non-transferable, both in fact may be transferred but require the Scheme Administrator’s approval and must be registered with the Scheme Administrator upon completion of transfer. The register that is kept contains information regarding the name of the person who created the certificate, the current registered owner as well as any previous owners and other relevant information regarding the type of certificate. The creation and cancellation of these certificates is also kept on register as is any transfer of them and may be made available to the public. The trade statistics from the registry, as shown in Table 1, indicate a strong increase in the number of trades and the number of certificates traded since it’s inception in 2004. The last column shows the total number of certificates required to meet abatement compliance obligations for the year. It indicates an increase in the number of NGACs traded relative to the compliance requirements. Compliance has been strong throughout the operation of the GGAS. In a report by the Independent Pricing and Regulatory Tribunal on compliance and operation of the GGAS during 2008, produced in July 2009, it stated that there was a
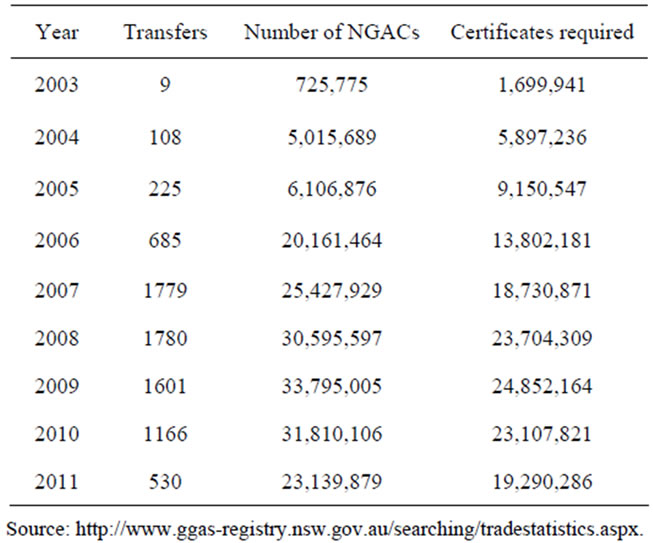
Table 1. NGAC transactions.
Source: http://www.ggas-registry.nsw.gov.au/searching/tradestatistics.aspx.
shortfall of 2.6% in 2003, 1.6% in 2004, 0.9% in 2005, 0.9% in 2006, 0% in 2007 and 0.01% in 2008 [12]. No shortfalls were allowed to be carried forward in 2007to ensure that NSW met the target in line with the Kyoto Protocol. During 2008 three participants carried forward a small shortfall and two paid a small penalty for noncompliance.
This level of trading reveals some efficiency in certificate transfer provided by the scheme. However the number of certificates created relative to the required number for abatement quantifies the oversupply in the market. The number of certificates increased significantly from 2003, indicating the market was able to create more low cost abatement opportunities than was anticipated. It is most notable in 2006-2007 with a number of companies creating certificates by providing energy efficient light bulbs and efficient showerheads.
The fall in price as a result of this in 2007 can be seen in Figure 1 which shows the weekly price, provided by the Australian Financial Markets Association (AFMA), and volumes provided by Next Generation Energy Solutions, which maintain records for over 90% of the market. AFMA data consists of weekly bid and ask quotes from dealers in the carbon markets and the price is taken as the midpoint between these two values. (Volumes prior to 2003 were not available). This fall in price is further discussed in section three of this paper. The graph shows that while prices were relatively stable since the fall in 2007 until the end of 2010 the trading volume shows great variation. As this scheme was known to cease with the introduction of the carbon tax the price has fallen to its lowest levels since inception in a freefall since the middle of 2011.
It was estimated that the GGAS delivered 4.7 million tonnes of concentrated CO2 that would cause the same level of radiative forcing as a given type and concentration of greenhouse gas (CO2-e) abatement in 2010 and that it was the third largest single abatement policy measure [13]. This would indicate a level of success on the part of the scheme with Daley and Edis stating that this scheme, along with the MRET and Qld Gas Scheme, to be discussed, contributed more than 40% of Australia’s
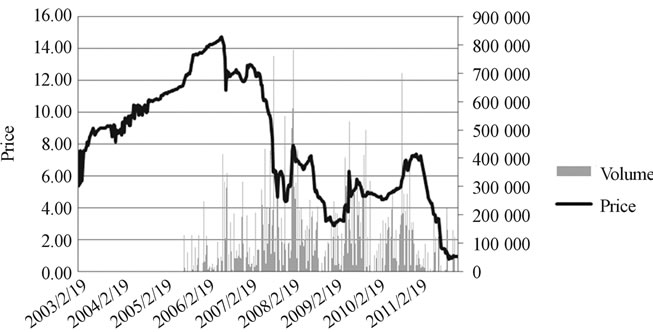
Figure 1. NGAC weekly price and volume.
emissions reductions since 1997. The NGAC abatements were achieved at the lowest cost of these schemes at around $15 to $40 per tonne CO2-e. It produced reductions greater than the legislative requirement in the period 2003 to 2011. However, it should be noted that also other grants, rebates etc. would have contributed to the take up of reduction mechanisms such as more solar energy use by the general public. Only since 2007 has there been a relationship between NGACs and electricity prices with tangible evidence during this period of an increase in investment in renewable energy [14].
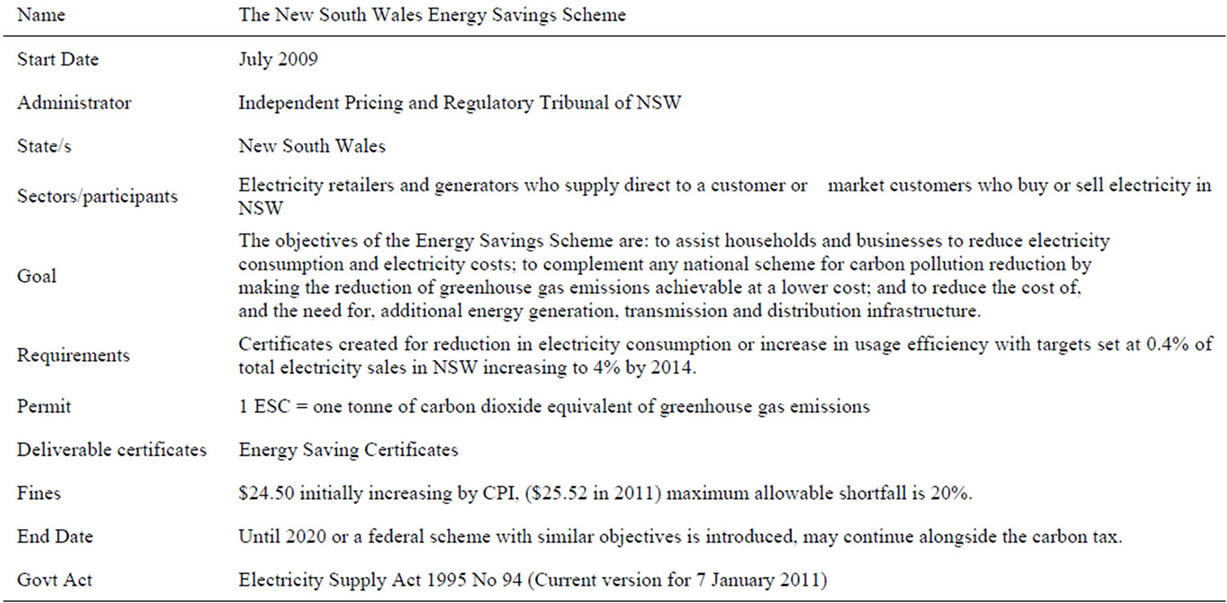
2.2. The NSW Energy Savings Scheme
The NSW Energy Savings Scheme (ESS) was established through the Electricity Supply Act 1995 and is supported by the Electricity Supply (General) Regulation 2001 and two sets of rules, the Energy Savings Scheme Rule of 2009 and the Ministerial Order and Scheme Regulator Exemptions Rule No. 1 of 2009 [15]. The goal is to: “to assist households and businesses to reduce electricity consumption and electricity costs; to complement any national scheme for carbon pollution reduction by making the reduction of greenhouse gas emissions achievable at a lower cost; and to reduce the cost of, and the need for, additional energy generation, transmission and distribution infrastructure.” (Overview, http://www. ess.nsw.gov.au/).
It is estimated the scheme will reduce electricity by 8.5 million megawatt-hours (MWh) in the first four years. It commenced on 1 July 2009, taking over from the Demand Side Abatement component of the GGAS, and was developed to complement the Federal Government’s proposed Carbon Pollution Reduction Scheme (CPRS). As noted in Section 2.1 this will now be a carbon tax and the ESS is to continue alongside this tax. It is planned to continue operation until 2020 or until a Federal scheme is introduced with similar objectives. The Scheme is regulated by IPART.
Scheme participants include electricity retailers and generators who supply direct to a customer and market customers who buy or sell electricity in NSW. Energy Savings certificates (ESCs) are created for activities which reduce electricity consumption or increase electricity usage efficiency. The initial targets for participants were 0.4% of total electricity and will increase to 4% in 2014. The allocation for participants is in proportion to their liable electricity sales. Penalties for non-compliance are $24.50 per ton of CO2-einitially and may increase by changes in the consumer price index. The maximum allowable shortfall is 20% except for the first year, when participants may have a shortfall of up to 50%.There had only been one year’s compliance results at the time of writing. A total of 289,118 ESCs were required to meet obligations and only 148,928 were surrendered. Most achieved at least the minimum level required for the first year with their balances being carried forward to 2010. Penalties were paid equivalent to 347 ESCs. Some of the shortfall was attributable to Jackgreen International Pty Ltd, an electricity retailer, which went into voluntary administration in December, 2009 and was suspended from trading.
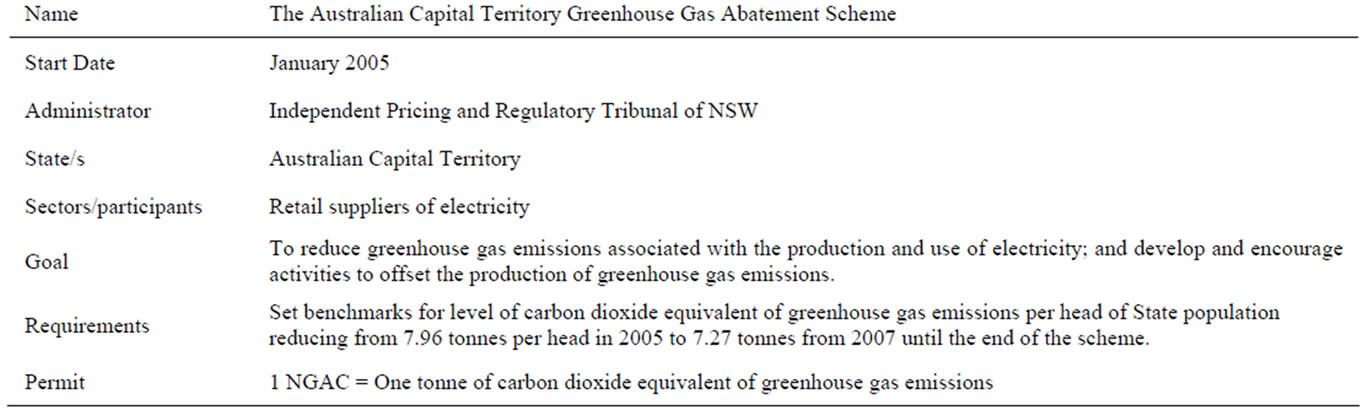
2.3. The Australian Capital Territory Greenhouse Gas Abatement Scheme
The Australian Capital Territory Greenhouse Gas Abatement Scheme (ACT GGAS) commenced operation on 1 January 2005 and is legislated under the Electricity (Greenhouse Gas Emissions) Act 2004. It began with the same design as the NSW GGAS scheme and effectively mirrored it until 20 June 2009. In November 2007 the scheme was extended from finishing in 2012 to run until 2020. In line with the NSW GGAS it establishes targets for greenhouse gas emission reductions for the benchmark participants, at this stage it only applies to retail suppliers of electricity but may include large electricity users in the future. The targets are the same as the NSW scheme as discussed in Section 2.1 of this paper. Like the NSW Scheme, the NSW IPART is the scheme administrator. Also like the NSW scheme it ceased operation on 30 June 2012 with the introduction of the carbon tax.
The Independent Competition and Regulatory Commission states in its overview of the ACT GGAS that abatement certificates may be created by [16]:
• “reducing the greenhouse gas intensity of electricity generation;
• Generating low emission intensity electricity;
• Demand-side abatement activities which involve reducing consumption, or increasing the efficiency of the consumption of electricity; or
• Carbon sequestration activities.”
The compliance rules also closely mirror the NSW scheme with penalties assigned to those who fail to meet their benchmarks. Both NGACs (from NSW and ACT) and Renewable Energy Certificatess (see Section 2.5) can be submitted to meet obligations however they must be in respect to electricity generation and demand in the ACT. For the 2010 year all liable entities submitted their required abatement certificates with none electing to carry forward until 2011. The number of abatement certificates has increased since inception from 312,377 in 2005, 202,724 in 2006, 398,276 in 2007, 675,534 in 2008, 743,151 in 2009, with a reduction in 2010 to 543,006 due to a reduced demand for electricity.
2.4. Queensland 13% Gas Scheme
The Queensland Gas Scheme commenced in 2005 with a goal to expand the Queensland gas industry and reduce greenhouse gases. In order to achieve this, the scheme had initially targeted13% of electricity to be sourced from gas from 2006 onwards. This has increased to 15% and may reach a target of 18% by 2020. It operates under the Electricity Act 1994 and the administrator is the Chief Executive of the Department of Mines and Energy. The Scheme’s certificate creators include accredited generators who generate electricity from natural gas, coal seam gas, liquefied petroleum gas and waste gasses. Liable parties are electricity retailers and end use customers who purchase electricity for consumption in Queensland. One Gas Electricity Certificate (GEC) is equal to one megawatt hour (MWh) of eligible electricity generated. If insufficient GECs are surrendered there is a penalty which commenced at $11.50 per tonne CO2 increasing by the CPI, in 2010 it was $13.13 [17].
In 2010, 32 of 37 liable parties surrendered sufficient GECs to meet their requirements. Of the five who did not meet their requirements four paid the fines and one failed to submit a report, a default assessment and civil penalty was given to this participant. The Annual Report in 2010 stated that gas-fired generation has increased by an additional 672 MWh in 2009. As at 1 September, 2010, a surplus of 4,741,326 live certificates was available to meet future liabilities. Figure 2 below shows the increase in registered, surrendered and live certificates up until the end of 2010. The scheme would have transitioned into the CPRS however due to the postponement of the CPRS and legislated carbon tax it is not yet clear what transition will occur. It will continue to operate with the 15% target until a federal scheme commences, possibly in 2015. This scheme has reduced abatement by 2.2 million tonnes in 2010 with an anticipated level of 4.3 million tonnes in 2020 if it were still in operation [14].
2.5. Mandatory Renewable Energy Target Scheme
The Mandatory Renewable Energy Target Scheme (MRET) is the only Australia-wide scheme operating at this time, with discussion currently underway for a new Federal scheme which will be outlined later in this section. It commenced on 1 April 2001, prior to Phase I of
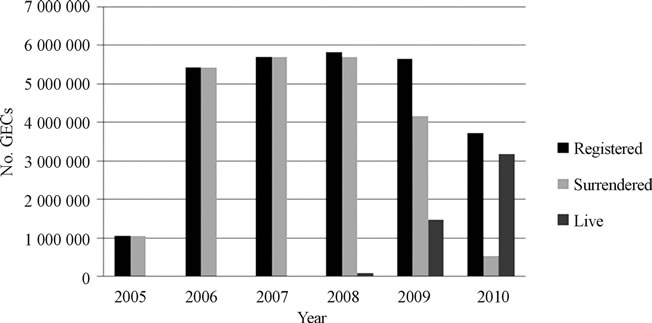
Figure 2. GEC summary.
the European Emissions Trading Scheme which commenced operation in January 2005. The MRET was introduced under the Renewable Energy (Electricity) Act 2000 and applies from January 2001 to January 2021. The goal was to encourage additional generation of electricity from renewable energy resources and thereby reduce greenhouse gas emissions, and to ensure that renewable energy sources are ecologically sustainable with the aim to generate 9500 GWh of extra renewable energy by 2010 [18]. It is seen as an important complement to the newly introduced carbon tax.
Trading in Renewable Energy Certificates (REC) is over the counter and one REC is equal to one MWh of electricity. Renewable sources of electricity include hydro, wave, tide, ocean, wind, solar and various types of waste. Certificates may be created for each whole MWh of electricity generated by the power station from these renewable sources that is above the baseline amount required. The installation of solar water heaters creates certificates for the owner of the heater at the time of the installation. All created certificates must be registered by the Renewable Energy Regulator before being able to be traded under the MRET. The liable entities include suppliers and wholesale buyers of more than 100 MWh of electricity [19]. The scheme administrator is the Office of Renewable Energy Regulator (ORER). The number of certificates required to be surrendered under the scheme is determined by calculating the Renewable Power Percentage (RPP) for the year and multiplying it by the total electricity acquired under relevant acquisitions during the year. The RPP is calculated by the following formula:
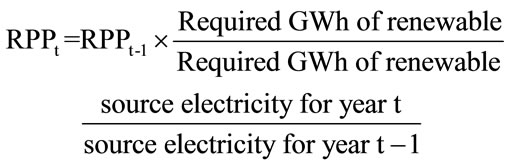
The initial RPP was 0.24% for 2001 and the required amounts change from year to year. The required gigwatt-hours (GWh) of renewable source electricity increased from 300 in 2001 to 9500 in 2010. Legislation to implement an expanded national Renewable Energy Target Scheme (RET) was passed on 20 August 2009. The original Act, under which the MRET was implemented, the Renewable Energy (Electricity) Act, was enhanced by the Renewable Energy (Electricity) Amendment Act 2009 (Commonwealth Amendment Act). The goal of the new Federal Government-implemented RET is to deliver on the Government’s commitment to ensure that 20 per cent of Australia’s electricity supply will come from renewable sources by 2020. This goal is a targeted growth of over four times the current goal to 45,000 GWh in 2020. The commodity name and equivalence in MWh of electricity generation remains the same at one REC equal to 1MWh. The Office of Renewable Energy Regulator remains the regulator of the Scheme.
Renewable energy shortfalls incur a charge if the amount is 10% or more for the year, otherwise they may be carried forward to the next year. In addition to the charge of $40 per MWh shortfall, the whole amount must be made up over the next three years. Registered RECs can be voluntarily surrendered—this effectively removes the RECs from the market thereby further reducing the level of greenhouse gas emissions.
Compliance has been high throughout the scheme’s operations and in the most recent annual report suggests that compliance has ranged from 92.3% in 2001 to 99% and above for all subsequent years. The scheme achieved greater reductions in greenhouse gas emissions than its legislative requirement for 2001 to 2010 [14]. Also worth noting is that not all shortfalls resulted in the payment of the penalty of $40/MWh, as shortfalls within 10% of the total requirement are carried forward and added to next year’s target [20]. Table 2, using data from the annual reports, shows the number of transfers and the number of RECs traded from 2001 through to 2010. The last column indicatesthe number of certificates required to meet the Renewable Energy Target in MWh each year. It shows an increase in thenumber of RECs traded relative to the target levels for compliance from around 1:1 to approximately 5:1.
Figure 3 displays the weekly price and volume for the RECs from the beginning of 2003 through the end of 2010 after which time the splitting of the RECs into the large and small scale certificates occurred as discussed below. There has been relatively steady volume with some areas of volatility which mostly appear to be related to changes in legislation and the uncertainty that this reflects. Similar to the NGACs, there is no statistically significant relationship between volume and the price of RECs. Figure 5 also shows the fall in prices in 2007 similar to the NGACs due to the oversupply of certificates.
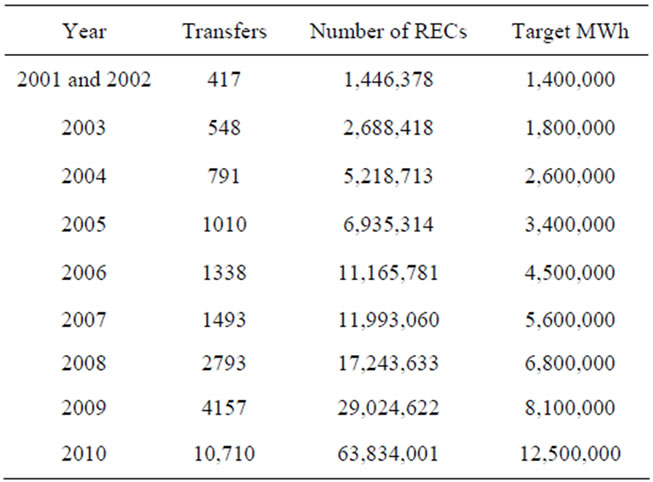
Table 2. REC Transactions from 2001 to 2010.
On 26 February, 2010 the Government announced further changes to the scheme. The revisions, as explained in the Department of Climate Change website, were “to provide greater certainty for households, large-scale renewable energy projects and installers of small-scale renewable energy systems like solar panels and solar water heaters”. They entail separating the targets for large scale renewable energy projects from small-scale ones. This change should ensure that the 45,000 GWh target is met even if the uptake on small scale projects is less than expected. The Large Scale Renewable Energy Target (LRET) allows the liable entities to meet their obligations with projects covering large-scale renewable energy projects like wind farms, commercial solar and geothermal energy. It will operate in a similar way to the MRET. The Small-scale Renewable Energy Scheme (SRES) allows small-scale technology certificates (STCs) to be created by small-scale technologies like solar panels and solar water heaters. The STCs will commence at a value of $40 and the price will be monitored over time to ensure it remains appropriate. The SRES is a voluntary arrangement and has no cap on the amount of STCs created.
Figures 4 and 5 show the weekly prices and volumes for both schemes in 2011. The LREC price has remained high with volumes reducing over the year, indicating the higher cost of reductions in emissions. STCs show a more volatile price and much higher levels of volume, an indication of the greater ease of certificate creation as discussed with the NGACs.
The targets for these large scale projects are shown in Table 3, including the original and amended levels. The amended levels include the anticipated 4000 GWh p.a. from the SRES and the increasing levels from the LRET.
Daley and Edis found that this scheme produced annual reductions in 2010 of 8.8 million tonnes of abatement with an estimated level of 29.9 million tonnes in 2020. This is achieved at the relatively low cost of $30 to $70 per tonne CO2-e [14].
2.6. Victorian Renewable Energy Target Scheme
The Victorian Renewable Energy Target Scheme (VRET) was enacted under the Victorian Renewable Energy Act 2006 which was passed on 19 September, 2006 and commenced operating on 1 January, 2007. The goal was to increase electricity generated from renewable energy
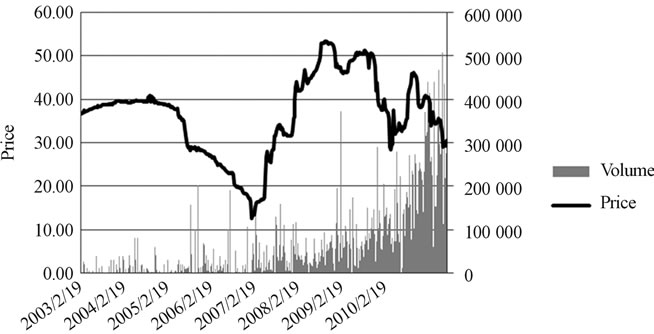
Figure 3. REC weekly price and volume.
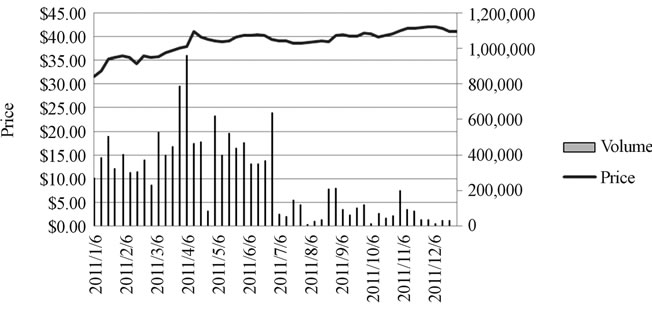
Figure 4. LRET certificates weekly price and volume.
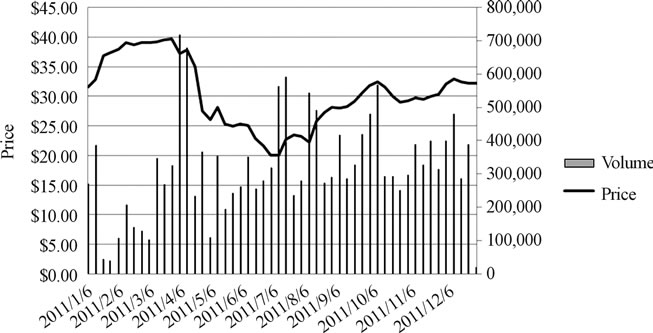
Figure 5. STC weekly price and volume.
sources to10% by 2016. Coverage included all electricity retailers and large wholesale purchasers of electricity in Victoria.
Interim annual targets were set to ensure consistent progress towards achieving the 3274 GWh target by 2016 to ensure that all of the investment does not occur in the final years of the scheme. The Essential Services Commission of Victoria was responsible for registering persons, accrediting renewable energy power stations, maintaining registers, overseeing the creation, registration, transfer and surrender of the Victorian Renewable Energy
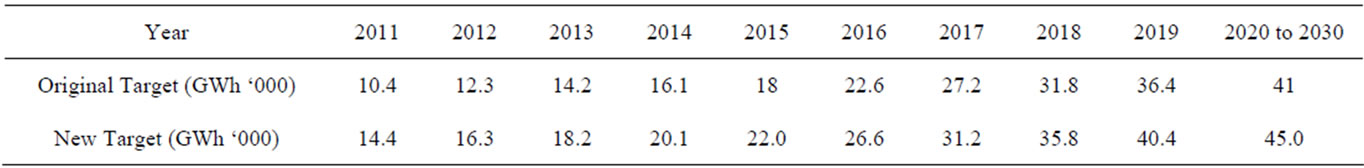
Table 3. Required GWh of renewable source electricity.
Certificate (VREC), imposing penalties, conducting audits and monitoring compliance with the [21].
Each VREC represents one MWh of eligible renewable electricity. VRECs can be created:
• for small generation units—after the unit is installed, or
• for accredited power stations—for renewable energy electricity generation utilising scheme capacity.
In the first year of operation (2007) there were no liability targets applied, however relevant entities were required to submit an audited statement. All twenty-one entities submitted their reports. In 2008 there was a shortfall of Renewable Energy Certificates surrendered of 67,200. This shortfall was incurred byten entities with a total penalty paid of $2,950,080 as detailed in the Victorian Renewable Energy Target Scheme Annual Report 2008. In December 2008 the Victorian Government agreed to transition the VRET into the new RET, discussed above in Section 2.5. Therefore 2009 was the final year of VRET obligations by the participants in the scheme. Three entities encountered a shortfall obliging them to pay a penalty of $74273.85. An amount of $11,083.59 of this was associated with Jackgreen (International) Pty Ltd which went into voluntary liquidation [22].
2.7. The Victorian Energy Efficiency Target Scheme
The Victorian Energy Efficiency Target Scheme (VEET) was established through the Victorian Energy Efficiency Target Act 2007 and is supported by the Victorian Energy Efficiency Target Regulations 2008. The goal is to: “to promote the reduction of greenhouse gas emissions by establishing the VEET scheme which: 1) provides for the creation and acquisition of energy efficiency certificates and 2) requires the surrender of energy efficiency certificates.” (The Victorian Energy Efficiency Target Act 2007, Part 1, Section 1) [23]
It commenced on 1 January 2009 with a target of reducing greenhouse gas emissions by 2.7 million tonnes per annum during its first three year phase increasing to 5.4 million in the second three year phase. The three year phases are planned to continue until 2029. The scheme aims to achieve this by placing a requirement on large Victorian electricity retailers, known as relevant entities, to surrender a specified number of energy efficiency certificates (VEECs) each year. These certificates may be created or purchased in the market with each certificate representing one tonne of greenhouse gas abated.
The Scheme is maintained by the Department of Primary Industries with administration through the Essential Services Commission [24]. There were 14 relevant entities for the 2011 years who all surrendered a sufficient number of VEECs to acquit their liabilities for the period. For the first three year period 8,058,781 VEECs were surrendered meeting the legislated requirements for the schemes target.
2.8. Carbon Pollution Reduction Scheme
The Carbon Pollution Reduction Scheme (CPRS) was passed by the House of Representatives on 4 June 2009. The Bill’s aim was to give effect to Australia’s obligations under the Climate Change Convention and the Kyoto Protocol and, in general, support an effective global response to climate change. It was a cap and trade scheme which was set to commence at a price of $10 per tonne CO2-e greenhouse gas emissions. The number of emission permits issued would have been capped by the Australian Government in order to ensure greenhouse gas emissions would reduce over time to achieve the target levels. Some of the permits would have been auctioned and others directly allocated to businesses [25].
According to the scheme, Australia would unconditionally reduce its emissions by 5 per cent compared with 2000 levels by 2020 and would reduce its emissions by 15 per cent by 2020 if there was an international agreement where major developing economies commit to substantially restrain emissions and advanced economies take on commitments comparable to Australia’s. The coverage would broadly include persons who are responsible for greenhouse gas emitted from the operation of a facility, who import, manufacture or supply synthetic greenhouse gas and who import, produce or supply eligible upstream fuel. They must surrender equivalent eligible emissions units. There would be a cap which limits the total number of auctioned emissions units, which would generally be transferrable, most of which would be issued through an auction.
The Bill was then put to the Australian Senate twice in 2009 and was rejected on both occasions. The 2010 version of the Bill with amendments went to the Senate on 24 February 2010 but was adjourned until the next sitting. The government continued to indicate that it would go to the next sitting and remained committed to commencing the scheme in 2012. However this did not eventuate with the Government stating in April 2010that it had been dropped from the most recent four year estimates in the next budget. Resources Minister Martin Ferguson told Radio National on 27 April 2010 that it was clear that there was not enough support to pass the legislation [26]. Further he indicated that the lack of any significant progress at the UNFCCC in Copenhagen meant that it would be preferable to reassess the CPRS after the end of the Kyoto Protocol’s first commitment period at the end of 2012.
2.9. Carbon Tax
In September 2010 the Federal Government established the Multi-Party Climate Change Committee to explore options for implementing a carbon price to mitigate climate change. This committee was made up of members of the current Federal Labor Government, independents and the Australian Greens Party. No members of the Liberal Opposition were included in the committee. On 10 July 2011 the Government released details of the plan proposed by the committee in a document called the Clean Energy Agreement [27]. The Clean Energy Bill 2011 was passed in the House of Representatives on 12 October and the Senate on 8 November, 2011. The proposal was for a carbon tax which was implemented on 1 July, 2012.
It was initially suggested that the carbon price would be set through a tax being levied on approximately 500 of the largest carbon polluting companies in Australia. However, the list of liable entities that was released in June 2012 included only a total of 294 liable entities. The list contains companies that produce 25,000 tons of CO2-e emissions each year such that most major power stations, mines and heavy industry will have to pay the tax. Also a number of local government areas, in total 34 councils, will require emissions permits, in particular those with a population greater than 20,000 and those that own landfills.
The tax has been set at $23 per tonne and will rise by 2.5% p.a. in real terms to $24.15 for the 2013-14 financial year and $25.40 for the 2014-15 financial year, until 30 June 2015, when the price will be set by the market in an emissions trading scheme. The scheme is administered by a new authority, the Clean Energy Regulator (CER), which issues units known as carbon units. In the first three years in which the market is setting the price there will be a floor price of $15. This will increase by 4% p.a. in real terms and a ceiling price of $20 above the likely international price will increase at 5% p.a. in real terms.
As part of the scheme, assistance has been provided to households who may be affected by increased costs through e.g. pension increases, allowances and family payments and income tax cuts. There will also be a Jobs and Competitiveness Program supporting local jobs and production and a Clean Technology Program to assist the manufacturing sector. Further a Clean Energy Finance Corporation (CEFC) will be established to drive innovations in clean energy and the Australian Renewable Energy Agency will coordinate and support research and development in new renewable energy technologies. The target of the scheme is to ensure that 20% of Australia’s electricity comes from renewable energy by 2020.
The current plan under the Governments’ Clean Energy Future is for the carbon tax to transition into an emissions trading scheme on 1 July 2015. This is likely to be based on the CPRS however these details are as yet undecided. It is also proposed that this emissions trading scheme to be linked to an international carbon market or markets at this time. Early discussion has indicated this is likely to be the EU ETS however again this is as yet undecided.
3. Key Issues in Emissions Mitigation Schemes
One of the most important issues in any emissions mitigation scheme is the method of permit allocation, which in general may be referred to as auction versus grandfathering. Grandfathering, where emitters areal located free permits in relation to their historical requirements, is to ensure that no company is overly burdened with the expense of reducing their emissions and to ensure that they are able to continue in business while reducing the emissions. This allocation method is dominant in US sulphur trading, the longest running scheme of this type. It is simple and popular with emitters, partly as it enables them to participate in the allocation process but also it may give some current emitters windfall profits. Another advantage for them is that new entrants may be disadvantaged as it is based on past emissions therefore new entrants in, e.g. electricity production, will have difficulty producing evidence of a requirement for permits. This requirement significantly reduces their competitiveness. It may also create perverse incentives to overestimate requirements; the base year chosen will affect this possible incentive.
Auctioning where emitters buy permits means there is no compensation for emitters. It is seen to be transparent and efficient. A further benefit of auctioning is that it is possible for auction revenues to enter general government revenue and ideally to reduce the costs of greenhouse gas emissions on the community. It has also been suggested that over-allocation under grandfathering was the major cause of the fall in EU-ETS prices in April 2006 and the fall in the NGACs in 2007. Betz and Misato [28] in their analysis of lessons learnt from the EU-ETS suggest that higher levels of auctioning or the tightening of rules for new entrants and closure will ensure an efficient marketplace. In Phase III of the European Union Emissions Trading Scheme (EU-ETS) the level of auctioning will increase from around 3% to at least 50% [29].
Another issue to consider is whether the scheme would follow a cap and trade approach, which is where a fixed amount of emissions allowances are allocated. In this case penalties are set for noncompliance. The cap provides not only an incentive to comply but also caps the cost of compliance and therefore adds to the certainty provided by the scheme. It enables a maximum cost to be incorporated into the investors’ compliance calculations. A “make-good” provision may be required, where if permit holders exceed their permit holdings at the end of the compliance period they have not only to pay the penalty but also to surrender the appropriate number of permits from their next years’ allocation or purchases. The EU-ETS uses large fines and industries have to make up the missed emission reductions in the next year of the scheme. Early in the scheme they were allowed additional allowances if they had unusually high emissions if these were due to a “force majeure” or act of God. Other schemes, such as in the US, use make up provisions but not necessarily on a one to one basis. For example the over the counter regional sulphur trading program is on a three to one basis [30].
Banking allows participants to bank excess permits from current allowances for use in future years when it is anticipated abatement costs will be higher. The decision whether to allow this or not from an environmental perspective is not a problem as climate change is caused by an accumulation of greenhouse gases, not so much from the timing of their dispersion into the atmosphere. However this feature is an important consideration when it has an impact on prices and liquidity. The EU-ETS allowed banking in the first phase but banking between phases was at the discretion of the member states [31]. The complementary side to banking is the ability to borrow permits from the future—which is a far more contentious issue due to the risk that they may never be repaid. Some borrowing has been allowed in EU-ETS and in the USA. The NSW GGAS allows a limited shortfall providing it is made up the following year.
4. Future Perspectives
There remain climate change sceptics, however, the overriding evidence continues to indicate climate change is a real issue. The UNFCCC website states that human activity has increased the thickness of the blanket of greenhouse gases around the earth resulting in an increase in the global temperatures. This increase has and will continue to alter the complex systems that allow life to continue on earth. Specifically, levels of cloud cover, rainfall, wind and ocean currents are affected which contribute to changes in the distribution and survival of plant and animal species. While predictions of the level of changes in the climate system vary considerably, they all seem to forecast extreme weather conditions including frequent flooding and disruptions to food and water supplies.
Australia can be seen to have been attempting to address the issues associated with climate change for over ten years and was one of the earliest instigators of an emissions trading scheme. Appendix 1 outlines the emissions mitigation schemes in operation to date. The Australian approach has differed between states without an overall nationwide perspective. The Australian National Greenhouse Accounts for the September quarter of 2011 show an annual decrease of 1% [32]. Much of this was due to a reduction in electricity generation emissions by 3.8%, in part due to a reduced demand caused by a mild winter. There was also a decrease in fugitive emissions due to flooding in Queensland which reduced coal mining activity. Transport and stationary energy emissions increased during this year, reducing the benefits of the abovementioned reductions. Some of the states have made serious inroads into managing carbon emissions however they appear to be floundering under the uncertainty of what is to come from any proposed CPRS. Likewise, continued global uncertainty stems from a lack of real commitments being made at any of the COPs.
Economically, emissions trading schemes have the ability to provide a fair and transparent way to reduce emissions. The level and cost of abatement by some of the schemes has been discussed in Section 2 while Section 3 outlines many of the issues pertaining to the appropriate type of scheme to introduce. The nature of these issues, and debate about how widespread the schemes’ coverage should be, complicate and consequently contribute to the delay of a global response. Passey et al. [33] state that “Poorly designed emissions trading schemes could delay meaningful action.” The continued response by high emitting nations that they are unwilling to reduce emissions unless there is a fair reduction made by others also may result in a continuation of global inaction.
The highly political nature of climate change action has slowed progress towards an optimal solution in Australia. The former leader of the main federal opposition party was changed due in part to his stance on climate change as was the previous leader of the incumbent party. The current Federal Government is dependent upon Independents and Australian Greens Party representatives in order to remain in power. This has not only limited their policyoptions but has potentially over-complicated its road to an appropriate policy. Australia has achieved the target emissions set by the Kyoto Protocol to date with an increasing surplus over the past four years. The relative success of the existing emissions trading schemes in Australia has not given rise to the introduction of a Federal Scheme. However it is likely that the introduction of a Federal scheme in the form of a carbon tax will pave the way for the development of more complete and effective policy implementations via the CPRS in the future.
REFERENCES
- J. B. J. Fourier, “Memoir sur les Temperatures du Globe Terrestreet des Espacesplanetaires,” Memoires de l’Acadeémie Royale des Sciences, Vol. 7, 1827, pp. 569-604.
- J. Tyndall, “On Radiation through the Earth’s Atmosphere,” Philosophical Magazine, Vol. 25, No. 170, 1863, pp. 200-206.
- United Nations Environment Program, “Declaration of the United Nations Conference on the Human Environment,” 1972. http://www.unep.org/Documents.Multilingual/Default.asp?documentid=97&articleid=1503
- United Nations Framework Convention on Climate Change, Copenhagen Accord, “Information Provide by Annex 1 Parties Relating to Appendix 1 of the Copenhagen Accord, Appendix 1, Quantified Economy-Wide Emissions Targets for 2020,” 2010. http://unfccc.int/home/items/5264.php
- N. Stern, “The Stern Review of the Economics of Climate Change,” Cambridge University Press, Cambridge, 2006.
- G. Bates, “Environmental Law in Australia,” 5th Edition, Butterworths, Australia, 2005.
- Australian Labor, “Climate Change Plan,” 2009. http://www.alp.org.au/where-we-stand/climate-change-plan
- T. Tietenberg, “Environmental Economics and Policy,” 5th Edition, Addison-Wesley Educational Publishers Inc., USA, 2007.
- New South Wales Government, “Introduction to the Greenhouse Gas Abatement Scheme,” 2006. http://www.greehousegas.nsw.gov.au
- NSW Greenhouse Gas Abatement Scheme Registry, “Trade Statistics,” 2007. http://www.ggas-registry.nsw.gov.au/searching/tradestatistics.aspx
- Acuiti Legal, “Overview of the NSW Greenhouse Gas Abatement Scheme; Prepared for Independent Pricing and Regulatory Tribunal,” Sydney, 2003. http://www.acuiti.com.au
- Independent Pricing and Regulatory Tribunal of NSW, “Compliance and Operation of the NSW Greenhouse Gas Reduction Scheme 2009 Report to the Minister,” 2010. http://greenhousegas.nsw.gov.au/documents/SchRep09.pdf
- J. Daley and T. Edis, “Learning the Hard Way: Australia’s Policies to Reduce Emissions,” Grattan Institute Report No. 2011, 2011.
- D. Cotton and S. Trück, “Interaction between Australian Carbon Prices and Electricity Prices,” Australasian Journal of Environmental Management, Vol. 18, No. 4, 2011, pp. 208-222. doi:10.1080/14486563.2011.625597
- Independent Pricing and Regulatory Tribunal of NSW, “Introduction to the Energy Savings Scheme,” 2010. http://www.ess.nsw.gov.au/
- Independent Competition and Regulatory Commission, “Overview of the ACT Scheme,” 2009. http://www.icrc.act.gov.au/actgreenhousegasabatementscheme
- Queensland Government, “Queensland Gas Scheme 2008 Liable Year Annual Report,” 2009. http://www.dme.qld.gov.au/zone_files/13percent/qgs_2008_annual_report.pdf
- Office of the Renewable Energy Regulator, “Office of the Renewable Energy Regulator, Increasing Australia’s Renewable Electricity Generation,” Annual Report 2008, Australian Government 2009. http://www.orer.gov.au/publications/pubs/2008-administrative-report.pdf
- Office of the Renewable Energy Regulator, “MRET: The Basics,” 2010. http://www.orer.gov.au/publications/mret-overview.html
- Australian Greenhouse Office, “Renewable Opportunities: A Review of the Operation of the Renewable Energy (Electricity) Act 2000,” Australian Greenhouse Office, 2003. http://www.mretreview.gov.au/report/index.html
- Allens Arthur Robinson, “Victoria to Introduce a Renewable Energy Target,” Melbourne, 2004. http://www.aar.com.au
- Essential Services Commission, “Victorian Renewable Energy Target Scheme Annual Report 2008,” 2009. http://www.esc.vic.gov.au/public/VRET
- “Victorian Energy Efficiency Target Act 2007, No. 70 of 2007, Version Incorporating Amendments as of 1 January 2012.” http://www.legislation.vic.gov.au/Domino/Web_Notes/LDMS/PubStatbook.nsf/f932b66241ecf1b7ca256e92000e23be/1474BEF614D8AEB0CA2573AE00156D7C/$FILE/07-070a.pdf
- Victorian Energy Efficiency Target, “Essential Services Commission.” https://www.veet.vic.gov.au/Public/
- Australian Government, “Carbon Pollution Reduction Scheme: Australia’s Low Pollution Future: White Paper,” 2008. http://www.climatechange.gov.au/whitepaper
- A. Kirk, “Labor Shelves Emissions Scheme,” ABC News, 2010. http://www.abc.net.au/news/stories/2010/04/27/2883282.htm
- The Parliament of the Commonwealth of Australia, “Clean Energy Bill 2011, Exposure Draft (28/7/11),” 2011. http://www.climatechange.gov.au/government/submissions/clean-energy-legislative-package/~/media/publications/clean-energy-legislation/exposure-draft-clean-energy-bill-2011-pdf.pdf
- R. Betz and M. Sato, “Emissions Trading: Lessons Learnt from the First Phase of the EU ETS and Prospects for the Second Phase,” Climate Policy, Vol. 6, 2006, pp. 351-359.
- Department of Energy and Climate Change, “EU ETS Phase III (2013-2020).” http://www.decc.gov.uk/en/content/cms/emissions/eu_ets/phase_iii/phase_iii.aspx
- National Emissions Trading Taskforce., “Possible Design for a National Greenhouse Gas Emissions Trading Scheme,”(2006. http://www.emissionstrading.nsw.gov.au
- Pew Center on Global Climate Change, “The European Union Emissions Trading Scheme (EU-ETS) Insights and Opportunities,” 2005. http://www.greenhouseinfo.nsw.gov.au
- Department of Climate Change and Energy Efficiency, “Australian National Greenhouse Accounts,” September Quarter 2011, 2011.
- R. Passey, I. MacGill and H. Outhred, “The Governance Challenge for Implementing Effective Market-Based Climate Policies: A Case Study of the New South Wales Greenhouse Gas Reduction Scheme,” Energy Policy, Vol. 36, No. 8, 2008, pp. 3009-3018(2008). doi:10.1080/14486563.2011.625597
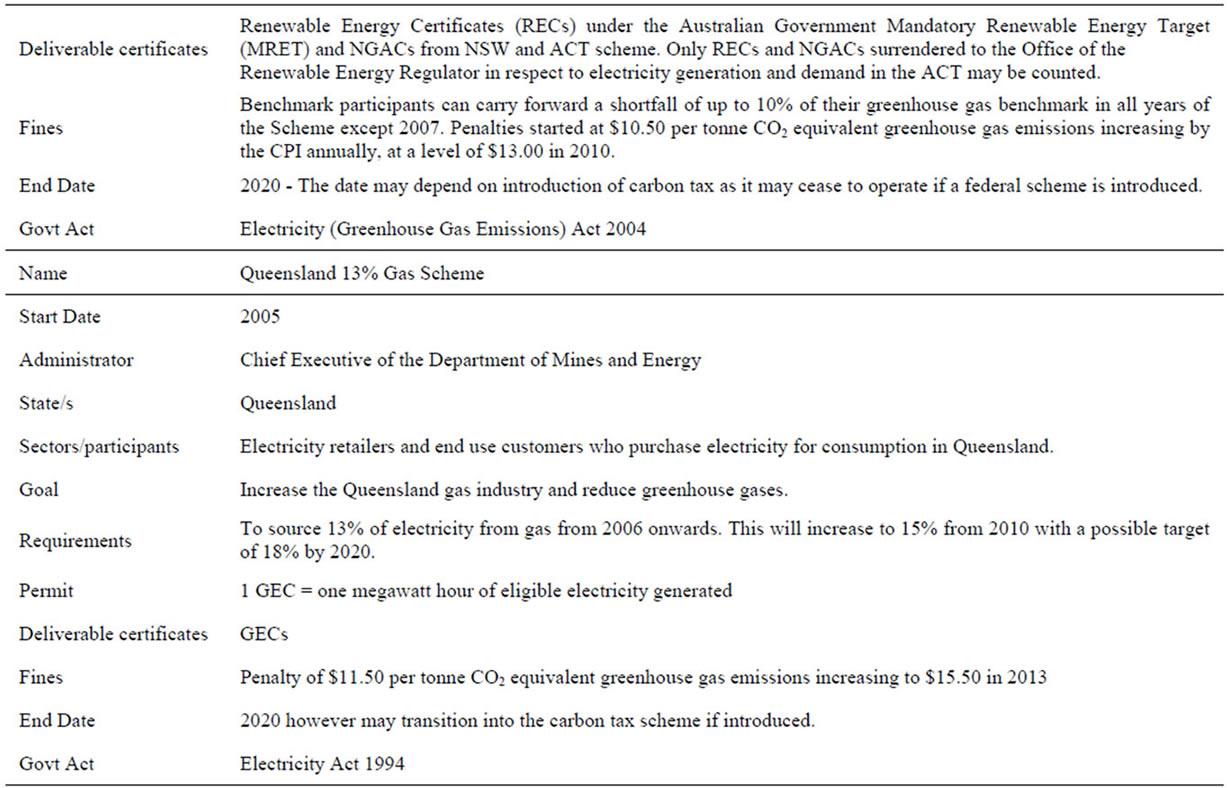
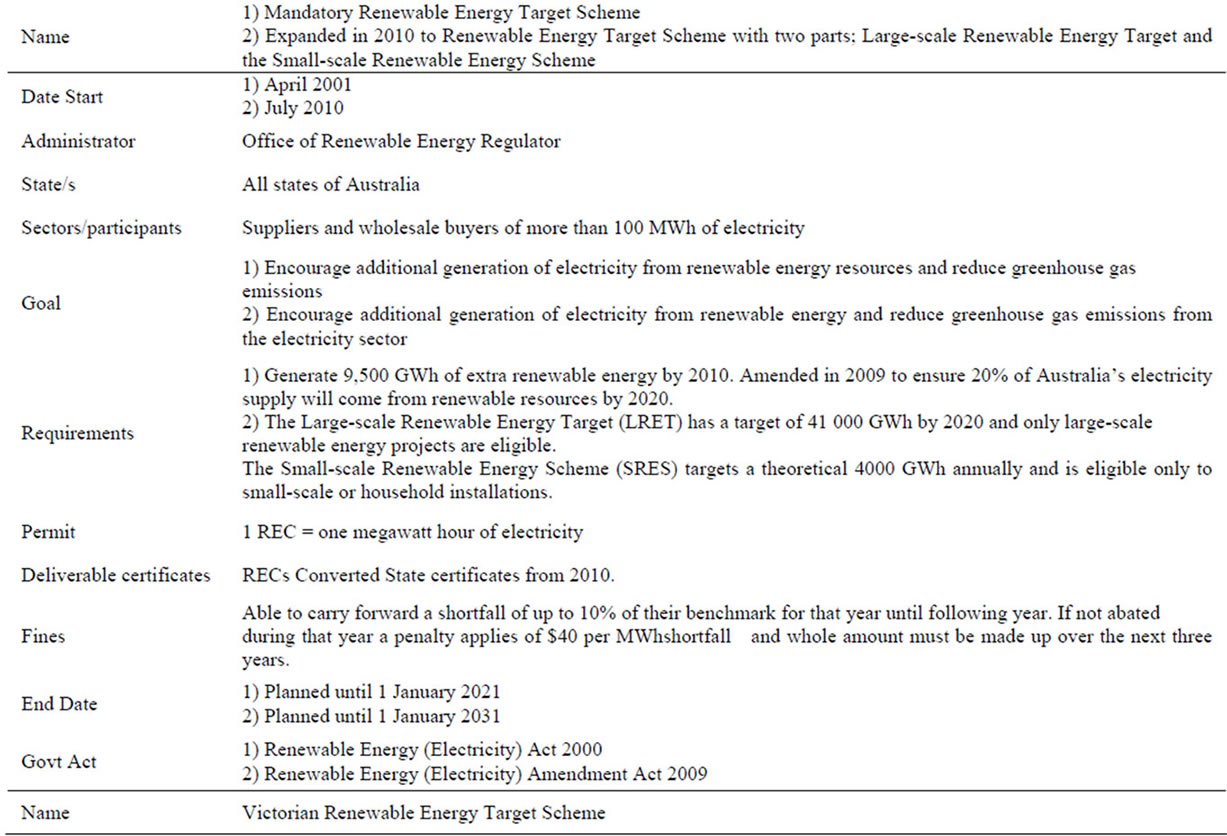
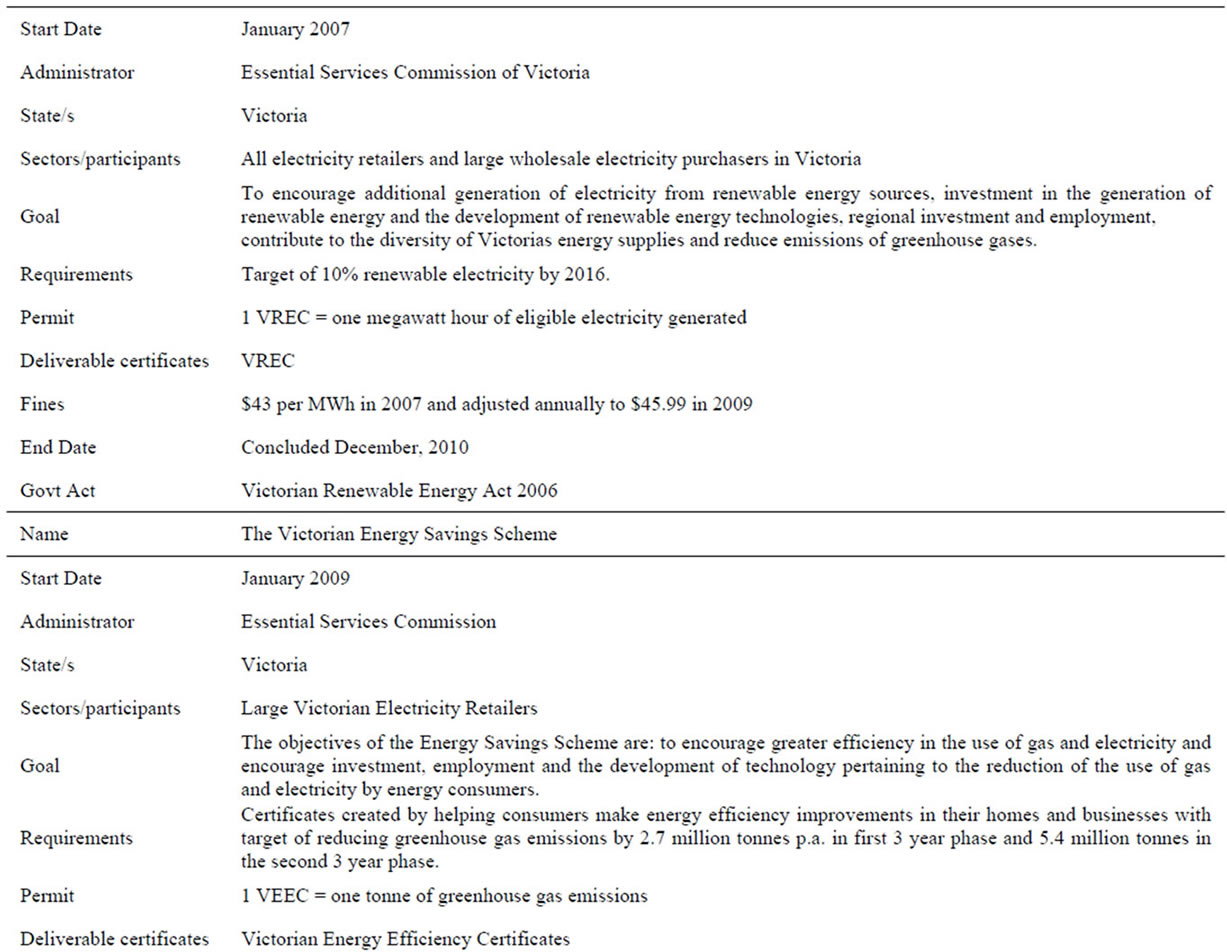
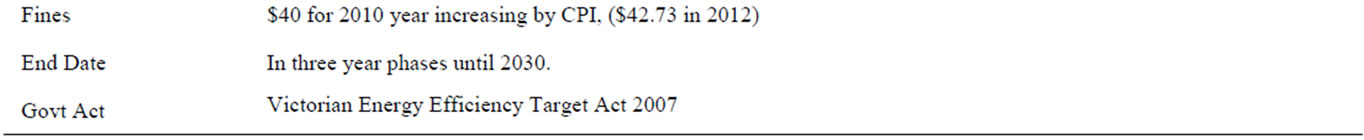
Appendix 1. Summary Table of Australian Emissions Mitigationschemes