International Journal of Geosciences
Vol.5 No.5(2014), Article ID:45486,8 pages DOI:10.4236/ijg.2014.55048
Geographic Information Technologies for the Study of Mass Wasting Hazards
Henry Pacheco, Carlos Suárez
Universidad Pedagógica Experimental Libertador, Instituto Pedagógico de Caracas, Departamento de Ciencias de La Tierra. Centro de Investigación “Estudios del Medio Físico Venezolano”, Venezuela
Email: henrypacheco@gmail.com, carturo7982@yahoo.es
Copyright © 2014 by authors and Scientific Research Publishing Inc.
This work is licensed under the Creative Commons Attribution International License (CC BY).
http://creativecommons.org/licenses/by/4.0/


Received 23 January 2014; revised 22 February 2014; accepted 19 April 2014
ABSTRACT
The purpose of the research was to obtain the mass wasting hazard map for the state of Vargas, central coast of Venezuela, using GIS technology. The work was developed through the heuristic method with the generation of thematic digital maps, univariate statistical treatment, weighting of each variable and quantifying the relationship of each parameter unit regarding mass wasting processes. The algorithm designed to perform map algebra was designed using the variables: surface geology, slope, slope orientation, terrain curvature, moisture topographic index, power index surface flow rate and capacity sediment transport and the rate normalized difference vegetation. The results show a distribution of landslide hazard with the highest values in the west central part of Vargas state, where the dominant lithology is incompetent, and combined with topographic elements, determining high instability, meanwhile the lower hazard areas were found in specific areas such as the middle watershed areas east of the state. The calibration of this model shows a reliability of 80%, so it is highly advisable to use the information generated in this work by governmental and non-governmental organizations in the planning, management and use of land.
Keywords:Mass Wasting Hazards, GIS, Vargas State, Venezuela

1. Introduction
Venezuela is a country subjected to a high number of natural hazards, and it is evidenced by the occurrence of geological events such as earthquakes in 1812, 1967 and 1997 that affected the eastern, central and western parts of the country, and other hazards as hurricanes, tropical storms, meteorological troughs, and cold fronts, which have led to problems of landslides and flooding with over 300 years of historical records . The most recent adverse event that affected much of the Venezuelan territory with many damages was in the months of October to December 2010.
The populations most affected by these events are concentrated in the Andean states and the North Central Coast region of the country. These densely populated areas require urgent attention in relation to the Integrated Risk Management, which can only be achieved with a thorough understanding of the causes, the spatial distribution of adverse events and the response mechanisms that the population manifests at a given moment.
To study these processes, currently there exists a variety of approaches, representing the spatial analysis of susceptibility mapping a support of much use, so that mapping and models necessary and management of these from Geographic Information System (GIS) is a fundamental part - . This paper develops the heuristic method via multivariate statistical analysis, combining thoroughly to evaluate the factors that determine the instability of the slopes, as well as detonating agents of mass movement processes, since it highlights the use of technology geographic information, or as recently called Geomatics.
Currently, effective planning of land use employs technologies such as Geographic Information System (GIS), Systems Digital Image Processing, Global Positioning Systems, Digital Cartography and Remote Sensing products for the development of different applications in Geosciences. Geomatics concerns with the measurement, representation, analysis, management, retrieval and display of spatial data related with the physical characteristics of the Earth and the structure of the environment . Geomatics has its foundations in engineering surveying but today encompasses a wide range in the areas of measurement science and spatial information systems.
References - indicate that the proliferation of space-based sensors and aerial remote sensing, coupled with the constant improvement of its tools analysis and technical progress of digital image processing, influences in that Geomatics makes is becoming an important complement geotechnical techniques, geodetic, geophysical and photo interpretation in the recognition and control of the landslide phenomena in areas extensive.
The main objective of this research was the generation of a mass wasting map of the northern slopes of the Massif Avila, central coast of Venezuela, using Geographic Information Systems. The map scale work was 1:25000, however for practical purposes the physical maps are presented on a reduced scale.
2. Methodological Aspects
The methodology used to analyze the Mass Wasting Hazards (MWH) can be summarized in the following steps:
• Selection of study areas
• Acquisition of data and information
• Data analysis
• Susceptibility map design
• Calibration of the results
2.1. Selection of Study Areas
The study area was selected in response to the criteria of social responsibility that must involve all scientific research work, in order to provide information that results in improving the quality of life of the inhabitants of a given region. In this sense, the northern slopes of the Massif Ávila are important because it is an area whit the largest population of the state, which has been seriously affected by mass wasting processes over 300 years of historical records.
2.2. Acquisition of Data and Information
2.2.1. Collection and Digitization of Spatial Information
The information for this study was obtained of the following variables: surface geology, slopes, slopes orientation, curvature terrain, Topographic Moisture Index, Power Flow Index, Capacity Transportation Index, and Normalized Difference Vegetation Index (NDVI). The selection of these variables was based on their contribution to the genesis of mass wasting processes, according to the theoretical approaches, empirical models and experiences in other regions, and their availability.
The information was obtained from various sources, such as Avila Project—Hazard Map of Venezuelan Geographic Institute “Simón Bolívar” (IGVSB), and the Only Authority Vargas State, National Institute of Geology and Mining (INGEOMIN) and remote sensing products such as aerial photographs and satellite imagery.
The digital and analogical information was georeferenced with software applications designed to work in GIS environment, using the datum of origin of each map, the geologic and topographic maps are designed with the datum La Canoa, while the satellite images used the WGS-84 datum, later each map was reprojected to a common datum, using applications and transformation parameters available in commercial software as ARCGIS, ERDAS and MapInfo.
2.2.2. Geology
The surface geology map shows the interrelationship between the geological characteristics of the structures and lithology, taken from the “Avila Project—Risk Map” [11] Figure 1.
2.2.3. Topographic Information: Digital Elevation Model (DEM)
The Digital Elevation Model (DEM) (Figure 2) was prepared by interpolation of the Venezuela topographic map of scale 1:25000, which dates from 1979. This map is set in rectangular sheets of 7.5' × 5' of arc, with contours spaced every 20 m, generated by photogrammetric restitution. The maps of the study area was scanned, creating a raster image then was vectored through digitized directly on the screen, creating a vector layer lines of the contour curves, from which the DEM was interpolated into a raster grid resolution of 30 m.
2.2.4. Hydrological Analysis
Preparation of DEM: the DEM depressions were removed to calculate the various hydrological variables. With

Figure 1. Surface geology.
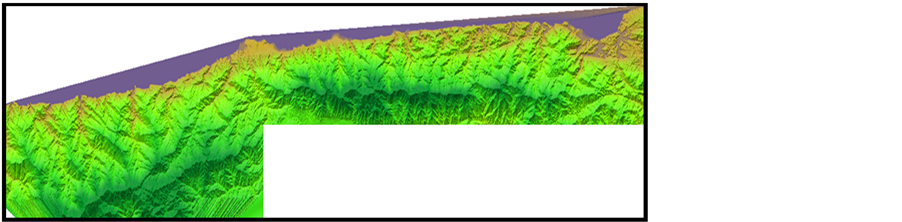
Figure 2. Digital Elevation Model (DEM).
the application of the model TOPMODEL was generated the hydrological information from the topography [12] [13] , in this sense [14] [15] reported the possibilities of software SEXTANTE, which has features a preprocessing module that eliminates depressions or alternatively define the flow behavior in the depressions, then operate and calculate variables required for the analysis. It is important to highlight the usefulness of the DEM in many hydrological applications, especially with the potential of generating them using various space technologies [5] [16] -[18] . Directly from the model was generated the tilt and orientation of the slope and terrain curvature, while the other layers were generated with additional applications of the software.
2.2.5. Flow Direction
In this case the potential of the software was used to determine the direction of flow in each cell of the DEM, for it is considered that the direction in which the flow of water on a surface produces the maximum downward slope in each 3 × 3 cell. The end result is an array of angles or directions similar to a map of orientations, each pointing to the neighboring cell in which the maximum gradient occurs.
2.2.6. Accumulated Flow
The cumulative flow in each cell is the value of the upstream surface of the cell that accumulates throughout the flow, so equivalent to a watershed. In sextant there are seven methods of calculation, from the classic one-dimensional flow, with flow direction between the centers of the cells or free-flow direction. For the present study the method that worked best was the Kinematic Routing Algorithm ( KRA) , a unidimensional model with free flow of water around the DEM. from this information other layers of interest were generated with the options of Raster Calculator module ARCGIS Spatial Analyst. The variables obtained with the equations are reflected in Table 1.
2.2.7. Map Algebra
The final step for obtaining the mass wasting hazard map is the combination of all the factors involved in its development. The following variables were selected following the criteria [19] -[22] . This combination was achieved by overlaying maps and analysis multi-criteria which contain the variables of interest, using specific tools of the software, for this case the algebra of maps was used considering the established weighting obtained in the matrix analytic hierarchy through the following algorithm.

where: MWH = Mass Wasting Hazard; LU = Lithodemic Units; TS = Tilt Slope; SO = Slope Orientation; TC = Terrain Curvature; TMI = Topographic Moisture Index; STCI = Sediment Transport Capacity Index; PSFI = Power Surface Flow Index; NVDI = Normalized Vegetation Difference Index.

Table 1. Variables and equations to generate the layers of the map of mass wasting hazards.
2.2.8. Model Calibration
For purposes of model calibration the hazard map was crossed with the inventory map that contained information of the disaster event of December 1999. This procedure was performed with the intention of verifying whether the areas with the highest number of mass movements of the event of 1999 matches the areas of greatest mass wasting hazard generated by the model.
3. Analysis and Discussion of Results
3.1. Spatial Distribution of Mass Wasting Processes in December 1999
Figure 3 is a product of an classified LANDSAT image April 2000 monitoring that shows the distribution of mass movements (red) in an altitudinal strip between 1000 and 1500 m, coinciding with the lithodemic units: Avila metamorphic Association, San Julian Complex, Peña de Mora augengeis, Nirgua amphibolites, Serpentinite, Caruao meta tonalite, Naiquatá metagranite, Tacagua shale and Antímano marble, which theoretically have a different resistance to erosion. This seemingly contradictory situation can be justified considering the influence of other factors such as vegetation, concentration of rain storms, the optimal rainfall, etc.
3.2. Engineering Geological Conditions
The predominant rocks of the region are metamorphic rocks, mainly schist and gneiss, foliated and jointed [23] . The geologic factor was one of the principal controls in the occurrence of mass movements in the region; [24] mentioned than “in locations where the direction of steeply dipping foliation of the schist and gneiss is towards an open slope face, conditions are favorable for sliding”.
The weathering of the rocks and the steep mountain slopes favors landslides and debris flows during intense rains, like December 1999.
The human activities increased the disaster risks in the area [25] [26] . The constructions were made in active alluvial fans and in river narrow canyons located at the piedmont of the mountain, this fact amplified the vulnerability of the settlements.
3.3. Analysis of the Mass Wasting Hazard Map
Figure 4 shows than the maximum values of mass wasting hazard are distributed mainly in the west central part of the Vargas state, in identifiable altitudinal strip in the middle and lower sections of the basin between the Cerro Grande and Anare rivers in east-west direction, then from this basin and in the same direction appears a high value of the hazards which extends to the river Mamo, west of Simón Bolívar International Airport, in this latter river is striking the contrast between the slopes of the tributary creek called Guanape , which has on its eastern side a much smaller presence of the hazards compared to the west side. The above asymmetric situation to the slopes of the Guanape river is due to the influence of local factors where the slope orientation and terrain curvature appears to be determinants.
In the west of Mamo is notable the abundance of high hazard in the lower parts of the basins of Carimagua
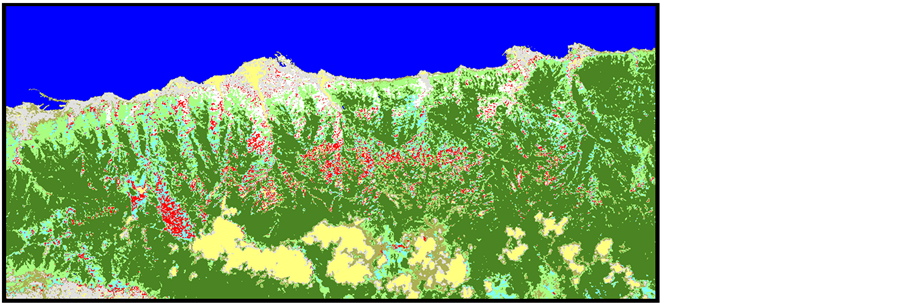
Figure 3. Map of mass wasting hazard, obtained from a LANDSAT image, April 2000.

Figure 4. Zonification of mass wasting hazard.
and Picure rivers, while in the Oricao river the situation is considerably different, because in the lower basin the hazard becomes very scarce, while the upstream sector again shows very high hazards values, then, to the west of the rivers Chichiriviche and Limon appears values of high hazard in all sectors of the basin.
The explanation of the distribution of the hazard should focus on the parameters defining the attitude of the rocks to generate mass movements, so it is necessary to study the different lithological units that characterize the rocky substrate of the study area, the characteristics of the rocks that make up a particular outcrop can be definitive for the purposes of the stability of a slope.
Considering the above approach, it should be noted that the lithology present in the study area together with hydrological, climatological, geomorphological and geotechnical conditions promotes a scenario that anticipates an adverse event, as both the bottom and in the middle of the basins studied outcrops of metamorphic rocks found specifically by schist foliated texture type are presented, indicating the susceptibility of these planes of weakness in presenting and generate different erosion impellers of this kind of threat , on the other hand, one of the abundant and present in this type of rock is the mineral graphite, which on contact with water acts as an excellent natural lubricant that helps generate threat.
The geotechnical characterization indicates that the shales present in the lower parts pf the watersheds have folded micaceous parallel bands representing areas of weakness which act as a lubricant to the distorting efforts, these areas are subject to frequent landslides due to high foliation rocks; still important to note that this foliation allows water to get between the rocks and create processes that help hydration weathering and erosion of materials.
Another important geotechnical aspect highlighted by [27] are the angles of internal friction of the materials, which range between 12˚ and 18˚ generating instability where the slopes are greater than 25˚, the situation is worse where the slopes are modified by unplanned constructions.
The spatial distribution of the values of high mass wasting hazard occurs where the dominant lithology is incompetent, composed of quartz mica schists on which deep levels develop weathering (residual soils of sandy clay type) and to a lesser extent is presented on competent rock masses with a high degree of fracturing, being the dominant structure the foliation planes that cause an unfavorable orientation to the slope stability [23] . Additionally, in the basins are located certain fault patterns indicating that the study area is tectonically active. Meanwhile the hazard low values can be locate in specific areas, such as the sectors of the middle catchments east of the Vargas state, and in Chuspa, La Sabana, Todasana and Caruao rivers.
To explain the presence of these low mass wasting hazard values it is necessary to review each of the thematic layers incorporated in the calculation algorithm.
One maps that explains better the values found of hazard is the surface geology, with the influence of the lithodemic units Caruao Metatonalite, Metadiorite of Todasana, Peña de Mora Augengneis and San Julián Complex; it is important to remark than the low levels of hazard in the high river basins Los Caracas, Anare, Camuri Grande, Naiguata, are related to the presence of the lithodemic units Naiguata Meta Granite and Caruao Meta tonalite, and in the upper part of the Limón river basin where it outcrops the unit of Colonia Tovar Gneiss, all of these rocks are rocks are resistant to the processes of mass wasting because have a mineralogy with certain resistance to weathering processes [23] .
Another factor that probably influences in the low values of hazard found in the area is the Normalized Vegetation Difference Index which shows than the highest values coincide quite well with the areas identified as having very low hazard. The high values of this index are indicative of the presence of thick and vigorous vegetation which in theory can provide good protection to the soil and influence the slopes stability.
In the upland areas of the watershed are forested areas with big trees and deep roots while in medium zones the vegetation is small, indicating that probably the soil in the high areas is protected by this vegetation. The big vegetation type could overhead the slopes and coupled with exceptional rainfall generate rapid soil saturation of the soil and landslides.
The low values of hazard in the middle part of Piedra Azul basin should be related to topographic factors evidenced in the slope distribution maps, and with convex terrain curvature than too decreases the erosion processes.
The rest of the hazard map shows medium values than can be observed in east Naiguata river basin and west of Mamo river, this indicate the combined influence of all the factors involved.
The most significant control factors of the area appear to be the high susceptibility of the lithology to erosion and rocks fracturing ant the dominant morphodynamic processes are associated with water runoff than promotes mass movements as slides, slumps and debris flows.
4. Conclusions and Recommendations
• The great proliferation of space remote sensing and airborne sensors as well as software, coupled with the constant improvement of its applications and the progress of the analysis techniques makes that the Geomatics is increasingly becoming an important complement to the geotechnical, geodetic, and geophysical techniques and photo-interpretation to recognize and control the mass wasting hazard over large areas, such as the central section of the Cordillera de la Costa of Venezuela. This research permited generating thematic layers of great influence in the genesis of mass wasting processes derived from topographical, hydrological, topographic wetness index , the power of overland flow and the ability to sediment transport.
• The integration of remote sensing techniques with GIS has developed models from the analysis of northern basins of the Cordillera de la Costa and Venezuelan Andean Mountain. It is important to remark that the location of the events of 1999 matches more than 80% with areas of high hazard defined for the Vargas state.
• The maximum values of mass wasting hazard are mainly distributed in the west central part of the Vargas state, in a clearly identifiable altitudinal strip in the middle and lower sections of the watershed. In general it can be said that the spatial distribution of the values of high hazard occurs where the lithology—augengneis and schist—is susceptible to weather, combined with other topographic elements as slope and terrain curvature.
• It is highly recommended to use the information generated in this work by governmental and non-governmental-related management and land use, planning and implementation of activities aimed at risk reduction activities and the consequent improvement of the quality of life of the population.
• It is also recommended further development related to the implementation of geographic information technologies in the study of natural hazards to validate methodologies applicable to the whole Venezuelan territory, in order to generate updated and detailed cartography, useful research in making decisions regarding the use of resources and planning for the development of activities consonant with the geo-environmental characteristics of ecosystems.
References
- Singer, A., Rojas, C. and Lugo, M. (1983) Inventario nacional de riesgos geológicos: Estado preliminar, mapa, Glosario y comentarios. Fundación Venezolana de Investigaciones Sismológicas, Departamento de Ciencias de La Tierra, Caracas.
- Abarca, O. (2010) Desarrolllo de un modelo de geoprocesamiento para la valoración productiva y tributaria de tierras agricolas en Venezuela. Tesis Doctoral, Universidad Politecnica de Madrid. E.T.S. De Ingenieros en Topografía Geodesia y Cartografía.
- Tucker, G. and Hancock, G. (2010) Modelling Landscape Evolution. Earth Surface Processes and Landforms, 35, 28- 50. http://dx.doi.org/10.1002/esp.1952
- Scheidl, Ch. and Rickenmann, D. (2010) Empirical Prediction of Debris-Flow Mobility and Deposition on Fans. Earth Surface Processes and Landforms, 35, 157-173.
- Van Westen, C.J., Rengers, N. and Terelien, J. (2007) Prediction of the Occurrence of Slope Instability Phenomena through GIS-Based Hazard Zonation. Geologische Rundschau, 86, 404-414. http://dx.doi.org/10.1007/s005310050149
- Hidrográfica (2007) ¿Qué es la Geomática. [Documento en línea] Disponible. http://members.tripod.com/hidrografica/geomatica.htm
- Hervás, J. and Rosin, L. (1996) Landslide Mapping by Textural Analysis of Daedalus ATM Data. 11th Thematic Conference on Applied Geologic Remote Sensing, Las Vegas, ERIM, Vol. 2, 394-402.
- Aguilar, R., Rodríguez, J. and Rodríguez, J. (2009) Sistema de Solicitud de Imágenes de LPAIS. MAPPING INTERACTIVO. Revista Internacional de Ciencias de La Tierra. Abril-Mayo No. 32.
- Chang, T. and Chao, R. (2006) Application of Back-Propagation Networks in Debris Flow Prediction. Engineering Geology, 85, 270-280. http://dx.doi.org/10.1016/j.enggeo.2006.02.007
- Chiverrell, R., Foster, G., Thomas, G. and Marshall, P. (2010) Sediment Transmission and Storage: The Implications for Reconstructing Landform Development. Earth Surface Processes and Landforms, 35, 4-15. http://dx.doi.org/10.1002/esp.1806
- Instituto Geográfico de Venezuela Simón Bolívar/Ministerio del Ambiente y de los Recursos Naturales (2002) Proyecto Ávila, Mapa de Riesgos: Geología, escala 1:25.000. Autor, Caracas.
- Beven, K. and Kirkby, M. (1979) TOPMODEL User Notes. Windows Version 97.01. Lancaster University, UK. http://www.es.lancs.ac.uk/hfdg/freeware/hfdg_freeware_top.htm
- Beven, K. and Kirkby, M. (1997) TOPMODEL: A Critique. Hydrological Processes, 11, 1069-1085 http://earth.boisestate.edu/home/jmcnamar/hydanalysis/Notes/topmodel_beven.pdf
- Abarca, O. and Bernabé, M. (2008) Desarrollo metodológico para la simulación hidrológica de caudales de estiaje con el SIG SEXTANTE. MAPPING INTERACTIVO. Revista Internacional de Ciencias de La Tierra.
- Olaya, V. (2007) Fundamentos de Análisis Geográfico con SEXTANTE. http://campusvirtual.unex.es/cala/cala/course/view.php?id=146
- Wheaton, J., Brasington, J., Darby, S. and Sear, D. (2010) Accounting for Uncertainty in DEMs from Repeat Topographic Surveys: Improved Sediment Budgets. Earth Surface Processes and Landforms, 35, 136-156.
- Yang, Q.K., McVicar, T.R., Van Niel, T.G., Hutchinson, M.F., Li, L.T. and Zhang, X.P. (2007) Improving a Digital Elevation Model by Reducing Source Data Errors and Optimising Interpolation Algorithm Parameters: An Example in the Loess Plateau, China. International Journal of Applied Earth Observation and Geoinformation, 9, 235-246. http://dx.doi.org/10.1016/j.jag.2006.08.004
- NASA (2009) The Shuttle Radar Topography Mission (SRTM). Información en Linea: Disponible. http://www2.jpl.nasa.gov/srtm/
- Svoray, T. and Ben-Said, S. (2006) Soil Loss, Water Ponding and Sediment Deposition Variations as a Consequence of Rainfall Intensity and Land Use: A Multi-Criteria Analysis. Earth Surface Processes and Landforms, 35, 202-216.
- Roa, J. (2007) Estimación de áreas susceptibles a deslizamientos mediante datos e imágenes satelitales: Cuenca del río Mocotíes, estado Mérida-Venezuela. Revista Geográfica Venezolana, 48, 183-219.
- Sampaio, E. (2006) Modelagem espacial dinâmica aplicada ao estudo de movimentos de massa em uma região da serra do mar paulista, na escala de 1:10.000. Universidade Estadual Paulista. Instituto de Geociências e Ciências Exatas. Tese de Doutorado.
- Rafaelli, S. (2006) Paisaje erosivo en cuencas de montaña. Modelación con extrapolación espacial ascendente. Tesis de Doctorado en Ciencias de La Ingeniería. Universidad Nacional de Cordova. Facultad de Ciencias Exactas, Físicas y Matemáticas, 196.
- Urbani, F., Rodríguez, J., Barboza, L., Rodríguez, S., Cano, V., Melo, L., Castillo, A., Suárez, J., Vivas, V. and Fournier, H. (2000) Geología del estado Vargas, Venezuela. [Documento en DC]. En Seminario Internacional Los Aludes Torrenciales de Diciembre 1999 en Venezuela, Caracas. Disponible: Seminario Internacional Los Aludes Torrenciales de Diciembre 1999 en Venezuela, Jornadas de Investigación de la Facultad de Ingeniería 2000. Universidad Central de Venezuela, Facultad de Ingeniería, Instituto de Mecánica de Fluidos.
- Wieczorek, G., Larsen, M., Eaton, L., Morgan, B. and Blair, J. (2001) Debris-Flow and flooding Hazards Associated with the December 1999 Storm in Coastal Venezuela and Strategies for Mitigation. US Geological Survey, Open File Report 01-0144.
- Takahashi, T., Nakagawa, H., Satofuka, Y. and Kawaike, K. (2001) Flood and Sediment Disasters Triggered by 1999 Rainfall in Venezuela; A River Restoration Plan for an Alluvial Fan. Journal of Natural Disaster Science, 23, 65-82.
- Larsen, M.C. (2008) Rainfall-Triggered Landslides, Anthropogenic Hazards, and Mitigation Strategies. Advances in Geosciences, 14, 147-153. www.adv-geosci.net/14/147/2008/ http://dx.doi.org/10.5194/adgeo-14-147-2008
- Feliziani, P., De Luca, P., Barrientos, C., Bastardo, S. and Ramírez, R. (1985) Estudio Geotécnico del área Metropolitana de Caracas. Sociedad Venezolana de Geólogos. VI Congreso Geológico Venezolano, 7, 4612-4681.