Journal of Flow Control, Measurement & Visualization
Vol.04 No.04(2016), Article ID:71637,23 pages
10.4236/jfcmv.2016.44015
Effect of Gas Oscillation-Induced Irreversible Flow in Transitional Bronchioles of Human Lung
Bing Han1, Hiroyuki Hirahara2
1Graduate School of Science and Engineering, Saitama University, Saitama, Japan
2Division of Mechanical Engineering and Science, Saitama University, Saitama, Japan

Copyright © 2016 by authors and Scientific Research Publishing Inc.
This work is licensed under the Creative Commons Attribution International License (CC BY 4.0).
http://creativecommons.org/licenses/by/4.0/


Received: June 27, 2016; Accepted: October 28, 2016; Published: October 31, 2016
ABSTRACT
Gas exchange in human lungs is established by several flow mechanisms. In the present study, the features of gas displacement in the distal bronchioles of a human lung are investigated by both numerical calculation and experimental observation with particle image velocimetry. The effect of respiration frequency is considered, such as high frequency oscillatory ventilation. By comparing the obtained results, it has been found that the redistribution of gas is attributed to irreversible flow, which is remarkable in higher frequencies oscillation with even lower tidal volumes. Owing to the continuous driving, a time-averaged net flow was induced and intensified by the oscillation. Thus, the gas in the centre region penetrated the deeper region and the outer gas was evacuated to the upper region. Consequently, this streaming contributes to prompt gas replacement. Furthermore, we analysed the effect of the respiration wave form to consider the flow acceleration. From this inspection, it was found that the enhanced inertial force tends to encourage the irreversible flow.
Keywords:
Oscillatory Flow, Irreversible Flow, Net Flow, Bronchioles, High Frequency Ventilation

1. Introduction
Air flow in lungs exhibits various flow patterns, in terms of frequency and tidal volume, involving normal breath and artificial respiration. For example, during rest breathing in a healthy lung, the tissue expansion during the inspiration phase causes negative pressures in the peripheral airspaces, i.e. there is a pressure gradient between the alveolar air and the environment. On the other hand, exhalation is a passive process that is achieved through recoil of the lung and the chest wall by reducing the lung volume. The motion establishes a positive alveolar pressure; hence, a positive pressure gradient evacuates the air from the lung [1] . Although the motion is a simple reciprocal process, the flow features in each airway are very complicated due to the intricate anatomical structure of the lung, various respiration conditions, and interactions with other body tissues. In normal breathing, the fresh air is inhaled and delivered to the alveoli mainly through molecular diffusion and partly through bulk flow.
A schematic of human respiration system is shown in Figure 1; the lung section is generally from the trachea to the alveoli. In terms of anatomical classification, the aspect of the lung’s structure is quite complicated. A typical anatomical hierarchy of a lung―Weibel’s model [2] ―is shown in Figure 2. Weibel’s model treats airways from the trachea to alveoli as branching trees using the divergent approach. Additionally, Weibel’s model features symmetric geometry for each generation such as the diameters, lengths and branching angles, etc. The model bifurcates from the trachea to the alveolar

Figure 1. Schematics of human respiration system.

Figure 2. Schematics of hierarchy by Weibel’s model.
sacs 23 times as demonstrated in Figure 2. Generations 0 to 16 (G0-G16) are regarded as conductive airways without gas exchange. The generations G17 to G23 work as transitional and respiratory tracts where gas exchange takes place. The Reynolds number at each generation broadly ranges from approximately 4500 at the trachea to 40 at the terminal bronchus, thereafter, it falls drastically to even lower than 0.01 in the alveoli.
Research concerning human respiration system plays an important role in biology, physiology, fluid mechanics, and pharmacology. In the recent research into fluid mechanics, there are several research subjects to be considered regarding lung airflow, e.g. turbulence, airway resistance, interaction between the lung geometry and airflow, the influence of the upper airways and peripheral airways on flow, high-frequency oscillatory ventilation, shear stress, and airway expansion and deformation. In the present study, we focus on the irreversible flow within peripheral airways when high frequency oscillatory ventilation (HFOV) is adopted. HFOV is a unique approach as one of techniques regarding artificial ventilation, which oscillates the gas much faster and shallower than our rest breathings or conventional ventilations.
HFOV causes the change in flow regimes as the convective regime extends more deeply into the small airways. Hence, the airflow becomes complex and turbulent in each airway. Airway flow is dominated by different factors depending on the generation number, i.e. inertia forces and convections are more dominant in the upper area. However, intermediate lung region and peripherals, viscous forces and molecular diffusions are more crucial. Chang HK summarized several effective mechanisms of HFOV, i.e. turbulence, Taylor dispersion, asymmetric velocity profile, pendelluft flow, coaxial flow, and molecular diffusion [3] . HFOV is widely recognized for the reduction of ventilator-induced lung injury (VILI). In addition, its respiration process is known as an extraordinary phenomenon.
HFOV has attracted considerable research interest because of its peculiar working pattern, which is very different from conventional ventilations or our normal breathing, and effect on ventilation as well. Recently, with the development of numerical calculation and experiment techniques, more detailed and subtle airflows by HFOV have been discovered. Tanaka et al. found that the secondary flow contribution was remarkable in the left main stem bronchus when compared to the right main stem bronchus [4] . Lieber and Zhao concluded that the flow exhibited quasi-steady behaviours for only about 50% of the oscillatory cycle in a symmetric single-bifurcation tubal mode [5] . Nagels and Cater observed reverse flow near the walls when the driving velocity was small, postulating that this may be responsible for the occurrence of pendelluft at the bifurcations [6] . In addition, Heraty et al. observed the coaxial counter flow feature and reported that the counter flow feature persisted for a significant time period and could enhance mixing between the inspiratory and expiratory streams [7] . Adler and Brücker studied HFOV in a six-generation airway model and observed the mass exchange between daughter branches at the end of inspiration or expiration, which is also known as pendelluft [8] .
The influence of asymmetric airway compliances on redistribution of gas particles during the HFOV has been numerically investigated by Hirahara et al. [9] . Gebreegziabher et al. numerically investigated time-varying pipe flows driven by a harmonically pulsating inlet velocity and spanning all flow regimes. They found that the use of a quasi-steady model for the prediction of fully developed friction factors is not applicable for a certain range of frequencies, and that the study itself is beneficial to practical applications such as cardiovascular and respiratory systems of mammals [10] . Alzahrany and Banerjee studied the aerosolized drug delivery in a realistic human lung under HFOV. They found that increasing the operating frequency resulted in a significant change in global and local deposition [11] . Bauer and Brücker numerically investigated the influence of airway geometry and ventilation frequency on airflow distribution; they concluded that steady streaming phenomenon contributes only to a minor percentage to the overall mass transport in the upper lung airways [12] . Kaczka et al. surveyed the multi-frequency oscillations in a premature lung, and found it was more efficient in gas exchange compared with a traditional single-frequency HFOV [13] . Makris et al. numerically investigated particle transport and deposition in realistic G3-G4 airways under HFOV and normal breathing. They found that the HFOV displayed stronger secondary flows and a strong counter flow that accumulated and deposited particles [14] . Chen et al. conducted numerical simulations for airflows in G5 to G7 under normal breathing and HFOV. They also analysed gas transportation, wall shear stresses, and oxygen concentration with different values for the Reynolds and Womersley numbers [15] .
2. Purpose of Present Study
The studies mentioned above mainly demonstrate airflows within particular airways. Many of them focused on the complicated flow mechanism in the upper lung airways, except for the small peripheral airways. Additionally, an interest of HFOV is that the tidal volume is usually lower than the dead space of a conducting region. This fact indicates that the fresh air can barely enter or is not delivered directly to the respiratory region. However, HFOV is still effective as a prompt ventilation system and is widely used in the clinical field. In addition, there may be progressive patterns to push fresh gas deeper into the distal region to overcome the shortage of tidal volume. From those aspects, the present work focuses on the flow features at the transition zone about G18, i.e. between the conducting and respiratory airways, in order to survey how fresh air enters this deep region where tidal volume cannot directly reach.
We have preliminary calculated the values of the Reynolds number (Re), the Peclet number (Pe), and the Womersley (Wo) number for every generation according to the geometrical sizes based on Weibel’s model and oscillatory velocity under HFOV (sinusoidal, 10 Hz, 15 Hz, and 20 Hz, and a 150 mL tidal volume) and rest breathing (sinusoidal, 0.2 Hz with a 500 mL tidal volume) [9] . Re and Pe are both lower than 10, and Wo is lower than 1 at G18 under these two scenarios. The actual values of Re and Pe are supposed to be even lower because the tidal volume is normally less than 150 mL in practice. Hence, the airflow is quite laminar and parabolic quasi-steady. Additionally, the magnitude of convection declines to the magnitude of molecular diffusion. In this viscous zone, both turbulent and convective effects are further suppressed. Therefore, it is more convenient to determine the progressive pattern of the airflow distribution.
Haselton and Scherer experimentally investigated oscillatory flow in branching airways where the diffusion coefficient was negligible under an extremely low Reynolds number. In their report, a bulk exchange of aerosol across the reference origin was confirmed while the total flow was zero. Despite their study being conducted in a branching airway whose internal diameter was larger than the trachea, the resultant mechanism was expected to act throughout the whole respiratory tract [16] . Fresconi, Wexler, and Prasad studied the transport profiles in the conducting airways of the human lung around G7-G13 in Weibel’s lung model, and presented the streaming mechanism as well as the importance of the net flow [17] . Whether such time-averaged steady strea- ming or other type of progressive patterns exists in the transitional bronchioles (G18- G20) belongs to the primary subject of the present work. Although HFOV is driven by a small tidal volume, it delivers fresh air into the deeper region.
Moreover, considering the effect of inertial force, we hypothesize that if the inertia force of gas is somehow enhanced, the gas will be thrust more deeply into the downstream airways and more turbulence will be induced in the upper airways. This fact may benefit gas exchange; therefore, the ventilation efficiency will consequently be improved. In order to strengthen the inertia force, an available approach is to feed the gas with a shock-like velocity profile while maintaining the tidal volume unchanged. Accordingly, four gas-feeding patterns, i.e. sinusoidal respiration (SIN), steep inspiration (SI), steep expiration (SE), and steep inspiration and expiration (SIE) will be applied and analysed numerically to verify the hypothesis.
In this study, numerical calculation and particle image velocimetry (PIV) measurements are carried out for 1) revealing the gas replacement mechanism in peripheral lung airways (G18-G20) under HFOV application, and evaluating its significance to respiration by comparing with conventional ventilation (CV) or normal breathing; and 2) demonstrating the dislocation of fluid parcels in peripheral lung region caused by steep gas feeding patterns in order to estimate its influence on ventilation efficiency. Here, it is necessary to remember that molecular diffusion was neglected in order to inspect the influence of flow convection in the present survey.
3. Numerical Calculation
3.1. Airway Model
Research of gas flow in lung airways is extremely complex due to the intricate anatomical structure, various breathing conditions, and different physiological features of individual, etc. The anatomical lung models developed by Weibel [2] and Horsfield [18] are widely used in research of lung airflow, as shown in Figure 3 and Figure 4. As the reciprocal procedure of Weibel’s model, Horsfield model regards pulmonary airways as confluent trees using the convergent approach, the branches count from the small peripheral branches, i.e. terminal bronchioles, toward the main stem―trachea. Therefore,

Figure 3. A series of dichotomous patterns of Weibel’s model.

Figure 4. Airways in Horsfield orders.
he termed the generated branch numbers as orders. Weibel’s model is considered more suitable for this study due to its symmetry and representativeness, and it is helpful to obtain more general flow features by neglecting the irregular and over-complex airway geometry.
A numerical model consisting of mother-daughter-granddaughter branches from G18 to G20 is shown schematically in Figure 5. The boundary conditions for the inlet and outlets will be illustrated in depth later. The four fictitious bulbs at the bottom symbolize the pressure boundary for the outlets. The model dimensions are based on Weibel’s model where the diameter of G18 is 0.5 mm, G19 and G20 have slightly smaller diameters of 0.47 mm and 0.45 mm, and the bifurcating angle is 70˚ for G19 and 60˚ for G20. The inlet and outlet channels have been extended to allow the flow to develop fully, and the four terminal ends of the model have been enlarged in diameter to decrease the impact of the boundary pressure on the inner flow. The regions near the bifurcations, especially the bifurcation right below G18, are the interrogation zones.

Figure 5. Schematic of G18 to G20 airways (left side) and its volume mesh (right side).
The numerical model has been meshed into 489,362 polyhedral cells with 10 progressive sub-prism layers. The typical mesh size is 2 × 10⁻⁵ m over all regions. In this survey, a 3-generations airway model is adopted for investigation; however, we will not discuss the flow within the granddaughter airway. The influence of the granddaughters’ asymmetry on airflow in a branch model has been investigated by Soni et al. [19] .
3.2. Non-Dimensional Parameters, Governing Equations, and Numerical Schemes
Three important non-dimensional parameters that reflect flow characteristics are Reynolds number Re, Womersley number Wo, and Peclet number Pe, i.e.
 (1)
(1)
 (2)
(2)
 (3)
(3)
where U, R, υ, ω, and α indicate cross sectional mean velocity, airway radius, kinematic viscosity, angular frequency, and molecular diffusivity, respectively.
The simulation and post-processing were implemented with Star-ccm+®, which is based on the FVM (finite volume method) algorithm. The governing equations for the present problems are represented in the ordinal Navier-Stokes and continuum equations.
 (4)
(4)
 (5)
(5)
where,  is the velocity vector in Cartesian coordinates, and p, ρ, and υ are the pressure, fluid density and kinematic viscosity, respectively. This set of equations is solved by a PISO type scheme utilizing time integration with a second order accuracy, whose internal iteration is based on the AGM algorithm. The convective terms are discretized by the MARS method for the second order. Initial temperature and pressure are set at 293.10 K and 101.3 kPa, respectively. Since the flow velocity is lower than 0.1 m/s and local Reynolds number is less than 10 in this distal region, incompressible Newtonian fluid and laminar flow are selected for the flow properties.
Moreover, the method fresh air enters the peripheral lung region is expected to be clarified for better understanding the flow mechanisms in a peripheral lung under a HFOV application. The volume of fluid (VOF) method is considered a proper technique that traces the interface of fluids in lattices without moving the computational grid. Normally, a VOF scheme is used to distinguish different species of fluid, whereas in this case, VOF is adopted to clearly determine the net flow through the deformation of the interface between same species. VOF resolves the gas replacement with a free- surface condition on the free boundary. In the calculation, a nominal function with a value between 0 and 1 is used to indicate which part of the cell is filled with fluid. It belongs to the class of Eulerian multiphase model, and was firstly brought forward on paper by Hirt and Nichols [20] .
As depicted in Figure 6, the upper fluid (red) and the lower fluid (blue) are initially isolated by a nominal interface in G18. Hereafter, we will indicate the upper fluid as fresh gas and lower fluid as old (used) gas. The penetration volume (VP) is estimated as the volume of the fresh gas that enters the deeper region. The volume varies with time; hence, the penetration volume is a time-dependent variable that also represents the intensity of the bulk flow. The volume of net flow (Vnf) indicates the amount of fresh gas that has been left in the following deeper region after a certain cycles of oscillation. Vnf is a time-averaged value and reflects the strength of steady streaming. Furthermore, if the area near the bifurcation is divided into 4 fluids as shown in Figure 7, the interactions

Figure 6. VOF setting with two fluids.

Figure 7. VOF setting with four fluids.
and dislocations among them will be observed more precisely. Meanwhile, the Lagrangian tracing technique (Figure 8) is also used in calculations to demonstrate the move- ment of gas particles.
3.3. Boundary Conditions and Meshing
The inlet located at the top of G18 inhales and discharges air flow as a velocity boundary. The four outlets at the bottom of G20, on the other hand, were assigned as the pressure boundaries. Now, we consider the boundary condition for the inlet in cylindrical coordinates. Here, the z direction is assumed as the pipe axis. The governing equation of axial oscillatory flow is presented in Equation (6), where uz, t, ρ, G, υ, and r denote velocity in the z direction, time, fluid density, pressure gradient, kinematic viscosity and radial distance, respectively.
 (6)
(6)
If we supply the pressure oscillation, the pressure term is represented by the following relation.
 (7)
(7)
where, K is the acceleration amplitude per unit mass; ω denotes the angular frequency. Then, the solution of Equation (6) can be obtained as
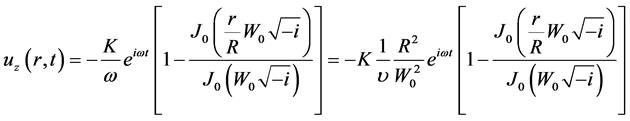 (8)
(8)
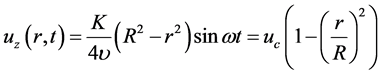
where J0 is the 0th order of Bessel function; i represents the imaginary number. R is the inner radius of the channel. By approximation for a small Womersley number ( ), Equation (8) can be reduced to Equation (9).
 (9)
(9)

Figure 8. Lagrangian particle setting.
where uc is the velocity amplitude of central axis in oscillatory Poiseuille flow at the inlet. In this way, the tidal volume and oscillation frequency can be regulated by changing the values of uc and ω. For instance, Equation (10) guarantees 50 mL tidal volume for sinusoidal oscillation with different frequencies, where R = 2.5 × 10⁻⁴ (m) indicates the radius of G18 airway.
 (10)
(10)
Next, as stated before, a pulsated flow velocity was assigned for inlet boundary to inspect the influence of enhanced inertial force. Here, four different inlet velocity waveforms including sinusoidal (SIN), steep inspiration (SI), steep expiration (SE), and steep inspiration and expiration (SIE) under the same frequency of 10 Hz and tidal volume of 50 mL are configured for the inlet boundary. The uc is specified in different shapes of waveform as shown in Figure 9; the expressions for them for one cycle are given by Equations (11) (12). The values of parameter a, b and c are listed in Table 1 within different time ranges that maintain identical tidal volume for these different gas feeding patterns.

Figure 9. Velocity curves of steep wave at central axis for inlet boundary condition.

Table 1. Values of a, b, and c for three types of steep gas-feeding velocities.
SIN

 (11)
(11)
Steep velocities
 (12)
(12)
For the four outlets at the bottom, the gas pressure is assigned as the boundary condition by Java coding in Star CCM+, which consists of lung compliance C, laminar resistance in the airway Rj and volumetric flow rate in the bronchi for a given generation q as demonstrated in Equation (13). The lung compliance C is defined as the ratio of volume difference ΔV to pressure difference ΔP. Rigid wall is selected for the peripheral wall as boundary condition.
 (13)
(13)
where the suffix i indicates the generation number of interest, and j is an index from i + 1 to the terminal.
4. PIV Experimental Setup
As illustrated in Figures 10-12, a doubly bifurcated airway model from G18 to G20 has been fabricated and prepared for PIV measurement based on the anatomical dimensions of Weibel’s model. The airways are cut out from a black anodized aluminium plate, and the widths of G18, G19, and G20 are 500 μm, 450 μm and 400 μm, respectively. The thickness of the plate is 500 μm. The length of G19 is 1.2 mm along the centre line, G18 and G20 are long enough for the flow to fully develop. The angles of upper and lower junctions are 70˚ and 60˚, respectively.
The fresh air is supplied from a HFOV device to the airway model via a buffer tank which simulates the lung space above G18 (dead space) and serves as a particle reservoir. For the outlets at the bottom, four identical compliances are achieved by using truncated elastic tubes whose compliances are all approximately 1.92 × 10⁻⁶ mL/Pa. A

Figure 10. PIV experimental setup.
CMOS camera (XS-5, 1280 pixels × 1024 pixels resolution, IDT) and a micro lens (VQ-Z50, KEYENCE) are used for image acquisition, a double-pulsed Nd-YAG laser (Solo Ⅲ PIV 15, 532 nm wave length, 50 mJ intensity, New Wave Research) was adopted to illuminate the airway channels at an angle of 30˚ from the top, as illustrated in Figure 13. Sub-micron oil-mist (Aerosol Generator PivPart 14, PIVTEC) generated by Laskin nozzle is employed as a tracer whose typical diameter is 1 μm.

Figure 11. Airway model with compliances.

Figure 12. Geometry of airway model in experiment.

Figure 13. Setting of laser illumination and optics in PIV experiment.
The experiment commenced immediately after the particles were fed into the device. Then, 100 pairs of phase-locked images were subsequently obtained for each delay. Thus, the ensemble velocity can be calculated from the acquired data. The phase-locked data were obtained by means of shifting the trigger signal by 1/16T. Both the Womersley number and Reynolds number were less than 10 under this condition, which implies the airflow does not include high order turbulence. The velocity fields were obtained as ensemble phase lock sampling. The images acquisition period was set as 1/16T. After acquiring all the particle images and calibration plate (grid size 0.1 mm) image, a PIV software (pro VISION, IDT) was used for velocity reconstruction. The interrogation size was set at 64 pixels × 64 pixels to guarantee more than 10 particles inside, and the mesh size was set as 16 pixels × 16 pixels.
5. Results and Discussions
5.1. Difference of Flow Features between CV (Conventional Ventilation) and HFOV
We assume the pattern of CV is identical to our rest breathing (sinusoidal oscillation, 0.2 Hz with 500 mL tidal volume), while the HFOV was adopted using a 10 Hz frequency and 50 mL tidal volume. The flow is laminar and parabolic quasi-steady within the interrogation region for both CV and HFOV. However, obvious differences between these two schemes have been verified. The CV takes 5 seconds for one-cycle oscillation, in contrast, the HFOV accomplishes 50 cycles of oscillation in the same duration. Figure 14 shows the dislocation of gas particles in a cycle of CV, some particles


Figure 14. The movement of particles in one oscillation of CV (sinusoidal, f = 0.2 Hz, VT = 500 ml).
can even pass through G20 during respiration, but after the extensive stretching and contracting, almost all the particles return to the vicinity of original locations as illustrated in the last instance. Therefore, bulk flow is considered as the main mechanism for gas delivery, and the time averaged streaming is not obvious in CV.
In a similar way, the movement of particles at different instants are demonstrated in Figure 15 for HFOV. By fast and shallow vibrations, the particles move up and down much more orderly while none of them has ever entered G20. At the end of each oscillation, the particles are arrayed in V-shape from the front view that means the particles close the core dislocated downwards and the peripheral particles upwards. However, the particles extremely close to the airway wall do not vibrate apparently due to the no-slip condition, this also account for the ring shapes formed near the airway wall for each particle layer. After 5 seconds, the sharp V-shapes have formed over all particles at different flat layers. It shows the time-averaged net flow rather than bulk flow. The obvious difference of airflow between CV and HFOV in peripheral airways can be seen here, although the flow properties and airway geometry have been set completely identical.
In the VOF scheme, as mentioned above, the effect of molecular diffusion was neglected to discuss the convective effect. XZ plane is selected as the observation plane. Figure 16 presents the variation of fluid volumes after a cycle of oscillation (5 s) in CV. Initially, four fluids were filled sequentially in the airway model, so the simulation result


Figure 15. The movement of particles in 50 oscillations by HFOV (sinusoidal, f = 10 Hz, VT = 50 ml).
is similar to what Figure 14, showing small part of each gas fraction eventually penetrates into each other while the majority returns back to the original spaces after extensive stretching and contracting. Bulk flow is considered more dominant than net flow within distal airways in CV.
On the other hand, in the case of HFOV as illustrated in Figure 17, the time-aver- aged net flow is enhanced progressively by the oscillation of HFOV. Eventually, a portion of each fluid makes contact with the other fluids―the gas near the channel axes moves deeply downwards while the surrounding part is expelled upwards. The gas close to boundary wall tends to adhere to the wall because of the no-slip condition. The net flow is much more prominent in HFOV than in CV. The fresh gas (red) eventually dives deeply into the next generation and is considered beneficial to the respiratory efficiency.
Figure 18 illustrates the dislocation of gas particles after 3 cycles of HFOV from the numerical calculations, those particles were originally situated on a flat plane in G18. From the front view, similar to the previous results, the central particles move downwards and the peripheral particles move upwards. Since this air way is not axially symmetric but plane-symmetric, we can notice a wedge-like shape forms downwards from an oblique view. The colour map indicates the amplitude of particle displacement. A 0.5 mm gap has been extended from the top to the bottom in just 0.3 s.
Figure 19 shows the velocity vectors at four different phases for one cycle of HFOV by PIV measurement. Figure 19(a) and Figure 19(b) indicate the velocity distribution when inspiration velocity and expiration velocity maximize. As shown in the figures,

 t = 0 s t = 5 s
Figure 16. The variation of volume of fractions after one cycle of CV (sinusoidal, f = 0.2 Hz, VT = 500 ml).


 t = 0 s t = 0.3 s t = 1 s t = 5 s
Figure 17. The variation of fluid volumes in 50 cycles by HFOV (sinusoidal, f = 10 Hz, VT = 50 ml).


Figure 18. Redistribution of gas particles originally situated on a flat plane in G18 after 3 cycles of HFOV (sinusoidal, 10 Hz, 50 ml) from front view (left side) and oblique view (right side).

 (a) The instant when inspiration velocity maximizes (b) The instant when expiration velocity maximizes
 (c) The end of inspiration (d) The end of expiration
Figure 19. Experimental results of velocity vectors in one cycle of HFOV at different phases.
the core gas moves faster than the peripheral gas in the airways, and the peak value is approximately 0.08 m/s in both phases. The magnitude is higher than the numerical result of 0.061 m/s. This fact may be caused by a difference in the inlet boundary conditions between the calculations and experiment. Figure 19(c) and Figure 19(d) demonstrate the velocity distribution at the end of inspiration and expiration. The peak values are 0.01 m/s and 0.006 m/s, respectively. A slight phase lag occurs at both occurrences as the internal velocity lags behind the velocity variation at the inlet, which is much less noticeable in the calculations.
Similar to the numerical calculations, the oscillated gas flows up and down symmetrically for all phases of the experiment. The particle displacements are obtained by integrating the individual particle velocity in a cycle, as shown in Figure 20, which is again similar to the numerical results despite the layouts not being as neat as in the simulation. The left figure was obtained for one oscillation of the 50 ml tidal volume and 10 Hz frequency and shows slight deviation of particle dislocations in the middle region. The right side is achieved by merely increasing the frequency to 20 Hz, which then demonstrates a slightly weaker net flow than for the 10 Hz case. Obvious net flows have been found at other frequencies in HFOV by PIV experiment. Accordingly, it is regarded that HFOV produces an apparent time-averaged net flow that facilitates fresh- air intake and used-gas evacuation, while CV delivers fresh gas mainly by bulk flow rather than net flow.
The penetration volume VP, has been calculated using the VOF technique as demonstrated in Figure 21 and Figure 22 for CV and HFOV, respectively. Conversely, the volume of the net flow Vnf directly reflects the intensity of the net flow of fresh gas; therefore, it could act as a criterion for ventilation efficiency of HFOV. Here, we adopt the calculation scheme as shown in Figure 6 to distinguish fresh gas and used gas. Figure 21 and Figure 22 demonstrate that CV drives bulk gas downstream while leaving less, and shallower, fresh gas (Vnf = 3.98 × 10⁻⁵ ml) for deeper generations after the one-cycle oscillation. In contrast, although HFOV oscillates a much smaller amount of gas, the flow leaves more and was stretched for fresh gas (Vnf = 4.67 × 10⁻⁵ ml) in the deeper regions after an identical duration. Moreover, HFOV rearranges the gas in a

Figure 20. Particle dislocations and traces in PIV measurement in one cycle of HFOV (10 Hz for the left, 20 Hz for the right).

Figure 21. Variation of penetration volume for 5 s of CV (left side) and its partial magnification (right side).
more orderly fashion as shown in Figures 14-18. Table 2 lists a brief comparison between CV and HFOV from the numerical results, in which tidal volume VT is the volume of air displaced between inhalation and exhalation at trachea, while local tidal volume indicates the volume of air displaced between inhalation and exhalation at G18.
Based on the obtained results, HFOV thrusts the core gas downwards and the peripheral gas upwards much more than CV. Here, the net flow indicates a time-averaged value that the new air penetrates. Hence, it does not involve simultaneous flows in opposite directions as in coaxial counter-flows or out-of-phase flows [21] . The factors to be accounted for regarding net flow have not been uncovered sufficiently, but it is considered that any flow oscillating within a geometrical asymmetry would experience a net flow as Haselton and Scherer concluded [16] . The non-uniform airway geometry may be attributed to this steady streaming effect.
Although the volume of net flow in one distal bifurcation is small under HFOV, it may take place in every dichotomous lung branch, hence, the large number of branches boost the significance of the net flow. For example, the number of G18 airways is on the order of approximately 218 in a healthy lung, so the total amount of Vnf becomes reasonably considerable. Consequently, the answer to our initial question is provided; the net flow of steady streaming works to overcome the tidal-volume shortage of HFOV and delivers fresh air to the respiratory lung region. Steady streaming is hereby deemed as an important contributor to the effect of HFOV.
5.2. Effect of Steep Respiratory Velocity on HFOV
The net flows caused by steep velocities will be illustrated for comparing ventilation efficiency of steep gas-feeding in HFOV. The boundary conditions, except for the inlet, are identical to the previous HFOV calculations. Figure 23 shows the net flow of fresh gas after a three-cycle oscillation. As shown in these figures, the steep respirations,

Figure 22. Variation of penetration volume for 5 s of HFOV (sinusoidal, f = 10 Hz, VT = 50 mL).
Table 2. Comparison of the time-averaged net flow within G18 induced by CV and HFOV for 5 s.
especially the SIE, produces the strongest net flow, thereby delivers more fresh gas downwards and sharpens the interface more than the other patterns.
Figure 24 demonstrates the variation of penetration volumes within three cycles caused by steep gas-feeding patterns. All four curves reach identical peak value in every cycle because of the same tidal volume, although in different shapes. From those results, we can further compare net flow volumes after each cycle more directly with respect to the entire inner volume of G18 (VG18), as shown in Figure 25. In Weibel’s model, a single G18 airway is treated as a cylinder based on a 500 μm diameter and 1.17 mm height, so VG18 = 0.00023 mL. At the end of a three cycle oscillation, the steep gas-feeding uplifts Vnf, especially SIE that boosts Vnf by 223% compared to SIN, which is generally used in current HFOV. Additionally, SI and SE improve Vnf by 134% and 126%, respectively. These numerical investigations indicate that the enhanced inertia force is capable


 SIN SI SE SIE
Figure 23. Net flow after a three cycle oscillation caused by four steep gas-feeding patterns.

Figure 24. Variation of VP of fresh gas caused by four steep gas-feeding patterns in a three cycle oscillation.

Figure 25. Volume of net flow over interior volume of G18 after a three cycle oscillation [%].
of accelerating the gas, i.e. the rapid accelerated operation pushes fresh gas into the deep lung region and improves the ventilation efficiency of current HFOV.
In order to clarify the effect of the steepening gas feeding pattern, a discussion of the particle trajectory during the respiration is provided. As demonstrated in Figure 26, 19 gas particles were initially positioned in a straight line. The tracks of these particles have been demonstrated for three cycles of HFOV. In the inspiration phase, the particles descend to the next generation, while in the following expiration phase, they retreat by the routes more inclined towards the central axis. This track deviation may be attributed to the centrifugal force in the irreversible process around the conjunction’s corner. Steeper gas-feeding deviated more as shown in Figure 26. Moreover, the differences can be noticed closely below and above the interface line. In the cases of steep gas feedings (especially SIE), particles in the core region eventually reach lower positions, the peripheral particles relocate at higher positions at the end, and the particles beside the wall vibrate with a tiny magnitude due to the solid boundary effect. They are finally rearranged in a V-shape as the VOF calculation reveals.

 (a) (b)
 (c) (d)
Figure 26. Tracks of gas particles in three cycles driven by SIN (a), SI (b), SE (c), SIE (d) with 10 Hz frequency and 50 mL tidal volume.
6. Conclusion
HFOV drives the core gas downwards and evacuates the peripheral gas upwards in distal lung airways much more apparently and neatly than CV does after oscillations. The occurrence of time-averaged net flow has been investigated and confirmed by means of PIV measurement and numerical calculations. The net flow can be considered as an integrated result of asymmetric velocity profiles; therefore, it may further be affected by the non-uniformity of airway geometry. The steady streaming conceived in the net flow contributes gas replacement as one of the factors even though HFOV is operated with a small tidal-volume. Although the volume of net flow is quite low in a single bifurcation at the peripheral lung region, the total amount becomes considerable because of the enormous number of bifurcations in this region as well as the cumulative effect along the stem. Additionally, steady streaming is expected to act throughout the whole respiratory tract since it progresses when the gas is oscillated with high frequency. Consequently, steady streaming is considered as a significant contributor to the efficiency of HFOV. Therefore, a steep gas-feeding scheme enhances the irreversibility of the oscillatory flow and increases the streaming effects.
Cite this paper
Han, B. and Hirahara, H. (2016) Effect of Gas Oscillation-In- duced Irreversible Flow in Transitional Bronchioles of Human Lung. Journal of Flow Control, Measurement & Visualization, 4, 171-193. http://dx.doi.org/10.4236/jfcmv.2016.44015
References
- 1. Tawhai, M.H. and Lin, C.-L. (2011) Airway Gas Flow. Comprehensive Physiology, 1, 1135- 1157. http://dx.doi.org/10.1002/cphy.c100020
- 2. Weibel, E.R. (1963) Morphometry of the Human Lung. Springer Verlag and Academic Press, New York. http://dx.doi.org/10.1007/978-3-642-87553-3
- 3. Chang, H.K. (1984) Mechanisms of Gas Transport during Ventilation by High-Frequency Oscillation. Journal of Applied Physiology, 56, 553-563.
- 4. Tanaka, G., Ogata, T., Oka, K. and Tanishita, K. (1999) Spatial and Temporal Variation of Secondary Flow during Oscillatory Flow in Model Human Central Airways. Journal of Biomechanical Engineering, 121, 565-573. http://dx.doi.org/10.1115/1.2800855
- 5. Lieber, B.B. and Zhao, Y. (1998) Oscillatory Flow in Asymmetric Bifurcation Airway Model. Annals of Biomedical Engineering, 26, 821-830. http://dx.doi.org/10.1114/1.128
- 6. Nagels, M.A. and Cater, J.E. (2009) Large Eddy Simulation of High Frequency Oscillating Flow in an Asymmetric Branching Airway Model. Medical Engineering & Physics, 31, 1148-1153. http://dx.doi.org/10.1016/j.medengphy.2009.07.013
- 7. Heraty, K.B., Laffey, J.G. and Quinlan, N.J. (2008) Fluid Dynamics of Gas Exchange in High-Frequency Oscillatory Ventilation: In Vitro Investigations in Idealized and Anatomically Realistic Airway Bifurcation Models. Annals of Biomedical Engineering, 36, 1856- 1869. http://dx.doi.org/10.1007/s10439-008-9557-1
- 8. Adler, K. and Brücker, C. (2007) Dynamics Flow in a Realistic Model of the Upper Human Lung Airways. Experiments in Fluids, 43, 411-423. http://dx.doi.org/10.1007/s00348-007-0296-0
- 9. Hirahara, H., Iwazaki, K., Ahmmed, M.U. and Nakamura, M. (2011) Numerical Analysis of Air Flow in Dichotomous Respiratory Channel with Asymmetric Compliance under HFOV Condition. Journal of Fluid Science and Technology, 6, 932-948. http://dx.doi.org/10.1299/jfst.6.932
- 10. Gebreegziabher, T., Sparrow, E.M., Abraham, J.P., Ayorinde, E. and Singh, T. (2011) High- Frequency Pulsatile Pipe Flows Encompassing All Flow Regimes. Numerical Heat Transfer, Part A: Applications, 60, 811-826. http://dx.doi.org/10.1080/10407782.2011.627794
- 11. Alzahrany, M.S. and Banerjee, A. (2015) Aerosolized Drug Delivery in Patient-Specific Lung Model during Invasive High Frequency Oscillatory Ventilation. Journal of Aerosol Science, 81, 1-20. http://dx.doi.org/10.1016/j.jaerosci.2014.11.005
- 12. Bauer, K. and Brücker, C. (2015) The Influence of Airway Tree Geometry and Ventilation Frequency on Airflow Distribution. Journal of Biomechanical Engineering, 137, Article ID: 081001. http://dx.doi.org/10.1115/1.4030621
- 13. Kaczka, D.W., Herrmann, J., Zonneveld, E., et al. (2015) Multifrequency Oscillatory Ventilation in the Premature Lung: Effects on Gas Exchange, Mechanics, and Ventilation Distribution. Anesthesiology, 123, 1394-1403. http://dx.doi.org/10.1097/aln.0000000000000898
- 14. Makris, E., Pilou, M., Neofytou, P., Tsangaris, S. and Housiadas, C. (2014) Particle Transport and Deposition under High-Frequency Oscillatory Ventilation and Normal Breathing. Aerosol Science and Technology, 48, 150-162. http://dx.doi.org/10.1080/02786826.2013.865831
- 15. Chen, Z.X., Parameswaran, S., Hu, Y.Y., He, Z.M., Raj, R. and Parameswaran, S. (2014) Numerical Simulations of High-Frequency Respiratory Flows in 2D and 3D Lung Bifurcation Models. International Journal for Computational Methods in Engineering Science and Mechanics, 15, 337-344. http://dx.doi.org/10.1080/15502287.2014.904454
- 16. Haselton, F.R. and Scherer, P.W. (1980) Bronchial Bifurcations and Respiratory Mass Transport. Science, 208, 69-71. http://dx.doi.org/10.1126/science.7361109
- 17. Fresconi, F.E., Wexler, A.S. and Prasad, A.K. (2008) Transport Profiles in the Conducting Airways of the Human Lung. International Journal of Heat and Mass Transfer, 51, 5552- 5561. http://dx.doi.org/10.1016/j.ijheatmasstransfer.2008.04.014
- 18. Horsfield, K., Dart, G., Olson, D.E., Filley, G.F. and Cumming, G. (1971) Models of the Human Bronchial Tree. Journal of Applied Physiology, 31, 202-217.
- 19. Soni, B., Lindley, C. and Thompson, D. (2008) The Combined Effects of Non-Planarity and Asymmetry on Primary and Secondary Flows in the Small Bronchial Tubes. International Journal for Numerical Methods in Fluids, 59, 117-146. http://dx.doi.org/10.1002/fld.1802
- 20. Hirt, C.W. and Nichols, B.D. (1981) Volume of Fluid (VOF) Method for the Dynamics of Free Boundaries. Journal of Computational Physics, 39, 201-225. http://dx.doi.org/10.1016/0021-9991(81)90145-5
- 21. Jan, D.L., Shapiro, A.H. and Kamm, R.D. (1989) Some Features of Oscillatory Flow in a Model Bifurcation. Journal of Applied Physiology, 67, 147-159.
Nomenclature
C: Compliance [m3/Pa]
f: Frequency [Hz]
G: Pressure gradient [Pa/m]
J0: 0th order of Bessel function
K: Acceleration amplitude per unit mass [m/s2/kg]
p: Pressure [Pa]
Pe: Peclet number
q: Flow rate [m3/s]
r: radial position [m]
R: Radius of airway [m]
Re: Reynolds number
Rj: airway resistance [Pa∙s/m3]
u: Velocity in x-direction [m/s]
U: cross sectional mean velocity [m/s]
v: Velocity in y-direction [m/s]
V: Volume [m3]
V: Velocity [m/s]
w: Velocity in z-direction [m/s]
Wo: Womersley number
α: molecular diffusivity [m2/s]
ρ: Gas density [kg/m3]
υ: Kinematic viscosity [m2/s]
ω: Angular frequency [rad/s]
Subscript
c: at the central axis
G: Generation
i: ith generation of lung
j: jth generation of lung
P: Penetration
T: Tidal
z: z-direction