Open Journal of Optimization
Vol.2 No.3(2013), Article ID:36841,9 pages DOI:10.4236/ojop.2013.23011
An Application of Six Sigma Methodology in Agarwood Tissue Culture
Department of Business Innovation and Development, Ming Dao University, Changhua, Taiwan
Email: cpc@mdu.edu.tw
Copyright © 2013 Chien-Ping Chung. This is an open access article distributed under the Creative Commons Attribution License, which permits unrestricted use, distribution, and reproduction in any medium, provided the original work is properly cited.
Received July 5, 2013; revised August 6, 2013; accepted August 18, 2013
Keywords: Six Sigma; Response Surface Methodology; Agarwood; Tissue Culture
ABSTRACT
Agarwood has the mixed scent of ambergris and sandalwood, and cannot be artificially synthesized. Due to massive logging, agarwood is now listed as an endangered plant. Agarwood tissue culture can save provenance for breeding. For different combinations of TDZ (Thidiazuron), BA (6-Benzylaminopurine), and activated carbon of different concentrations, this study used the six sigma, as well as design of experiment (DOE) and response surface methodology (RSM) to optimize agarwood adventitious buds induced incidences and growth numbers. The results showed that, the combination of 4.0 ppm TDZ and 0.5 ppm BA, without activated carbon, had the best effect of adventitious bud induced incidence up to 21.75%, and adventitious bud growth number up to 24.8, improvements of 35.29% and 42.78%, respectively. The results verified that using the six sigma methodology could effectively enhance the induction of agarwood tissue culture adventitious buds, promote the blooming of agarwood in large numbers, and further realize agarwood restoration.
1. Introduction
Agarwood, also known as Aquilaria senensis Gilg, is a plant of the agarwood genus of the Gilg family. It grows in an environment with an annual average temperature of 19˚C - 25˚C, annual rainfall of 1500 - 2400 mm, and relative humidity of 80% - 88%. In addition to medical use, it is a very good spice crop [1]. Agarwood has the mixed scent of ambergris and sandalwood, which cannot be artificially synthesized. In Asian regions, agarwood is widely used in religious ceremonies, with a growing market demand, and is widely used in perfume development in recent years. Recently, due to massive logging, coupled with its long growth period and slow restoration, agarwood is now listed by CITES (Convention on International Trade in Endangered Species of Wild Fauna and Flora) as an endangered plant in 2004 [2].
The provenance of agarwood can be preserved by asexual breeding of tissue culture to induce adventitious buds for large scale breeding. This study used the six sigma methodology for analysis. Coupled with design of experiment (DOE) and response surface methodology (RSM), this study optimized the agarwood adventitious bud induced incidence and growth number for different combinations of growth regulator and activated carbon, at different concentration levels for the large scale breeding of agarwood, in order to realize the goal of agarwood restoration.
The remainder of this paper is organized as follows: Section 2 is a background review on six sigma, DOE, and plant tissue culture; Section 3 introduces RSM. Section 4 uses the proposed method in case validation; Section 5 offers conclusions.
2. Background Review
This section is divided into three parts, namely background review on six sigma, DOE, and plant tissue culture, respectively.
2.1. Six Sigma
Six sigma has been widely used in the business field to deliver doubled competitiveness and profits [3]. Whether it is used in operating processes, process improvement, or new product development, six sigma is an organized, systematic management method for structured processing of complex issues [4,5]. The step commonly used in process improvement is DMAIC, which include: 1) Define: identifying customer needs and core processes and identifying problems requiring urgent improvement; 2) Measure: by collecting existing information to understand the current level of process performance as an analytical basis; 3) Analyze: explore the causes of problems, and validate by data to confirm the root of the problem; 4) Improve: according to the root of the problems, propose the best solutions; 5) Control: ensure the continuation and standardization of the improvement plan.
2.2. Design of Experiment
DOE uses appropriate experimental design to obtain the best experimental results for decision-making with the least amount of time and cost [6,7]. In detail, DOE utilizes various factors (process parameter), level combination information, and analysis of variance (ANOVA) to determine the best process response values and corresponding process parameter combinations. According to the purpose of use and factorial level, it can be divided into general full factorial designs, full factorial designs, fractional factorial designs, and Plackett-Burman designs.
Raymond and Montgomery [8] suggested that DOE can effectively fit the first-order models; when DOE contains center points, namely, when process response value and influencing factors have a curvature relationship, it can be used to determine whether the model has second order effects or not.
According to Montgomery [9], the Box-Behnken design (BBD) of RSM uses parameter combinations of axial points and center points to effectively estimate the squared terms of the model, and is the rational choice for the estimation of the second order model. RSM is widely used in the areas of agriculture, electronics, mechanics, the chemical industry, biotechnology, materials science, and industrial process improvement, helping researchers to provide analysis and problem-solving procedures in product design optimization, process improvement, system optimization, and other issues.
2.3. Tissue Culture
The course of development of plant tissue culture can be traced back to the theory of totipotency, as proposed by German botanist Haberdandt [10], and based on the cell theory. He cultured the plant in a culture medium, and although the test was not successful, it promoted the development of tissue culture. The MS medium formula, as designed by Japanese scholars Murashige and Skoog [11], became the most widely used culture medium in tissue culture, giving rising to the stable development of tissue culture. In [12,13], they used the isolated tobacco protoplast cell to produce regenerated plants, confirming totipotent cell differentiation. Since then, plant tissue culture began to have obvious progress.
Tissue culture evolved on the basis of cell pluripotency and cell differentiation theories. By using plant tissue cells from pollen, embryo, seed, stem segments, buds, and apical tissues, and with the induction of growth regulators in a sterile state, cultured cells can grow into fully grown plants. Due to asexual reproduction, the excellent traits of the mother plant can be well retained in the offspring [14,15]. The operating processes of the production of healthy seedlings using tissue culture technology can be divided into the follow stages:
Stage 1. Mother Stock Establishment: including explant.
Stage 2. Multiplication: maintains cultures in sterile conditions inside the bottle and increases the number of micropropagation breeding to optimize the breeding efficiency in cases of different combinations of plant growth regulators and reproduction breeding.
Stage 3. Hardening and Rooting: uses various culture mediums and methods, such as external processing, in order that strong and healthy seedlings could be moved out of the sterilized tubes. At this stage, seedlings can be induced by micro cuttings, and small branches can be implemented according to the characteristics of the crop of in vitro rooting or ex vitro rooting environments.
Stage 4. Acclimatization: tissue culture seedlings with normal branch-root morphology are gradually transplanted in greenhouses or outdoor environments in ex vitro space of controlled humidity, temperature, and luminosity.
3. Research Method
This study applied the six sigma, namely DMAIC, in the induction of the agarwood tissue culture adventitious bud, and expected to improve the adventitious bud induced incidence and growth number. DOE coupled with RSM was used to optimize the induction of agarwood adventitious buds.
By integrating statistical analysis and DOE, RSM becomes an effective tool to discuss the relationship between independent variables and response variables, and fit curvature equation and optimization of response value [16,17]. In two-factor and multi-factor experiments, using RSM can efficiently and systematically conduct experiments to obtain results in line with the requirements of fewer experimental times. Hence, regarding multifactor experiments, in terms of reducing the number of experiments, the importance of the application of RSM can be better highlighted.
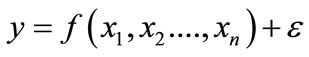
If there is a response variable y, an n controllable, and independent variables x1, x2… xn, the relationship between the response variables and independent variables can be represented by the approximation function, as below:
 (1)
(1)
where, ε is the error term of response variable y, in general, ε is assumed as independent and obedient in normal distribution, with the expected value at zero. If E(y) = f (x1, x2…, xk) = η is used to represent the expected value of the response, then η = f (x1, x2…, xk) is the so-called response surface.
Regarding problems relating to RSM applications, the relationships between independent variables and response variables are mostly complex and unknown; therefore, RSM uses a characteristic with sequential procedures as the optimization procedure for response surface analysis in order to determine whether the setting values of the independent variables are close to the optimal response values, and explore the relationship patterns between independent variables and response variables to fit the appropriate response surface. The initial values on the response surface are generally located in the operating region far from the optimal response value and small curvature. Hence, the first step of response surface analysis provides a linear function, which is composed of independent variables regarding the relationships between independent variables and response variables, to fit the unknown relation equations. The first order model approximation function can be represented, as below:
 (2)
(2)
where,  are constant terms.
Furthermore, by using the successive movement procedure methods of steepest ascent or steepest descent, it provides a route direction that can rapidly and efficiently approximate the optimal response value, and then repeatedly implement the procedure until moving to the operating region close to the optimal response value. Next, for the system with a curvature, polynomials of higher orders should be adopted, for example, the second-order model, to determine the optimum response value. The approximation function of the second order model can be represented as:
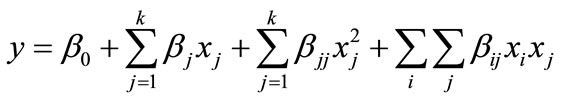 i < j (3)
When the experimental values are close to the region of the optimum response value, use the approximation function of the second order model is often used to fit the curved surface in order to conduct the second order response surface analysis. The reasons to use the second order model are as shown below:
1) The second order model can present equations in diversified forms, and thus, is more flexible in use.
2) Models higher than the second order are too complex, and thus, are not highly feasible for use.
3) The first order model can roughly determine response changes, but cannot significantly reflect the curvature, and therefore, is unable to reflect the actual situation.
In the second order response surface analysis, the determination of a stationary point location, canonical analysis, judgment of stationary point patterns, and the drawing of the contour plot and response diagram are important tasks. If there are n factors of x1, x2,…, xn, then  is the response estimated value, therefore, the partial differentiation processing of
  in each x1, x2, …, xn,
 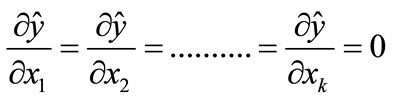 can produce n stationary points. After obtaining the stationary points, by using canonical analysis to determine the patterns of stationary points, it is found that stationary points on the response surface are displayed as the maximum response point, minimum point, and saddle point. In addition, according to the obtained information, the contour plots can be drawn to characterize the response surface. The contour plot is a two-dimensional diagram consisting of multiple contour lines of straight or curved lines. A specific contour line has equivalent response values. The characteristics of the contour plot are as follows:
1) To explain the response surface system by the most direct schematic diagrams;
2) When stationary points fall into the experimental region, it is convenient to observe the relative sensitivity degrees of the independent variables against the response values;
3) When the stationary point does not fall in the experimental region, or the stationary points are the saddle points, the contour plot can provide important reference information.
However, for observation of the relationships between independent variables and response variables, curved surface shape, and locations and patterns of stationary points, a three-dimensional response surface can be drawn.
Based on the principle of BIBD (balanced incomplete block design), Box and Behnken [18] developed a threelevel design method, which can fit the second order response surface very effectively. Moreover, BBD is characterized by the fact that all experimental points are located at the endpoints, without including the experiments on the topic of the cubic, as generated by the levels of various variables. Meanwhile, all endpoints and center points are equal in distance, making it a design method that fits the rotatable or almost rotatable design. A rotatable design means that the variance of the response estimates of any experimental combination of DOE is the equal distance function of the points to the center point in the experimental region. Another characteristic of BBD is that it can estimate the first order, the second order, and interaction term non-linear polynomials, by using the data of fewer experiments, as an efficient response surface design method.
4. Case Studies
By using the six sigma methododology with tissue culture agarwood as the subject, this study conducted improvements of agarwood tissue culture breeding efficiency, with the improvement steps as shown below.
4.1. Define
Agarwood breeding efficiency in tissue culture can affect the production efficiency of the agarwood tissue culture. The direct influencing factors of breeding efficiency include adventitious bud induced incidence and growth number. Therefore, improving adventitious bud induced incidence and growth number is the major objectives of this study.
4.2. Measure
Determine the pattern of agarwood adventitious bud induced incidence and growth number: culture the agarwood growing points in 3 × 8 test tubes and record the adventitious bud induced incidence and growth number after four months.
4.3. Analyze
After confirmation of an error-free measurement quality system, the agarwood tissue culture breeding efficiency is analyzed. The improvement goal in this study is set as adventitious bud induced incidence above 20%, and growth number above 20. After determining the research goals, by brainstorming, the researchers listed all the growth regulators that may affect the breeding rate of agarwood including BA, TDZ (Thidiazuron), 2,4-D (2,4- Dichlorophenoxyacetic Acid), Pi(Picloram), and NAA.
4.4. Improve
Among the six sigma steps, the improvement stage is most time and energy consuming stage, therefore, this stage is divided into three steps.
4.4.1. Essential Factor Selection
This study cultured growing points in 12 culture media combinations of five different growth regulators, includeing BA, TDZ (Thidiazuron), 2,4-D (2,4-Dichlorophenoxyacetic Acid), Pi (Picloram), and NAA for the lead experiments. This study applied a total of 12 processing methods, for processing 10 growing points by three times in the 3 × 8 test tube. Table 1 illustrates the lead experiments of the selection of essential factors. The
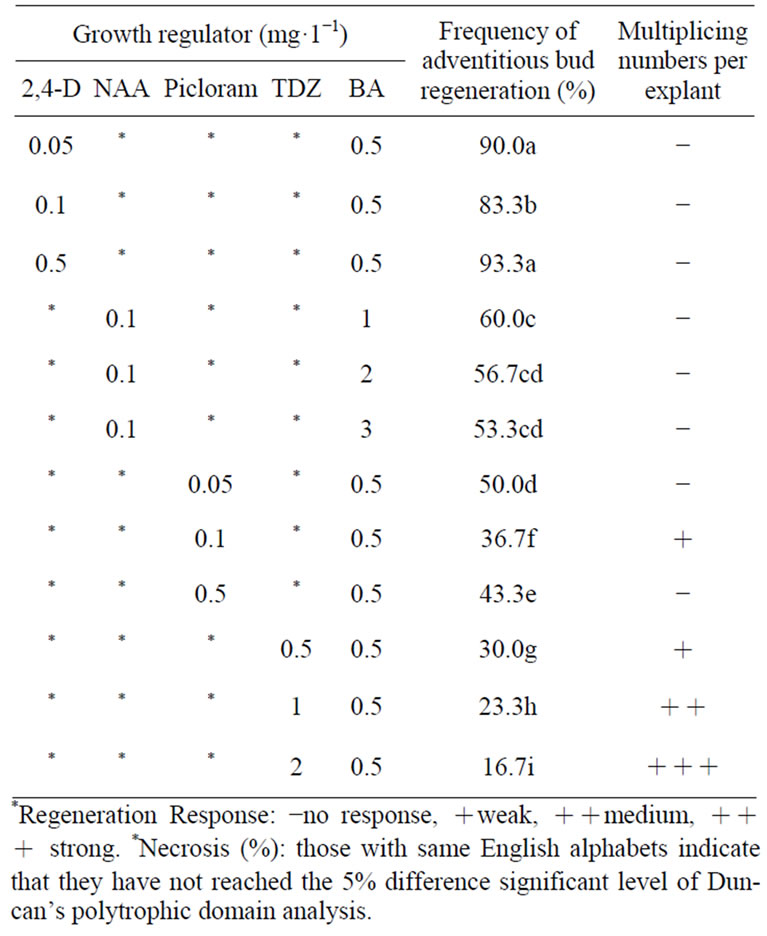
Table 1. Table of pre-experimental planning.
combinations of growth regulators TDZ and BA responded to the breeding of agarwood tissue culture, and the response was relatively strong, while the minimum necrosis rate (browning rate) can be as low as 16.7%, indicating that the combination of growth regulators of TDZ and BA is the key factor affecting the breeding rate of agarwood.
4.4.2. Relationships between the Variables
After testing the 12 combinations of culture medium in the lead experiments, it was found a combination culture medium containing TDZ and BA can effectively induce the regeneration response of the agarwood growing points. For further understanding of the optimal concentration of the combination of TDZ and BA, this study set the concentrations of the TDZ and BA combination using 2, 3, and 4 mg·L−1 TDZ and 0.5, 0.75, and 1 mg·L−1 BA, respectively.
Due to the serious necrosis of the agarwood growing points, combination tests were conducted by adding 0%, 0.05%, and 0.1% activated carbon, respectively. The factorial design of this test had three factors and three levels. According to the BBD design method of RSM, a total of 15 processing methods were applied to repeatedly process 10 growing points by three times in 3 × 8 test tubes, in order to determine the combination of culture medium that could effectively induce the formation of the adventitious buds.
This test used Minitab software for the experimental RSM Box-Behnken design (BBD). By using the BBD to design the experimental factorial design of three factors and three levels, a total of 15 processing methods were obtained, as shown in Table 2.
RSM regression analysis and ANOVA analysis were conducted on the adventitious buds induced incidence and growth number experimental results in order to calculate the regression equations of the individual response values. First, the optimal culture medium combination of individual response values was obtained, and the RSM desire function was used to determine the optimal culture medium combination of the response values of adventitious bud induced incidence and growth number. The details are:
1. The experimental data of the adventitious bud induced incidence suggested that, the testing combination of 4.0 ppm TDZ, 0.75 ppm BA, without addition of activated carbon, is the most efficient in induction, with an induction rate up to 17.5% (as shown in Table 3).
2. The adventitious bud growth number experimental data suggested that, the testing combination of 3.0 ppm TDZ and 0.5 ppm BA, without addition of activated carbon, is the most efficient in induction of the adventitious buds, and the growth number of adventitious buds is up to 20.0 (as shown in Table 3).
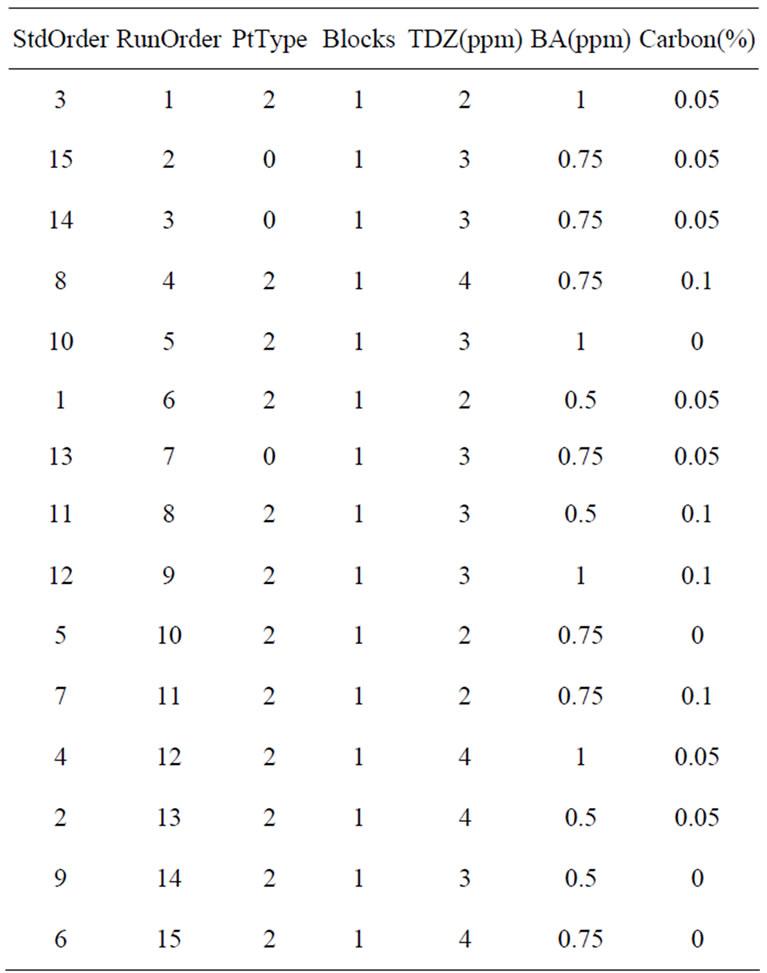
Table 2. Table of box-behnken design.
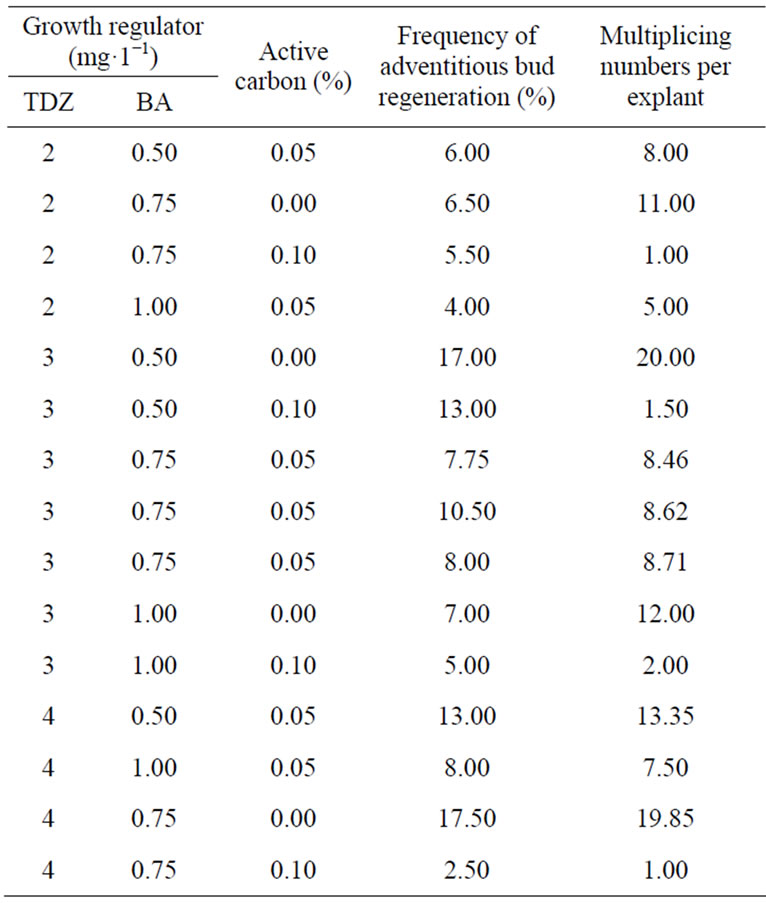
Table 3. The effect for combinations of TDZ, BA, and activated carbon.
3. The regression analysis results of the response data of the adventitious bud induced incidence (as shown in Table 4) suggested that, its explanatory capability is 88.41%. The following ANOVA table (as shown in Table 5) shows that the adventitious bud induced incidence has significant state in the first order, and most of its squared and interactive terms fail to achieve a significant state. Moreover, the squared and interactive terms are not at the significant state, indicating that the influencing factors of adventitious bud induced incidence are individual and there is no interaction. The value of the Lack-of-Fit values in the ANOVA table (as shown in Table 4) fail to achieve a significant state, suggesting that the model is free from Lack-of-Fit and the model fits the current region. The adventitious bud induced incidence four-in-one residual plot (as shown in Figure 1) indicates that, its residual roughly complies with normality, independence, and variance consistency. The regression coefficient of the influence on the induction of agarwood adventitious buds (as shown in Table 6) suggests that, the regression equation of adventitious bud induced incidence is:
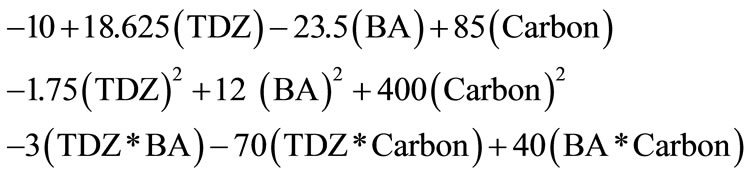 (4)
(4)
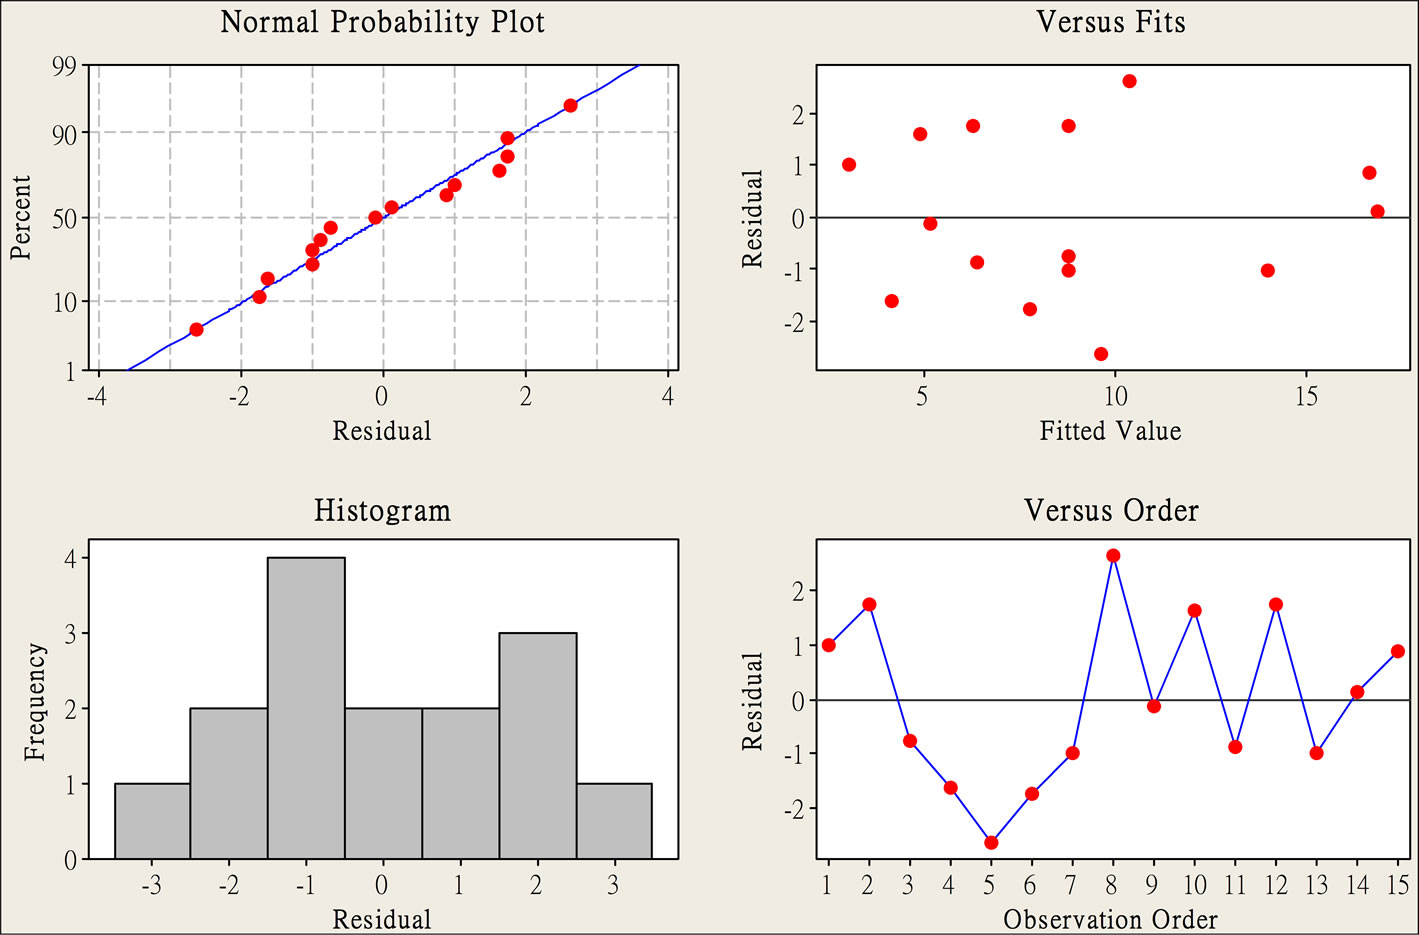
Figure 1. Residual plots for induced incidences (%).
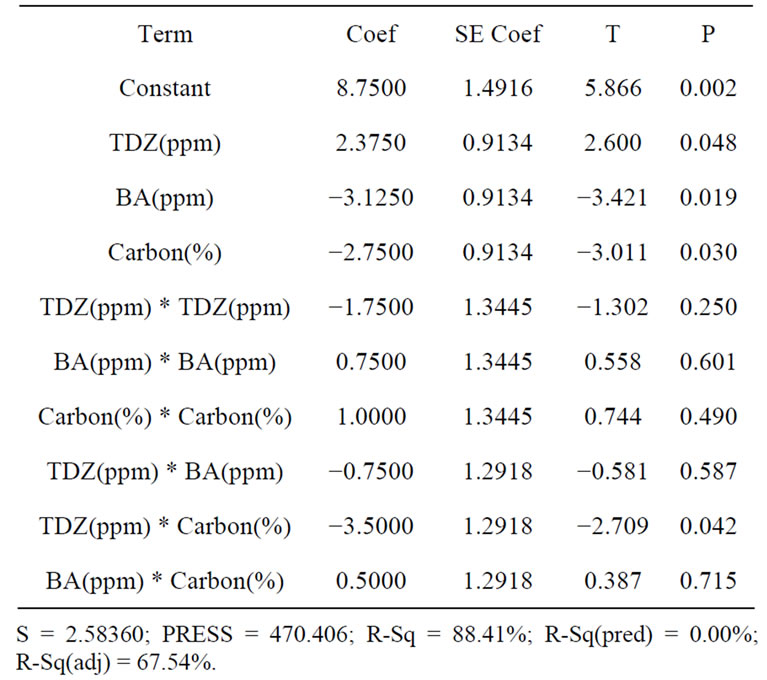
Table 4. Estimated regression coefficients for induced incidences (%).
4. The regression analysis results of the response data of adventitious bud growth number (as shown in Table 7) suggested that its explanatory power is 99.92%. Moreover, the induced incidence is at a significant state in the first order term and interactive term; however, the squared term fails to achieve the significant term. The ANOVA table (as shown in Table 8) indicates that, the square term failed to achieve a sig
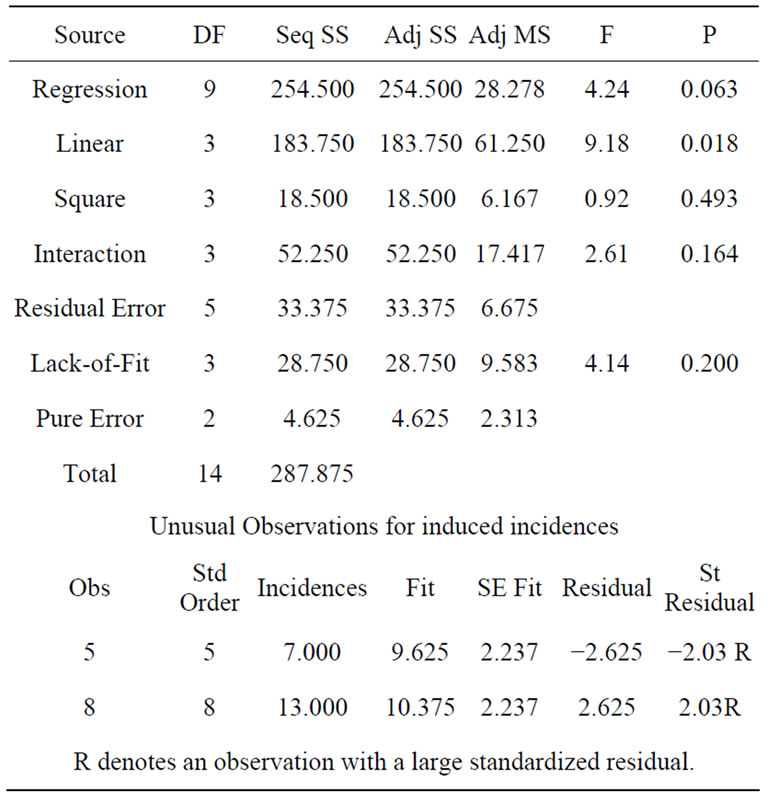
Table 5. Analysis of variance for induced incidences.
nificant state, suggesting that the influencing factors of adventitious bud induced incidence have interactions. The Lack-of-Fit values at the insignificant state of the ANOVA table (as shown in Table 8) suggest that, the model is free from Lack-of-Fit and fits the existing region. According to the four-in-on residual
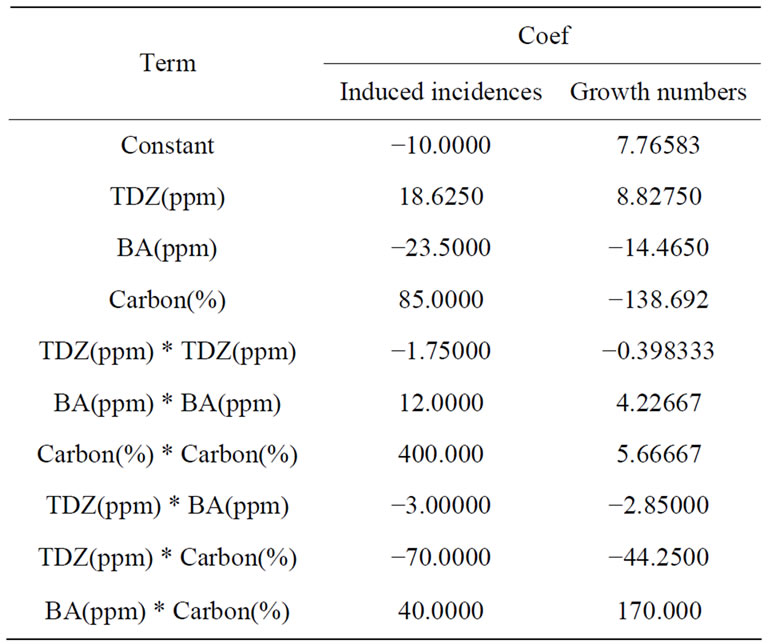
Table 6. Regression coefficients for induced incidences and growth numbers.
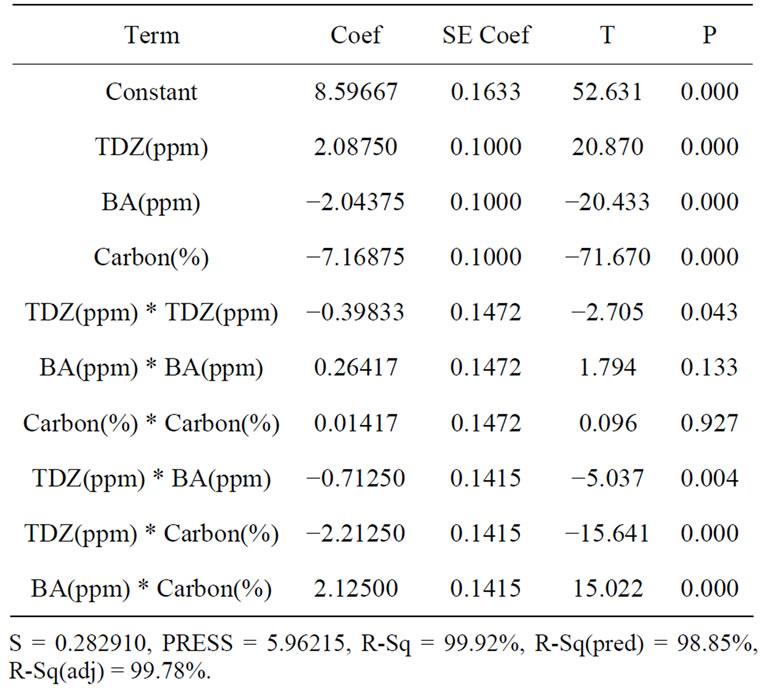
Table 7. Estimated regression coefficients for growth numbers.
plot of the adventitious bud growth number (as shown in Figure 2), the residual is roughly consistent with normality, independence, and variance consistency. Meanwhile, from the regression coefficient of the induction of the agarwood adventitious buds (as shown in Table 6), the regression equation for the induced incidence is:
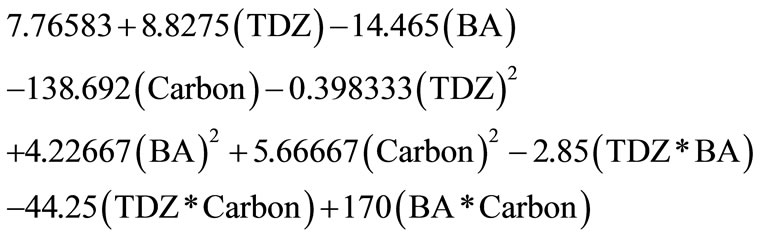 (5)
(5)
5. The analysis of the desire function of RSM, regarding the adventitious bud induced incidence and growth number, suggested that the combination of 4.0 ppm TDZ and 0.5 ppm BA, without activated carbon, is the best culture medium in terms of agarwood adventitious bud induced incidence and growth number, which can lead to induced incidence up to 21.75%, achievement probability up to 72.5%; adventitious bud growth number up to 24.8, achievement probability up to 82.76%, and synthesis probability up to 77.46% (as shown in Table 9).
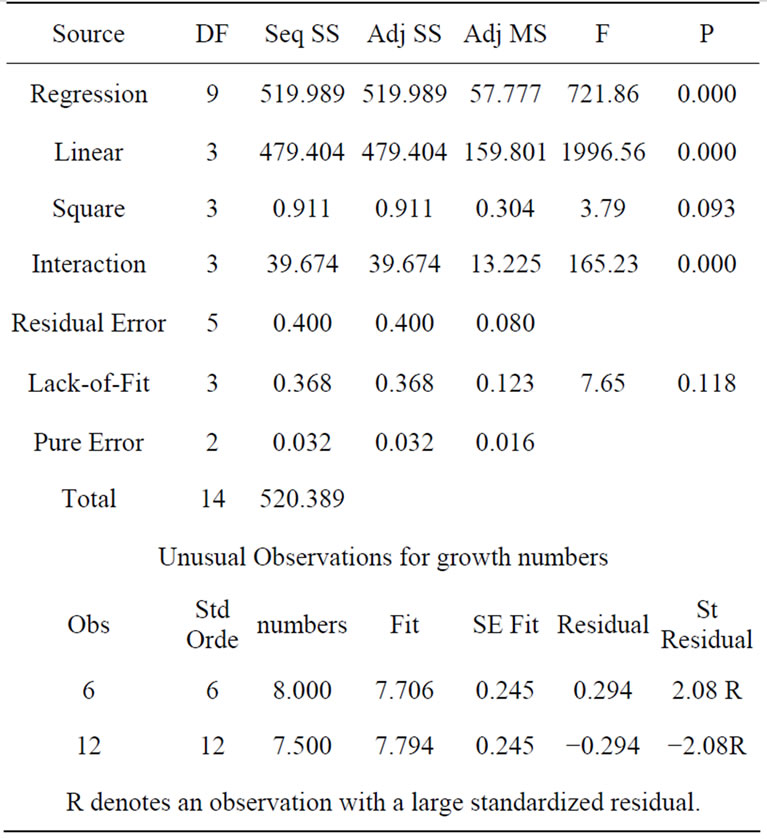
Table 8. Analysis of variance for growth numbers.
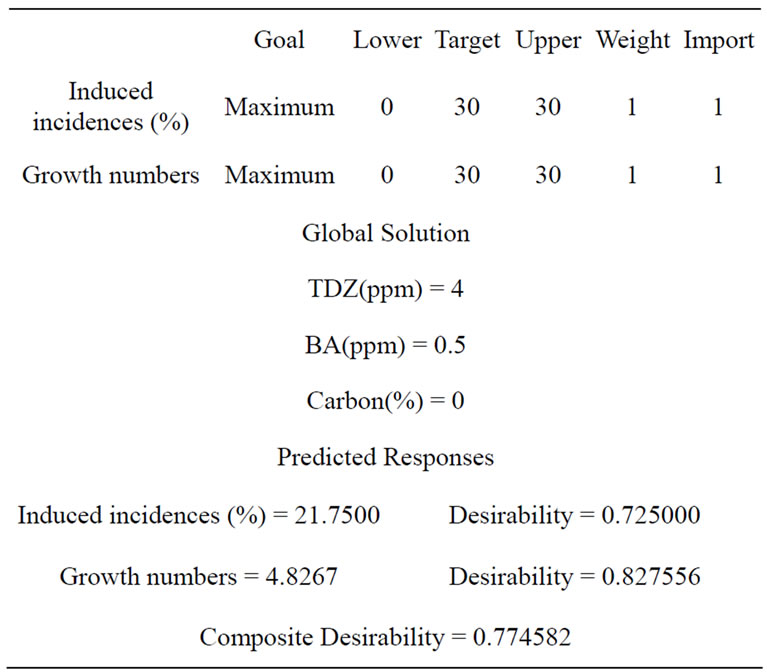
Table 9. Optimal parameters for combinations of TDZ, BA, and activated carbon.
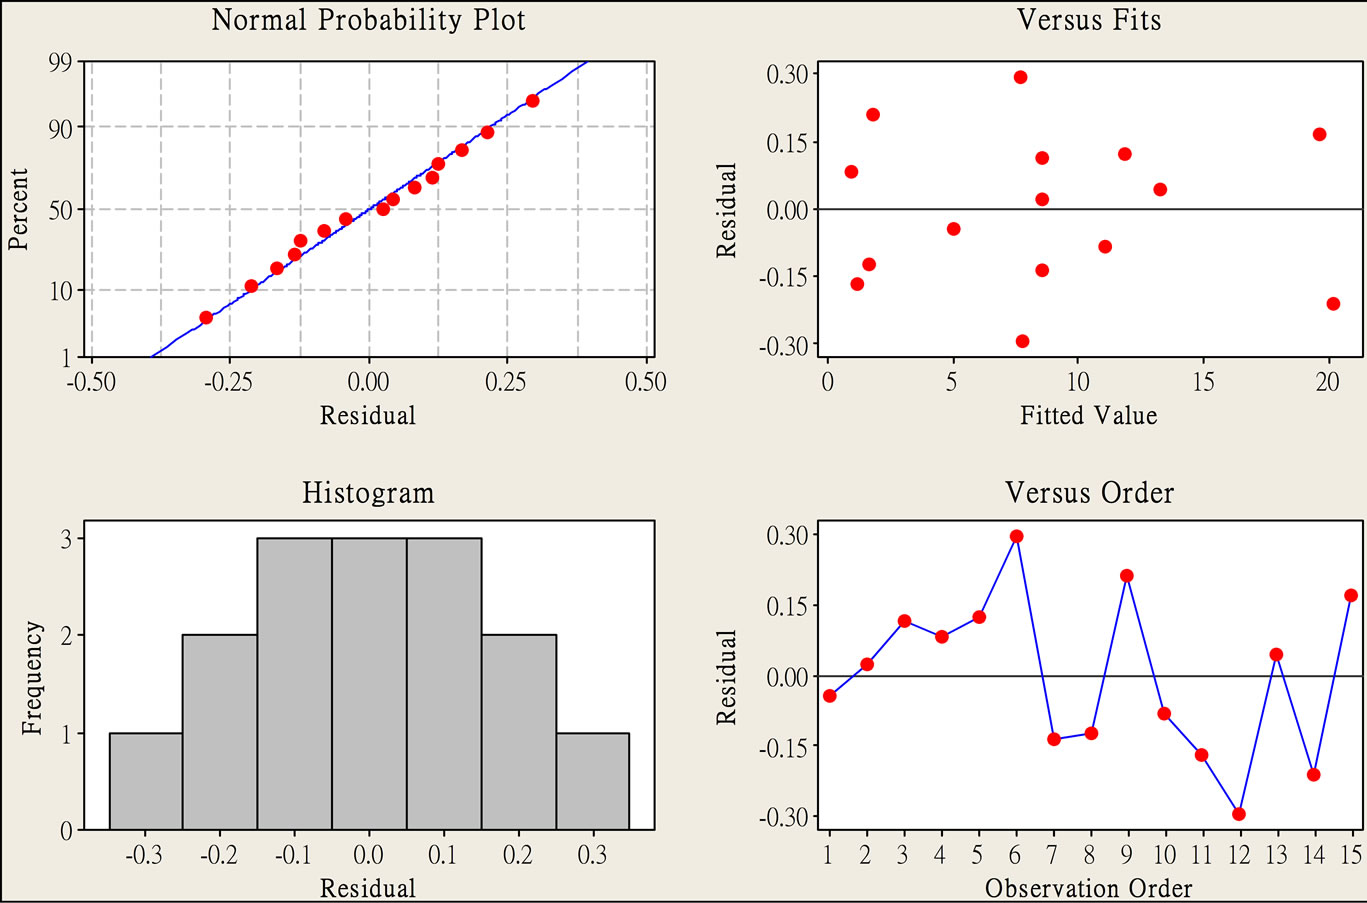
Figure 2. Residual plots for growth numbers.
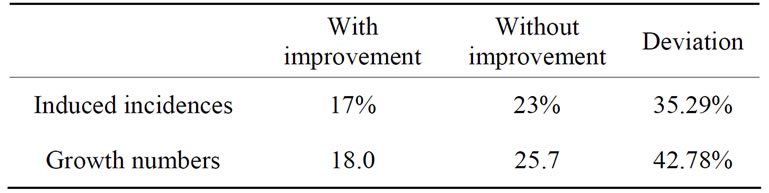
Table 10. Comparison of results.
4.5. Control
After obtaining the optimum growth regulators combination, this study formulated the standard operating procedures as the operating norms, and conducted experiments for validation using the optimum culture medium combination obtained by RSM analysis. The optimum culture medium combination is consisted of 4.0 ppm TDZ and 0.5 ppm BA, without activated carbon. Similarly, this study processed 10 growth points three times each, and planted them in the 3 × 8 test tubes. According to the testing results of the optimal culture medium combinations, the adventitious bud induced incidence is 23%, and adventitious bud growth number is 25.7. The improvements, as shown in Table 10, suggesting that the best culture medium combination, as identified in this study, can result in better adventitious bud induced incidence and growth number of agarwood.
5. Conclusion
The provenance of agarwood can be preserved by a sexual breeding of tissue culture to induce adventitious buds for large scale breeding. In order to improve agarwood tissue culture induction of adventitious buds, this study adopted six sigma, as well as DOE and RSM, for the optimization of adventitious bud induced incidence and growth number. The results showed that the combination of 4.0 ppm TDZ and 0.5 ppm BA, without activated carbon, was the best culture medium for the growth of agarwood. It can effectively induce the regeneration of the agarwood adventitious buds, and be used for large-scale production. The results verified that DOE coupled with RSM could effectively enhance agarwood tissue culture to induce adventitious buds, which directly enhanced large scale production and indirectly restored agarwood through the six sigma. These findings could serve as references in the promotion of six sigma in the research of tissue culture to effectively help the industry to improve relevant operations.
6. Acknowledgements
This study is supported by the National Science Council of Taiwan, Republic of China, under grant number NSC 101-2410-H-451-002 and 101-2622-E-451-002-CC3. I wish to thank my research assistant, Mr. Yue-Hong Tsai, a graduate student in the D.B.I.D. department.
REFERENCES
- M. L. He, S. Y. Qi and L. J. Hu, “Rapid in Vitro Propagation of Medicinally Important Aquilaria agallocha,” Journal of Zhejiang University Science, Vol. 6, No. 8, 2005, pp. 849-852. doi:10.1631/jzus.2005.B0849
- M. Antonopoulou, J. Compton, L. S. Perry and R. AlMubarak, “The Trade and Use of Agarwood (Oudh) in the United Arab Emirates,” TRAFFIC Southeast Asia, Petaling Jaya, 2010.
- P. S. Pande, R. P. Neuman and R. R. Cavanagh, “The Six Sigma Way Team Field Book: An Implementation Guide for Project Improvement Teams,” McGraw-Hill, New York, 2001.
- F. W. Breyfogle, J. M. Cupello and B. Meadows, “Managing Six-Sigma,” John Wiley & Sons, New York, 2001.
- K. Linderman, R. G. Schroeder, S. Zaheer and S. A. Choo, “Six Sigma: A Goal-Theoretic Perspective,” Journal of Operations Management, Vol. 21, No. 2, 2003, pp. 193- 203. doi:10.1016/S0272-6963(02)00087-6
- D. M. Himmelblau, “Process Analysis by Statistical Methods,” John Wiley and Sons, New York, 1970.
- H. M. Raymond and D. C. Montgomery, “Response Surface Methodology: Process and Product Optimization Using Designed Experiments,” Wiley, New York, 2002.
- M. A. Rahman and A. C. Basak, “Agar Production in Agar Trees by Artificial Indoculation and Wounding,” Bano Bigan Patrita, Vol. 9, No. 1-2, 1980, pp. 97-98.
- D. C. Montgomery, “Design and Analysis of Experiments,” 7th Edition, John Wiley & Sons, New York, 2009.
- G. Haberlandt, “First But Unsuccessful Attempt of Tissue Culture Using Monocots,” Sitzungsber Akad, Vol. 111, No. 1, 1902, pp. 69-92.
- T. Murashige and F. Skoog, “A Revised Medium for Rapid Growth and Bioassays with Tobacco Tissue Cultures,” Physiologia Plantarum, Vol. 13, 1962, pp. 473- 497. doi:10.1111/j.1399-3054.1962.tb08052.x
- T. Nagata and I. Takebe, “Plating of Isolated Tobacco Mesophyll Protoplasts on Agar Medium,” Planta, Vol. 99, No. 1, 1971, pp. 12-20. doi:10.1007/BF00392116
- I. Takebe, G. Labib and G. Melchers, “Regeneration of Whole Plants from Isolated Mesophyll Protoplasts of Tobacco,” Naturwissenschaften, Vol. 58, No. 6, 1971, pp. 318-320. doi:10.1007/BF00624737
- T. Murashige, “Plant Propagation through Tissue Culture,” Annual Review of Physiology, Vol. 25, 1974, pp. 135-166. doi:10.1146/annurev.pp.25.060174.001031
- D. A. Evans, W. R. Sharp and C. E. Flick, “Growth and Behavior of Cell Cultures: Embryogenesis and Organogenesis,” In: T. A. Thorpe, Ed., Plant Tissue Culture: Methods and Applications in Agriculture, Academic Press, New York, 1981.
- R. H. Myers and D. C. Montgomery, “Response Surface Methodology: Process and Product Optimization Using Designed Experiments,” 2nd Edition, John Wiley and Sons, New York, 2002.
- K. K. Vadde, V. R. Syrotiuk and D. C. Montgomery, “Optimizing Protocol Interaction Using Response Surface Methodology,” IEEE Transactions on Mobile Computing, Vol. 5, No. 6, 2006, pp. 50-56.
- G. E. P. Box and D. W. Behnken, “Some New Three Level Designs or the Study of Quantitative Variables,” Technometrics, Vol. 2, 1960, pp. 455-475. doi:10.1080/00401706.1960.10489912