Journal of Minerals and Materials Characterization and Engineering
Vol.06 No.01(2018), Article ID:81738,12 pages
10.4236/jmmce.2018.61004
Characterization of Natural Vuggy Fractured Porous Medium: Its Physicochemical Properties, Porosity and Permeability
E. T. Romero-Guzmán1*, L. R. Reyes-Gutiérrez2, J. Klapp1,3, H. Hernández-Mendoza4
1Instituto Nacional de Investigaciones Nucleares, Ocoyoacác, México
2División of Ciencias Básicas e Ingeniería, Department of Recursos de la Tierra, Universidad Autónoma Metropolitana-Lerma (UAM-L), Lerma, México
3Departamento de Matemáticas, Cinvestav del I.P.N., México, D.F., México
4Universidad del Centro de México, Tequisquiapan, México

Copyright © 2018 by authors and Scientific Research Publishing Inc.
This work is licensed under the Creative Commons Attribution International License (CC BY 4.0).
http://creativecommons.org/licenses/by/4.0/


Received: November 7, 2017; Accepted: January 9, 2018; Published: January 12, 2018
ABSTRACT
The aim of this work was to obtain the physicochemical properties by SEM, XRD, FTIR analyses and the surface characteristics from carbonate outcrops cores such as pore diameter, surface area, porosity and permeability. The methods used to characterize them were Scanning Electron Microscopy, SEM; X Ray Diffraction, DRX; Fourier Transform Infrared Spectroscopy, FTIR. The porosity and permeability of natural vuggy fractured porous medium from core samples was determined obtained in the laboratory with conventional procedures. The cores have smooth and rough surfaces with porous with several sizes. Some crystals appear in preferential zones mainly composed by calcium, carbon and oxygen. Apparently into free spaces were found the organic materials, organic residues of crude oil. The cores have smooth and rough surfaces with porous with several sizes. Some crystals appear in preferential zones composed by calcium, carbon and oxygen. Apparently into free spaces were found the organic materials, organic residues of crude oil. The main inorganic compound in cores is calcite, (CaCO3). The porosity was for porous core 26% and for solid core 8.5%. The values obtained show that the cores have permeability where the fluid migrates through the particles at 2.23 × 10⁻⁴ cm/s.
Keywords:
Core Microstructure, Naturally Fractured Reservoirs, Fractured Vuggs Formations, Core Porosity and Permeability

1. Introduction
In geologic materials of low hydraulic conductivity (K) such as fine-grained sedimentary rocks and crystalline rocks, diffusion is the principal mechanism of solute transport. Low permeability geologic materials are of interest for waste management programs, carbon sequestration and unconventional petroleum development. Diffusive solute transport occurs in response to concentration gradients and the solute diffuses through interconnected pores and/or fractures. Diffusion of aqueous solute in a porous medium is constrained within the water- saturated portion of the pore spaces, which results in reduced mass flux compared to a comparable cross-section in a homogeneous solution. The decrease in mass flux is inversely proportional to diffusion accessible porosity [1] .
Porosity is one of the most fundamental parameters describing porous media [2] [3] . Moreover, its correct quantification is essential for flow, heat and mass transfer parameters such as permeability, tortuosity, thermal conductivity and diffusion coefficient [3] .
Porosity of sedimentary porous media is of great interest in many fields of research, e.g., in oil and natural gas extraction, in monitoring of contaminant percolation and in characterizing the dynamics of cracking and material failure. Porosity is defined as the ratio of the volume of pore space to the bulk volume of material and, for a saturated material, can be determined from knowledge of the quantity of fluid occupying the sample pore space. Traditional methods for core analysis are based on bulk measurement, which will average over any heterogeneity present in the sample [2] . Fossil fuels will account for 80 percent of the worlds primary energy mix by 2030.
New developments in science and technology cannot guarantee the future global energy demand that is expected to grow during the next 20 years; a more realistic solution lies in sustaining and increasing production from existing fields, the vast majority in fractured carbonate reservoirs. Therefore, it is necessary to better understand fluid flow mechanisms in reservoir system in order to achieve optimum recovery.
A significant percentage of oil and gas reserves are trapped in fractured carbonate reservoirs―more than 60 percent of the world’s proven oil reserves, and 40 percent of its gas reserves. While increasing oil and gas production from carbonate reservoirs may not be the only solution to meeting forecast energy demand, it is clear that these reservoirs will play an increasingly important role in the future of our industry.
Carbonate reservoirs are considered to be extremely challenging in terms of accurate recovery prediction because of their complexity and heterogeneity. Most carbonate reservoirs are naturally fractured and contain fractures that can range from isolated microscopic fissures to kilometer-wide collections called fracture swarms or corridors. These fractures create complex paths for fluid movement which impact reservoir characterization, and ultimately, production performance and total recovery [4] .
Naturally fractured reservoirs present many challenges. The uncertainties related to the size of the physical structure and the reservoir fluid content, make understanding fluid flow unpredictable. In this work, we used some techniques to determine the fracture properties for understanding the reservoir and its fluid flow mechanisms [5] . However, most studies have primarily focused on naturally fractured reservoirs without taking into consideration large cavities. Recently, vuggy fractured rock characterization has received attention, because a number of fractured vuggy reservoirs have been found worldwide that can significantly contribute to oil and gas reserves and production [6] [7] . The motion and distribution of fluids across the porous means are determined by its geometry. The nature of the structure has been the object of numerous studies [8] . The asphalt system has a colloidal nature and is not a true solution. It can be fractionated into saturates, aromatics, resins, and asphaltenes by solvent fraction methods, saturates-aromatics-resins-asphaltenes (SARA) [9] .
Asphaltene is a fraction of petroleum crude materials conventionally defined as the fraction insoluble in n-heptane but soluble in toluene [10] . It contains millions of different molecules. Short alkyl chains are attached to these rings. Many asphaltenes contain small amounts of heteroatoms such as nitrogen, oxygen, and sulfur. Trace amounts of nickel and vanadium are often found in asphaltene as well. Because of this complex composition, asphaltene reveals very interesting properties. The high asphaltene concentration in some fractions such as vacuum residue is responsible for many problems encountered during production, transportation, and refining processes [11] . A detailed examination of the literature on asphaltene characterization shows that the major studies that have been carried out concern chemical characterization [12] . Nevertheless, it seems that this information is not sufficient to explain some frequently observed unusual behaviors [13] .
The aim of this work is to characterise cores from a naturally fractured porous media and to determine the permeability property to determine the crude oil sorption behaviour.
The ki (intrinsic permeability) dimensions are (L2), or area. The relationship between hydraulic conductivity and intrinsic permeability is Equation (1):
(1)
where is the water density, is the acceleration of gravity and is the water viscosity.
Units for can be square feet, square meters, or square centimetres. In the petroleum industry, the darcy is used as a unit of intrinsic permeability, (the petroleum engineer is similarly concerned with the occurrence and movement of fluids through porous media). Both the viscosity and the density of a fluid are functions of its temperature. The viscosity increases with decreasing fluid temperature [14] .
2. Experimental Procedure
2.1. Preparation of Material
The naturally fractured media were collected from reserves in Campeche City, Mexico. The materials were collected into polyethylene bags and transported to the Instituto Nacional de Investigaciones Nucleares (ININ) laboratory. The samples were cut from a limestone outcrop boulder collected near Campeche México. The core has vuggy porosity which can be observed from its surface and size, Figure 1(a).
The vugg sizes were determined to be 1.4 - 11.4 mm. It is observed from surface photos that there are several regions. Nute colored regions in the sample correspond to the matrix. The collected samples were cut into small pieces and analyze by several techniques, Figure 1(b). Especially the size of the cubes to determine porosity was 1.26 inches × 1.26 inches × 1.26 inches.
When the material was cut, organic material remains from the pores. The vuggs in dark color contain organic material which was analyzed. These samples were used in the experiments too, Figure 2.
2.2. Physicochemical Characterization of Cores
With respect to the bulk.

Figure 1. (a) The core has vuggy porosity which can be seen from surface and size; (b) The core has no vuggs like the other.

Figure 2. Vuggs containing organic material (in dark color).
2.2.1. Morphology and Elemental Composition
Scanning Electron Microscopy (SEM) was used to study the morphology of the matrix of carbonates cores [15] through a scanning electron microscope, model JEOL 5900 LV, at 25 kV. The samples were mounted on an aluminium holder with a cupper conductive tape. In all cases, the images were obtained with a backscattered electron detector. Energy X-ray Dispersion Spectroscopy (EDS) determined the semi-quantitative elemental chemical compositions of the samples with an EDAX-4 spectrometer.
2.2.2. Crystalline Components
An X-ray diffraction analysis was performed for the samples [15] . The samples were placed in a holder of Lucite and then on the goniometer of the diffractometer (Siemens D-5000 diffractometer with a copper anode X-ray tube with λ = 1.543 Å). Kα radiation was selected with a diffracted beam monochromator at 25 kV and 2θ steps of 0.02˚ for 50 min to acquire X-ray patterns from 4˚ to 70˚, with high enough intensities to achieve the lines to identify in angle 2θ the mineral components of the analyzed material. Compounds were identified by comparing the diffraction patterns to the Joint Committee on Powder Diffraction Standards (JCPDS) using conventional methods [16] [17] .
2.2.3. Functional Groups
The infrared analysis was performed with solid samples using a Nicolette 550 IR spectrophotometer with the KBr disc method [18] . The samples were scanned from 4000 cm−1 to 400 cm−1.
With respect to the surface
2.2.4. Specific Surface
Specific surface (As, m2g−1) were determined for both dry and degassed natural materials using a multipoint N2 adsorption/desorption Brunauer-Emmett-Teller (BET) method at room temperature in a Micromeritics Gemini 2360 surface area analyzer.
2.2.5. Presence of Bitumen into Nute Core
The bitumen remains from the nute core with vuggs, porous system, were examined by SEM too in order to verify the absence or presence of carbon and sulphur like main components of the bitumen.
2.3. Hydrodynamic Experiments
2.3.1. Experimental Procedure
Water displacement within cores is presented. This system was built with two pieces from core wet material simulating a natural vuggy fractured porous medium. The time and water volume were determined.
2.3.2. Porosity Determination
The porosity of a rock is the percentage of pore space. The samples were oven at 65˚C and weighed daily until a constant mass was achieved. The final mass was recorded as the dry mass in air. The samples were then completely saturated with water and again weighed first in air and then while submerged in water. The porosity for each sample was determined as the ratio of the volume occupied by water at full saturation (Vw) to the volume of sample (Vs). Since the density of water is approximately equal to 1 g/mL, porosity was calculated for each sample as Equation (2) [1] :
(2)
where:
= volume of voids and pores.
= total (bulk) volume of the rock.
2.3.3. Permeability Determination
Permeability in oil-bearing rocks indicates the relative ease with which oil will flow through the rock. Most sandstone is very permeable; granites have extremely low permeabilities and may be impermeable for practical purposes. Limestones can vary greatly from low permeability in a hard, well-cemented limestone without much porosity (like some of the British Carboniferous Limestone) to high permeability in a porous oolite (such as the Portland Stone).
In terms of petroleum geology, permeability is usually measured in millidarcies. The term “darcy” comes from water supply or hydrogeological studies based on the work of Henry Darcy [19] .
Technically, a darcy is “the permeability that will allow a flow of 1 cubic centimeter per second of a fluid with 1 centipoise viscosity (resistance to flow) through a distance of 1 centimeter through an area of 1 square centimeter under a differential pressure of 1 atmosphere”.
3. Results and Discussion
3.1. Physicochemical Characterization of Cores from Naturally Fractured Media
With respect to the bulk.
3.1.1. Morphology and Elemental Composition
The cores from naturally fractured media considered in this work were nute and gray colours. The SEM images 20, 95, 100 and 250 magnifications for naturally fractured media are shown in Figure 3.
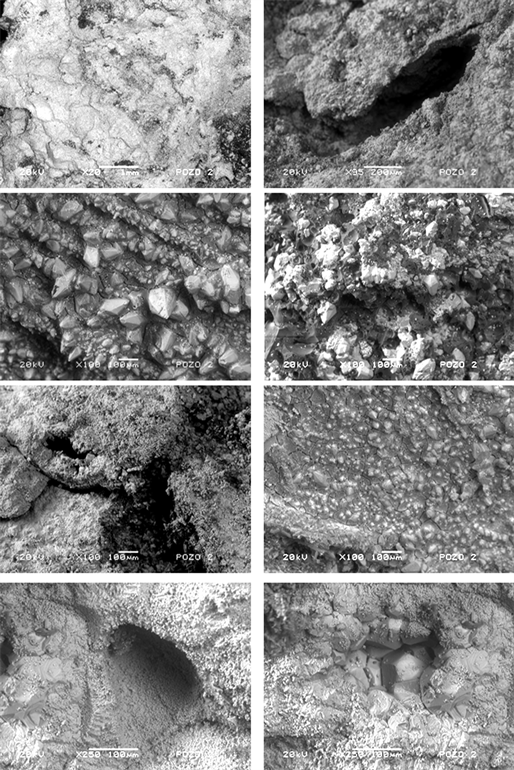
Figure 3. Characteristic morphology of oil nucleus from naturally fractured media. The inhomogeneity of the material is clearly observed.
In the first case, low magnifications of material showed particles with both smooth and rough surfaces. Some stress lines can be observed. In these figures can be observed that the surface is mainly compacting with porous with several sizes. Some crystals appear in preferential zones mainly composed by calcium, carbon and oxygen. Apparently into free spaces were found the organic materials, organic residues of crude oil. From observation of these micrographs, it is apparent that the material has a porous structure with a large surface area, as will be discussed later.
In conjunction with electron microscopy, elemental chemical composition was determined. The identifications of surface features were performed by qualitative EDS analyses. The EDS results are: carbon (35%), oxygen (33%), magnesium (0.23%), aluminium (0.74%), silicium (0.18%), sulfur (1.42%) and calcium (30%), Figure 4.
The crude oil residue was analyzed using LV-SEM. The crude oil residue morphology is shown in Figure 5. It is a heterogeneous material with a smooth surface. Some particles of different composition emerged from it. The elemental composition of crude oil residue, determine by EDS, is based on carbon (75%), oxygen (17%), magnesium (0.06%), aluminium (1%), silicium (0.04%), sulfur

Figure 4. EDS spectrum showing high abundance of the elements from cores.

Figure 5. Characteristic morphology of crude oil residue. The inhomogeneity of the material is clearly observed.
(4%) and calcium (2%).
3.1.2. Crystalline Components
According to the Joint Committee on Powder Diffraction Standard (JCPDS, cards No. 85-1108 (porous core) and No. 85-0849 (solid core) [16] , the main inorganic compound present in cores from naturally fractured media is calcite, (CaCO3) which is a crystalline compound. The main intensity for both materials is at 29.466˚ of 2θ, Figure 6.
3.1.3. Functional Groups
FTIR spectra (4000 cm−1 to 400 cm−1) of oil nucleus shows naturally fractured media show that both studied materials has the vibrational frequencies similar, the band at 3432 cm−1 is for O-H stretching, at 1800 cm−1, 1422 - 1429 cm−1 and 875 cm−1 bands are vibrations representatives of carbonates group.
With respect to the surface
3.1.4. Specific Surface
The specific area and other surface properties for the cores by the BET method are shown in Table 1. This shows that the surface diameter and total pore volume are major in the porous core material.
3.2. Porosity and Permeability Determinations.
The porosity of a rock is the percentage of pore space. The results of this deter

Figure 6. XRD patterns that show the intensity of diffracted X-rays from various planes as a function of 2θ value for the analyzed cores.

Table 1. Surface properties of cores analyzed.
Table 2. Hydrodynamics parameters from the analyzed cores.
Marica et al., 2006: Porosity, % 9.3, 20.8, 22.8, 22.9, 25
mination are shown in Table 2. This shows the hydrodynamics parameters from the analyzed cores. The porosity of the porous core is major than the solid core, then the ki and k are minor than solid material. Marica et al., 2006 [2] reported values of porosity (% 9.3, 20.8, 22.8, 22.9, 25) similar tan reported here.
4. Conclusion
The studied materials have porous microstructures with similar elemental composition. The calcium carbonate is the main inorganic compound present in both cores according XRD. All the techniques used confirmed that the main composition is of carbonate nuclei. The porosity and permeability of natural vuggy fractured porous medium from core samples was determined obtained in the laboratory with conventional procedures. The values obtained show that the cores have permeability where the fluid migrates through the particles at 2.23 × 10⁻⁴ cm/s.
Acknowledgements
This work has been partially supported by ABACUS, CONACyT (Mexico) grant EDOMEX-2011-C01-165873. Thanks to Dr. Abraham Medina Ovando from Instituto Politécnico Nacional for the cores to analyzed.
Cite this paper
Romero-Guzmán, E.T., Reyes-Gutiérrez, L.R., Klapp, J. and Hernández-Mendoza, H. (2018) Characterization of Natural Vuggy Fractured Porous Medium: Its Physicochemical Properties, Porosity and Permeability. Journal of Minerals and Materials Characterization and Engineering, 6, 38-49. https://doi.org/10.4236/jmmce.2018.61004
References
- 1. Agbogun, H.M.D., Al, T.A. and Hussein, E.M.A. (2013) Three Dimensional Imaging of Porosity and Tracer Concentration Distributions in a Dolostone Sample during Diffusion Experiments Using X-Ray Micro-CT. Journal of Contaminant Hydrology, 145, 44-53. https://doi.org/10.1016/j.jconhyd.2012.11.008
- 2. Marica, F., Chen, Q., Hamilton, A., Hall, C., Al, C. and Balcom, B.J. (2006) Spatially Resolved Measurement of Rock Core Porosity. Journal of Magnetic Resonance, 178, 136-141. https://doi.org/10.1016/j.jmr.2005.09.003
- 3. Khalili, A., Mohammad Reza Morad, M., Matyka, M., Liu, B., Malekmohammadi, R., Weise, J. and Kuypers, M. (2014) Porosity Variation below a Fluid-Porous Interface. Chemical Engineering Science, 107, 311-316. https://doi.org/10.1016/j.ces.2013.12.021
- 4. Cruz, J., Islas, R., Pérez, C., Rivas, S., Pineda, A. and González, J. (2001) Desplazamiento de aceite por agua en medios porosos fracturados vugulares. Ciencia Ergo Sum, 8, 1.
- 5. Schlumberger (2008) Characterization of Fractured Reservoirs: Reliable, Predictive Models to Optimize Carbonate Reservoir Performance. 1-6.
- 6. Wu, Y.S. Di, Y., Kang, Z.J. and Fakcharoenphol, P. (2011) A Multiple-Continuum Model for Simulating Single-Phase and Multiphase Flow in Naturally Fractured Vuggy Reservoirs. Journal of Petroleum Science and Engineering, 78, 13-22. https://doi.org/10.1016/j.petrol.2011.05.004
- 7. Guerreiro, V., Mazzoli, S., Iannace, A., Vitale, S., Carravetta, A. and Straus, C. (2013) A Permeability Model for Naturally Fractured Carbonate Reservoirs. Marine and Petroleum Geology, 40, 115-134. https://doi.org/10.1016/j.marpetgeo.2012.11.002
- 8. Johnson, D.L., Koplik, J. and Dashen, R. (1987) Theory of Dynamic Permeability and Tortuosity in Fluid-Saturated Porous Media. Journal of Fluid Mechanics, 176, 379-402. https://doi.org/10.1017/S0022112087000727
- 9. Kokal, S.L. and Sayegh, S.G. (1995) Asphaltenes: The Cholesterol of Petroleum. One Petro. Society of Petroleum Engineers. https://doi.org/10.2118/29787-MS
- 10. Avid, B., Sato, S., Takanohashi, T. and Saito, I. (2004) Characterization of Asphaltenes from Brazilian Vacuum Residue Using Heptane-Toluene Mixtures. Energy Fuels, 18, 1792-1797. https://doi.org/10.1021/ef049960n
- 11. King, S.R. and Cotney, C.R. (1996) Development and Application of Unique Natural Solvents for Treating Paraffin and Asphaltene Related Problems. Onepetro. Society of Petroleum Engineers. https://doi.org/10.2118/35265-MS
- 12. Barré, L., Espinat, D., Rosenberg, E. and Scarsella, M. (1997) Colloidal Structure of Heavy Crudes and Asphaltene Soltutions. Oil & Gas Science and Technology-Rev. IFP, 52, 161-175. https://doi.org/10.2516/ogst:1997015
- 13. Sánchez Berna, A.C., Camacho Morán, V., Romero Guzmán, E.T. and José Yacamán, M. (2006) Asphaltenes Aggregation from Vacuum Residue and Its Content of Inorganic Particles. Petroleum Science and Technology, 24, 1055-1066. https://doi.org/10.1081/LFT-200053891
- 14. Fetter, C.W. (1994) Applied Hydrogeology. 3rd Edición, Mcmillan College Publishing Company, New York, 80-90.
- 15. Mur, A., Purcell, C., Soong, Y., Crandall, D., McLendon, R., Haljasma, I.V., Warzinski, R., Kutchko, B., Kennedy, S. and Harbert, W. (2011) Integration of Core Sample Velocity Measurements into a 4D Seismic Survey and Analysis of SEM and CT Images to Obtain Pore Scale Properties. Energy Procedia, 4, 3676-3683. https://doi.org/10.1016/j.egypro.2011.02.299
- 16. Bayliss, P. (1986) Mineral Powder Diffraction File Date Book: Swarthmore, PA, Joint Committee on Powder Diffraction Standards (JCPDS).
- 17. Luna, Z.D., Romero Guzmán, E.T. and Reyes-Gutiérrez, L.R. (2009) Surface and Physicochemical Characterization of Phosphates Vivianite, Fe2(PO4)3 and Hydroxyapatite, Ca5(PO4)3OH. J. Minerals & Materials Characterization & Engineering, 8, 591-609. https://doi.org/10.4236/jmmce.2009.88052
- 18. Williams, D.H. and Fleming, I. (1980) Spectroscopic Methods in Inorganic Chemistry. 3rd Edición, Mc Graw Hill, Reino Unido, 42.
- 19. West, I.M. (2014) Petroleum Geology of the Weald-Shale Oil. http://www.southampton.ac.uk/~imw/Petroleum-Geology-Weald-Shale.htm