Journal of Minerals and Materials Characterization and Engineering
Vol.1 No.5(2013), Article ID:36683,5 pages DOI:10.4236/jmmce.2013.15034
The Study of Reaction Sequences for Formation of Solid Solution of Ceramic Material: Pb1-2XSmxNdx[(Zr0,55Ti0,45)1-0.02,0.01(Y2/3,Mo1/3),0.01 (Y2/3,Ni1/3)]O3 and the Study of These Structures
1University of Biskra, Biskra, Algeria
2University of Ouargla, Ouargla, Algeria
Email: Kribaa_keltoum@yahoo.fr, aboutarfaia@yahoo.fr
Copyright © 2013 Oum Keltoum Kribaa, Ahmed Boutarfaia. This is an open access article distributed under the Creative Commons Attribution License, which permits unrestricted use, distribution, and reproduction in any medium, provided the original work is properly cited.
Received June 17, 2013; revised July 19, 2013; accepted July 30, 2013
Keywords: Ceramic; Microstructure; X-Ray Diffraction; Infrared Spectroscopy (FTIR)
ABSTRACT
This work is aimed to synthesize new type ceramic materials: Pb1-2XSmxNdx[(Zr0,55Ti0,45)1-0.02,0.01(Y2/3,Mo1/3),0.01(Y2/3,Ni1/3)]O3 of structure perovskite in the presence of the doping agents: NiO, Sm2O3, Y2O3, Nd2O3 and MoO3 near the morphotropic phase boundary. These ceramics worked out by solid way, we present the preparation and the different stages of the formation reaction of the solid solution. Then we will detail the different techniques of analysis applied to this compound; we begin by the X-ray diffraction in the following by analysis spectroscopic (FTIR), analysis by scanning electron microscopy (SEM) and finally analysis by spectrometric energy dispersive (EDS). These studies help us to accumulate as much information on these materials.
1. Introduction
The crystallization of bulk ceramics called “bulk” type PZT is governed by sequences of reactions from three oxides PbO, ZrO2 and TiO2 [1,2]. These reactions are now well known. However, several studies have been made and several conclusions were drawn about the reaction sequences of formation of the solid solution PZT. There are many ways of developing piezoelectric materials that can be classified into both physically and chemically. The method of preparation is the most famous ceramic method; this method of synthesis involves reacting at high temperature (around 800˚C) a mixture of oxides. The simple ceramic method has some drawbacks: first the reaction at high temperature may cause volatilization of PbO which makes the non-stoichiometric PZT, the second disadvantage is the slow reaction, the increase in temperature accelerates the reaction because the diffusion through the solid is faster than ordinary temperature, it is important that the starting materials are well crushed to reduce the grain size they are very well blended for maximum contact area and reduce the distance of diffusion of the reagents [3].
This part of work describes the manufacturing process of new type materials:
Pb1-2XSmxNdx[(Zr0,55Ti0,45)1-0.02,0.01(Y2/3,Mo1/3),0.01 (Y2/3,Ni1/3)]O3 and their reaction mechanism, all preparations were made at temperatures not exceeding 800˚C, it gives then the results of the study radio crystallographic. In this work, the main purpose is to study the reaction sequences of formation of solid solution of PZT perovskite structure in the presence of doping NiO, Sm2O3, Y2O3, MoO3 and Nd2O3. We present the preparation and the different stages of the formation reaction of the solid solution. Then we will detail the different techniques of analysis applied to this compound, we begin first by X-ray diffraction, in the following by analysis spectroscopic (FTIR), analysis by scanning electron microscopy (SEM) and finally analysis by spectrometric energy dispersive (EDS). These studies help us to accumulate as much information on these materials.
Previous Work
Several studies were conducted by different researchers [4] in order to show the reactions that occur during formation of ceramics. In general the results reported in different studies show that lead titanate PbTiO3 is the first reaction product to be formed [4-6]. However, when using a submicron ZrO2 powder prepared chemically, the formation of PbZrO3 is earlier than that of PT. This PZ, the intermediate product, was not observed in most other work, with the exception of Ohno et al. [6], which reveal its formation and reaction with PT to form the PZT solid solution and also Yamaguchi et al. [6] who reported the possible formation of PZ but only under certain conditions.
The reaction sequence according to some researchers: Mori et al. [7] proposed two reaction steps:
PbO + ZrO2 + TiO2 → (PbTiO3 + ZrO2)ss
(PbTiO3 + ZrO2 )ss → Pb (Zr1-x, Tix)O3
Speri [8] proposed a three step process:
PbO + TiO2 → PbTiO3
PbTiO3 + PbO + ZrO2 → (PbO)ss
(PbO)ss + PbTiO3 + ZrO2 → Pb (Zr1-x, Tix)O3
(PbO)ss is a solid solution of tetragonal ZrO2 containing PbO and PbTiO3.
Hankey and Biggers [9] presented a reaction sequence consistent with Speri, but at different temperatures for each reaction step. Kingon, Terblanche and Clark [8] proposed a process of homogenization; they confirmed the formation of PbO ss in special experimental conditions, the final step in a reaction intermediate of PZT rich in PbTiO3 PZT with rich PbZrO3.
Matsio and Sasaki [1] were proposed:
PbO + TiO2 → PbTiO3
PbTiO3 + PbO + ZrO2 → PbTiO3 + (PZxT1-x)
PbTiO3 + (PZxT1-x) → PZT Biggers and Venkataramani [10] reported the reaction sequence for two sources of ZrO2 synthesized and commercial a different reaction sequence occurred which depends on the ZrO2 used. ZrO2 synthesized gives the formation of an intermediate phase PbZrO3 and training of PZT at 500˚C. ZrO2 the introductory commercial formation of a phase webmail PbTiO3 and the formation of PZT to 800˚C. Chandratreya [11] has reported on the reaction mechanisms of the formation of PZT solid solution. He found that the PbTiO3 forms between 450˚C and 600˚C and the PZT is formed above 700˚C against any PbZrO3 formation was detected.
2. Experimental Procedure
The synthesis of a new ceramic material (Table 1):
Pb1-2XSmxNdx[(Zr0,55Ti0,45)1-0.02,0.01(Y2/3,Mo1/3), 0.01(Y2/3,Ni1/3)]O3.
From a mixture of oxide is mainly in a few steps: The amount of starting materials required for the synthesis is calculated and then weighed and mixed with acetone for 6 h for homogenization. In later dried at 100˚C in an oven for 12 h. The powder of the initial mixture is manually ground with a glass mortar for 4 h, and then the powder is compacted in the form of pellets 2 g mass. The pellets obtained are brought to the calcinations at temperatures of about 600˚C, 700˚C, 750˚C and 800˚C in a programmable oven and under an ambient atmosphere with a heating rate of 2˚C/min to a temperature maintained constant for two hours. Cooling the resulting materials is slow. No weight change was observed.
3. Results and Discussion
3.1. Analysis by “X-Ray Diffraction”
The various diagrams of X-ray diffraction were obtained using a Bruker-AXS D8 diffractometer installed at the Laboratory of what RX (University of Biskra. ALGERIA) equipped with a copper anticathode. In order to have a monochromatic radiation, the device is equipped with a monochromator which selects the wavelength corresponding to the Kα radiation of copper: 1.5405 A. To perform the measurements, the voltage applied by the generator is 40 kV and the current is 40 mA. The diffractograms are recorded at room temperature, and 2 theta between 10˚ and 90˚.
The diffraction pattern of the powder mixed oxides uncalcined (room temperature). This chart shows the characteristic lines of basic oxides PbO, ZrO2 and TiO2 without secondary phases that indicate the absence of any reaction between these oxides during milling. The doping oxides are in very small quantities in the initial mixture; no characteristic peak appears on this diagram.
Figures 1-4 show the X-ray diffraction pattern of the
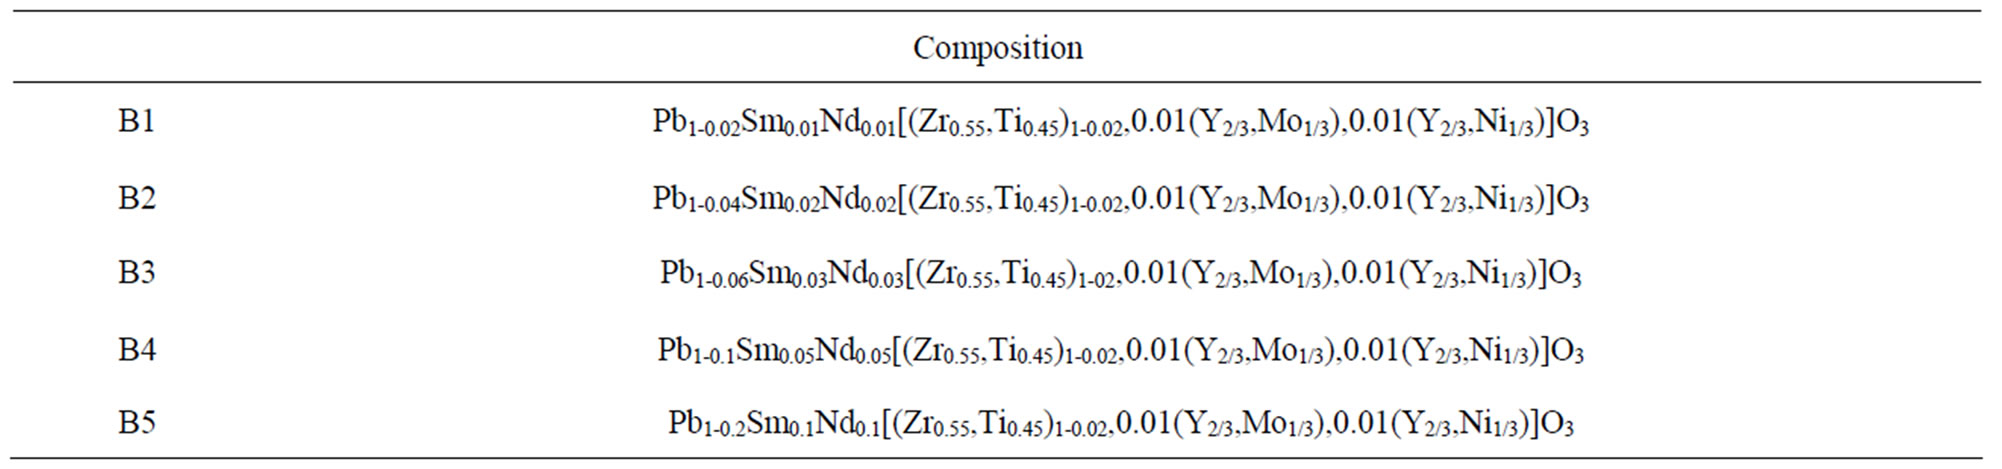
Table 1. Composition of: B1-B2-B3-B4-B5.

Figure 1. X-ray diffraction diagram of the mixture calcined at 600˚C.
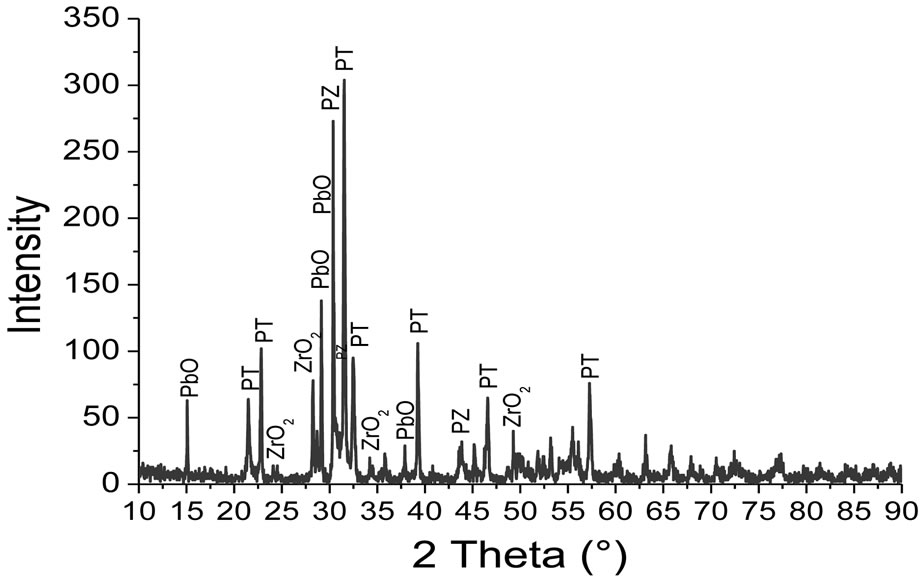
Figure 2. X-ray diffraction diagram of the mixture calcined at 700˚C.
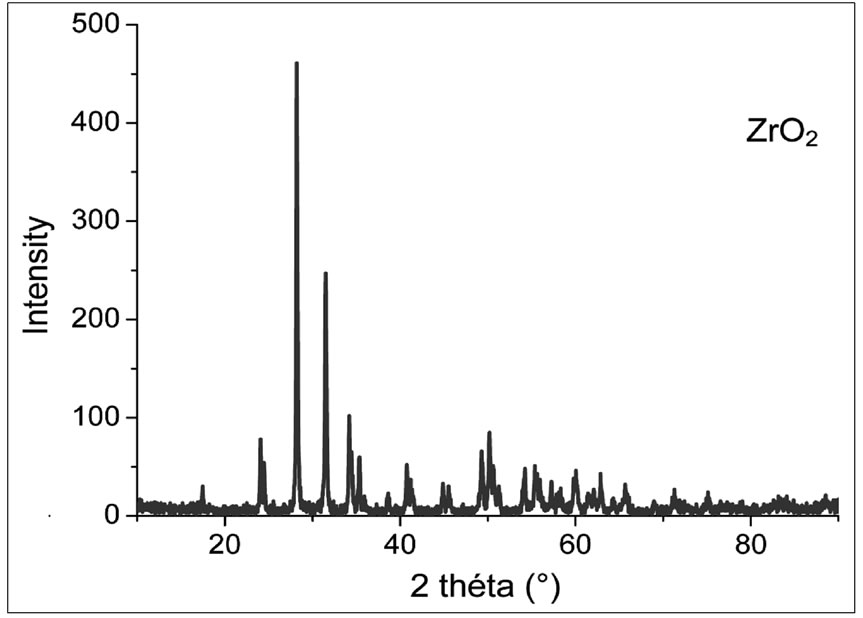
Figure 3. X-ray diffraction diagram of the mixture calcined at 750˚C.
Powder mixed oxides calcined at 600˚C, 700˚C, 750˚C and 800˚C respectively.
Figure 5 shows the X-ray diffraction pattern of the sample B2 sintered at 1100˚C, 1150˚C and 1180˚C.
3.2. Analysis of Phases by Infrared Spectroscopy in Fourier Transmission “FTIR”
The different spectra FTIR were obtained using a Shi-
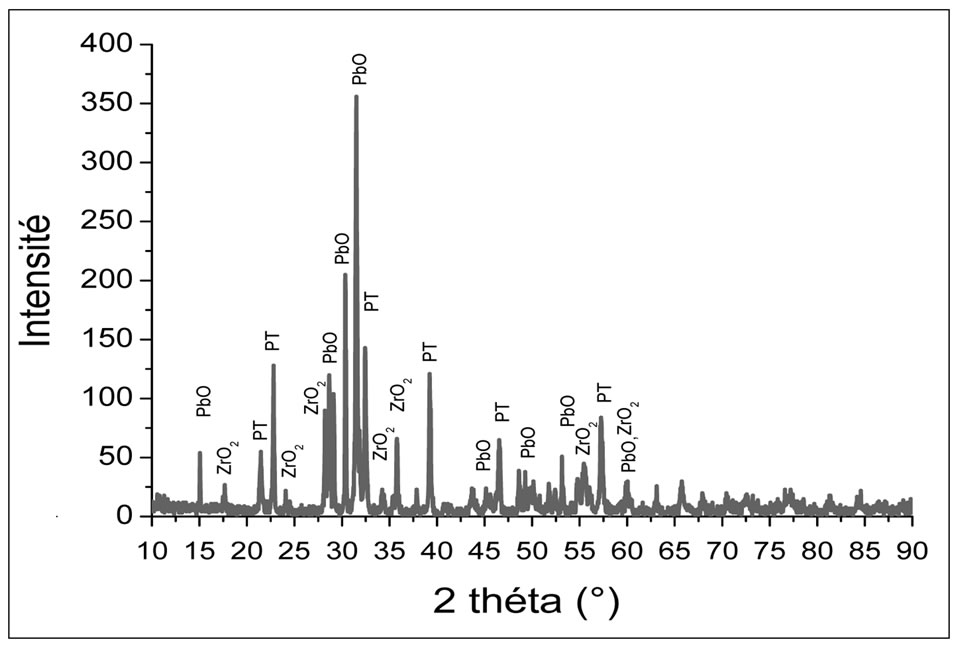
Figure 4. X-ray diffraction diagram of the mixture calcined at 800˚C.
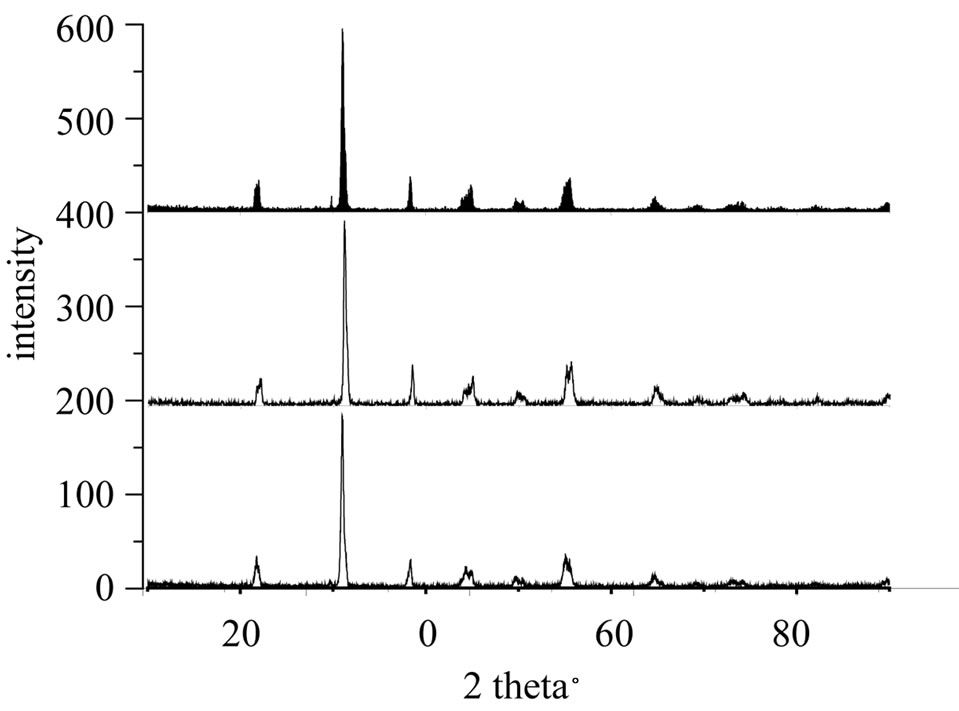
Figure 5. X-ray diffraction patterns of the sample B2 Sintered at 1100˚C, 1150˚C and 1180˚C.
madzu spectrophotometer type FTIR-8400S PC that is used to obtain IR spectra with a resolution of 1 cm−1. Laboratory of Chemistry (University of Biskra, Algeria). Analysis of the calcined powder at a temperature of 750˚C by infrared spectroscopy in Fourier transmission mode (FT) in the range of 400 - 4000 Cm−1 shows an absorption band between 450 and 800 Cm−1. This band is characteristic of the MO bond [12] and a second peak at 1400 Cm−1 is a characteristic of the solid solution PbTiO3. M. Zaghete et al. [12] also studied the formation of the PZT. Quantitative determination by infrared spectroscopy performed on our powders with different calcinations temperature shows the existence of two peaks with a vibrational absorption band between 450 and 800 Cm−1 and the second peak around 1400 cm−1, the latter is a characteristic of the solid solution of PbTiO3. Moreover, we can see clearly the gradual disappearance of the peak as a function of temperature presented in Figure 6. This also confirms our results suggested by X-rays.

Figure 6. Infrared absorption spectra as a function of temperature.
3.2. Analysis by Scanning Electron Microscopy (SEM) and by Spectrometric Energy Dispersive (EDS)
The SEM is a complementary technique of analysis and sample characterization in solid state. When scanning the sample by the electron beam, multiple interactions occur: absorption and electron energy loss, using an appropriate detection technique that can transform into an electrical signal the result of the interaction electron-material. The scanning electron microscope (SEM) analysis uses mainly secondary electrons which are usually coupled with that of backscattered electrons for “images” of the sample. Secondary electron mode, the information obtained concerning the topography of the sample while backscattered electron mode gives information about the variation of the composition.
The SEM provides information on the shape and size of grains after sintering. It also qualitatively assesses the presence of porosity and secondary phases. We also present the Figure 7 image corresponding to sample B2 sintered at 1150˚C. In Figure 8 the image of the sample B2 sintered at 1180˚C.
For the B2 sample (doped with 2% Sm, 2% Nd), this composition is doped with 4% in site A, there is a grain growth. Grain distribution is uniform over the almost entire surface of the sample. The average grain size increases with increase in the sintering temperature of 1.71 µm at 1150˚C up to 3.6 µm at 1180˚C.
It is important to note, for all samples, that no parasite phase was observed on the SEM micrographs.
The EDS analysis allows the identification of the elements constituting of our PZT ceramics doped in Site A with (Sm, Nd) and doped in Site B with (Y, Mo, Ni) and observing whether phase secondary. From the analytical results for samples: B5 (20% doped), B4 (10% doped), B3 (6% doped), B2 (4% doped), B1 (2% doped) sintered at 1150˚C, (Figure 9) we can clearly observe the peaks of the main detecting elements of Pb, Sm, Nd, Zr, Ti and O for samples of composition B3, B4, B5 with an excess of dopants in site “A” (3% Nd, 3% Sm), (5% Sm 5% Nd), (10% Nd, 10% Sm) respectively. But for the other two compositions: B1 and B2 is noted that the existence of
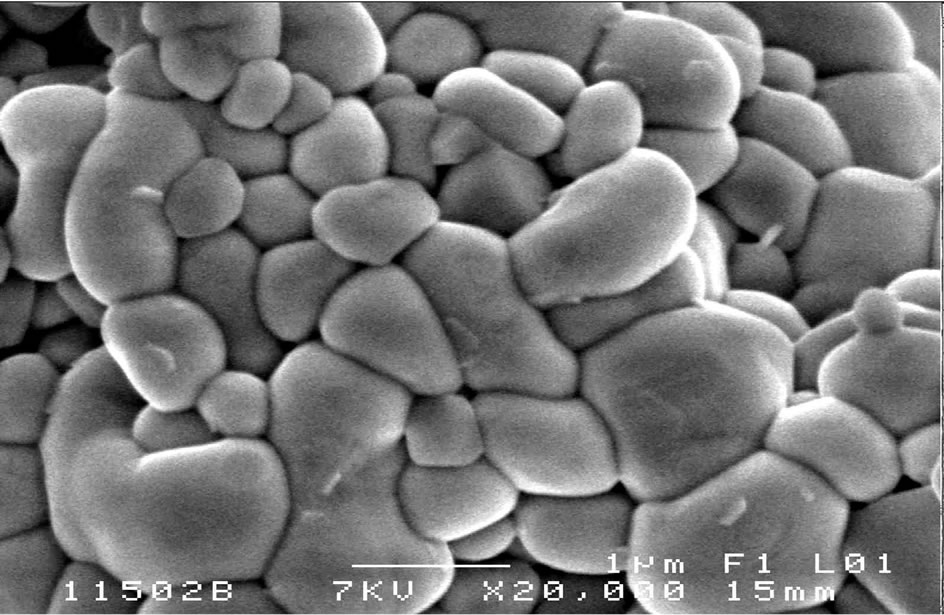
Figure 7. Scanning electron micrographs of the composition B2 sintired at 1150˚C.

Figure 8. Scanning electron micrographs of the composition B2 sintired at 1180˚C.

Figure 9. EDS spectrum of B2 sample sintered at 1150˚C.
peaks detecting elements Pb, Zr, Ti, Sm and O, With regard to other elements of the matrix Nd in site “A” and (Y, Mo, Ni) in site “B” are all absent. We also observed that no peaks representing the impurities.
4. Conclusions
This work is devoted to the study of the reaction sequence of the formation of the solid solution
Pb1-2XSmxNdx[(Zr0,55Ti0,45)1-0.02,0.01(Y2/3,Mo1/3),
0.01(Y2/3,Ni1/3)]O3. We have proposed a mechanism by three steps:
PbO + TiO2 → PbTiO3 600˚C - 700˚C
PbO + ZrO2 → PbZrO3 700˚C - 750˚C
PbTiO3 + PbZrO3 → PZT > 750˚C
The different spectra obtained by FTIR confirm our results suggested by X-ray diffraction.
The EDS analysis allows the identification of the elements constituting of our PZT ceramics we can clearly observe the peaks of the main detecting elements of Pb, Sm, Nd, Zr, Ti and O for samples of composition B3, B4, B5 with an excess of dopants in site “A” but for the other two compositions: B1 and B2 is noted that the existence of peaks detecting elements Pb, Zr, Ti and Sm (see Tables 2 and 3). With regard to other elements of the matrix Nd in site “A” and (Y, Mo, Ni) in site “B” are all absent.
The SEM provides information about the shape and size of grains after sintering. The average grain size in-
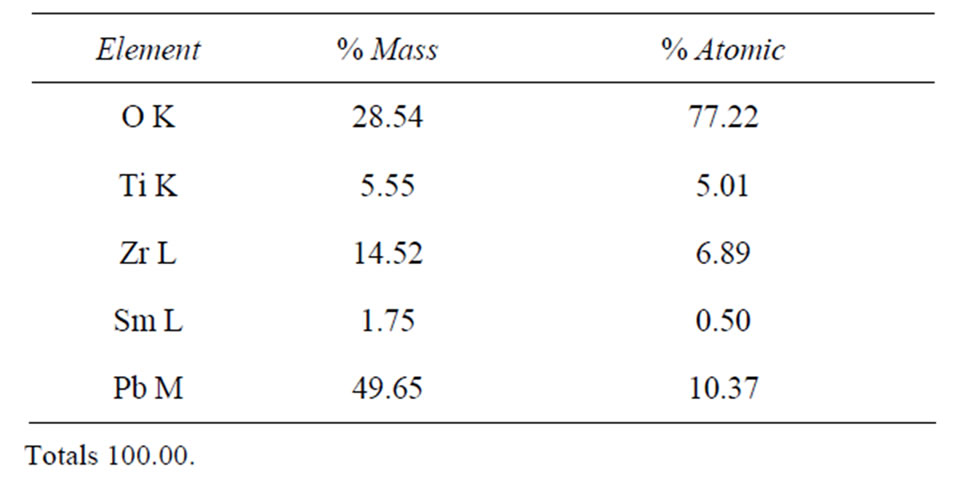
Table 2. Results obtained by EDS spectrum of B2 sample sintered at 1150˚C.
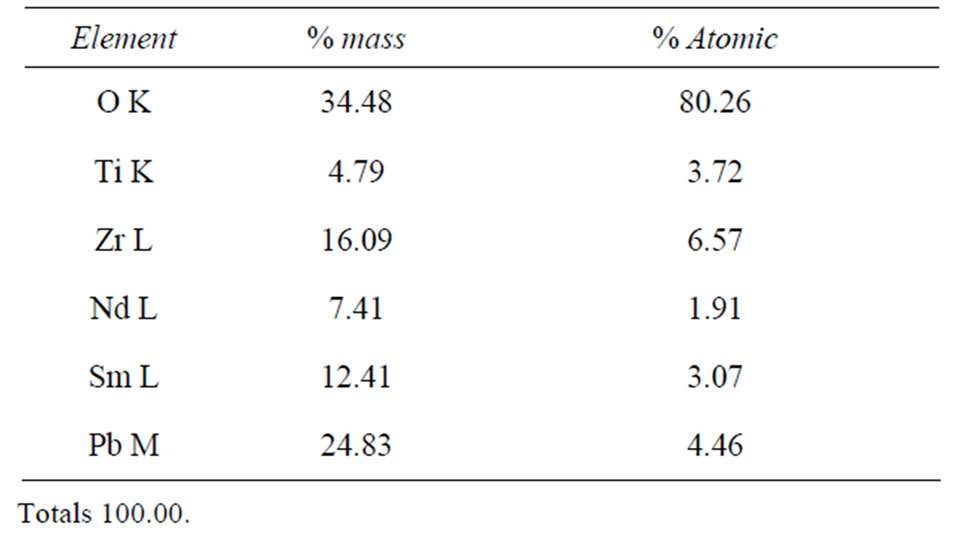
Table 3. Results obtained by EDS spectrum of B5 sample sintered at 1150˚C.
creases with increase in the sintering temperature of 1.71 µm at 1150˚C up to 3.6 µm at 1180˚C. For samples B4 and B5, which are doped in A site with 10% and 20% respectively, shows that the grain distribution is fairly uniform over the entire surface of the sample. The composition is less dense and therefore more porous. It is important to note, for all samples, no parasite phase was observed on the SEM micrographs. This observation is confirmed by analysis EDS.
REFERENCES
- Y. Matsuo and H Asaki, “Formation of Lead Zirconate Lead Titanate Solid Solutions,” Journal of American Ceramic Society, Vol. 48, No. 6, 1965, pp. 289-290. doi:10.1111/j.1151-2916.1965.tb14743.x
- W. M. Speri, “Thermal Analysis of Processes Which Occur during the Calcining of Adulterated and Unadulterated Lead Zirconate-Lead Titanate,” Ph.D. Thesis, Rutgers University, 1969.
- L. Smart and E. More, “Introduction to the Chemistry of Solid,” Masson, Paris, 1997.
- B. V. Hiremath, A. I. Kingon and J. V. Biggers, “Reaction Sequence in the Formation of Lead Zirconate-Lead Titanate Solid Solution: Role of Raw Materials,” Materials Research Laboratory, The Pennsylvania State University, University Park, 1983.
- D. L. Hanky and J. V. Biggers, “Solid State Reaction in the System PbO-TiO2-ZrO2,” Journal of the American Ceramic Society, Vol. 64, No. 12, 1981, pp. 172-173.
- E. Jaren and P. Duran, “Mechanism of the Solid State Formation of Lead Zirconate Titanate,” Journal of Physics, Vol. 47, No. 2, 1986, pp. 537-542.
- S. Mori, H. Mitsuda, K. Date, H. kioki and T. Miazawa, National Technique Report, Vol. 10, No. 32, 1964, p. 32.
- W. M. Speri, “Thermal Analysis of Processes Which Occur during the Calcining of Adulterated and Unadulterated Lead Zirconate-Lead Titanate,” Ph.D. Thesis, Rutgers Univessity, New Brunswick, 1969.
- D. L. Hankey and J. V. Biggers, “Solid State Reaction in the System PbO-TiO2-ZrO2 University of Pennsylvania Materials Research Laboratory: Ferroelectic Materials Annual Report, Appendix 9,” 1978.
- J. V. Biggers and S. Venkataramani, “Preparation and Reactivity of Lead from Aqueous Solutions,” Materials Research Bulletin, Vol. 13, No. 7, 1978, pp. 717-722. doi:10.1016/0025-5408(78)90093-4
- S. S. Chandratreya, R. M. Fulrath and J. A. Y. Pask, “Reaction Mechanisms in the Formation of PZT Solid Solutions,” Journal American Ceramic Society, Vol. 64, No. 7, 1981, pp. 422-425. doi:10.1111/j.1151-2916.1981.tb09883.x
- M. M. Zaghete, J. Varela, M. Cilense, C. Paiva-Santos, W. C. Longo and E. Longo, “The Effect of Is Structural Seeding on the Microstructure and Piezoelectric Properties of PZT Ceramics,” Ceramic International, Vol. 25, No. 1, 1999, pp. 239-244.