Food and Nutrition Sciences
Vol. 2 No. 10 (2011) , Article ID: 16353 , 8 pages DOI:10.4236/fns.2011.210142
Iron, Zinc, and Copper Malnutrition among Primary School Children in Lagos, Nigeria
![]()
1Department of Home Economics, School of Technical Education, Yaba College of Technology, Lagos, Nigeria; 2University of Agriculture, Abeokuta, Nigeria; 3The Federal Poly Technic, Ilaro, Nigeria; 4Yaba College of Technology, Lagos, Nigeria.
Email: favours94@yahoo.co.uk, {baahtunde, yvonnechi2003, femongaga}@yahoo.com
Received January 7th, 2011; revised October 12th, 2011; accepted October 19th, 2011.
Keywords: Micronutrient Status, Iron, Zinc, Copper, Primary School Children, Nigeria
ABSTRACT
This study assessed the iron, zinc and copper status of primary school-attending children in Lagos. A sample of 200 primary school-attending children was randomly selected using a stratified 2—stage sampling technique. Data was collected in the 2 major seasons in Nigeria; Dry and Rainy seasons using dietary intake (24 hr dietary recall protocol) venipuncture blood samples, and a self-administered questionnaire. The data were analyzed using descriptive and inferential statistics. Among ages 5 - 8 years, the main dietary intake for iron was 10.66 ± 12.44 mg/d (106% of DRI), for zinc, 7.30 ± 7.39 mg/d (92% of DRI) and for copper, 1.55 ± 1.31 mg/d (390% of DRI). For ages 9 - 13 yrs, the mean intake of micronutrients showed that iron was 11.03 ± 12.72 mg/d (138% of DRI), zinc was 8.44 ± 7.79 mg/d (105% of DRI) and copper was 3.75 ± 15.17 mg/d (536% of DRI). Biochemical results indicated that 19.8% of the subjects had inadequate serum iron, 21% and 32.1% were zinc and copper deficient respectively. Prevalence of anemia was 38.1% while iron deficiency anemia was 13.06% and iron deficiency was 34.6%. Dietary intakes did not provide right amounts of micronutrients to meet body requirements. There is the need to formulate and implement nutrition education programs to correct micronutrient deficiency among primary school-attending children in Lagos, Nigeria.
1. Introduction
Micronutrient malnutrition affects the health and survival of more than 2 billion people worldwide [1]. Deficiencies of iron, iodine, and vitamin A are the most widespread forms of micronutrient malnutrition with public health consequences [2].
When people cannot afford to diversify their diets with adequate amounts of fruits, vegetables or animal-source foods that contain large amounts of micronutrients, deficiencies usually occur as is the case with monotonous cereal or tuber-based diets [3].
School age children are at an increased risk of micronutrient deficiency owing to increased energy expenditure, combined with decreased meal frequency and reduced maternal attention, and parasitic infections.
Anaemia (which could result from iron deficiency) is estimated to affect one half of the school age children in developing countries [4]. Iron deficiency is disadvantageous to the achievement of school children [5]. About 800,000 child deaths per year are attributable to zinc deficiency [6,7]. Globally, zinc deficiency has been reported to contribute to substantial morbity and mortality [8]. Single micronutrient deficiencies seldom occur in isolation, but instead interact and tend to cluster. School age children like most populations in low-income countries, suffer from multiple micronutrient deficiencies. Data are scarce on the extent of the problem in school age children. However, inferences can be drawn from data on pre-school children. 13 to 27 percent of pre-school children are estimated to have two or more micronutrient deficiencies suggesting that 100 million pre-school children worldwide are affected [9].
2. Methods
2.1. Subjects
The Children attending primary Schools in the Mainland Local Government Area (MLGA) constitute the Survey Population. As at the period of the study there were 21,494 public and 6963 private school children in MLGA.
2.2. Ethical Considerations
The ethical guidelines of the Council for International Organizations of Medical Sciences. CIOMS [10] were followed. Informed consent was collected from all persons involved: head teachers, teachers, school pupils, and parents.
Approval to carry out this work was given by the Ethical Review Committee of Lagos State University Teaching Hospital (LASUTH) and Lagos State Schools Primary Education Board (SPEB).
2.3. Sample Size and Sampling Procedure
A list of all the primary schools in Mainland Local Government Area (MLG) was obtained.
A stratified two-stage sampling scheme was employed. Stratification of schools was done according to school type and location categories. One public and one private school each was selected randomly from each of the five locations (giving a total of ten schools).
The five locations were selected based on the available wards. The results of a recent National Food Consumption and Nutrition Survey 2001-2003 as reported [11] showed that a sample size of two hundred from a population of about fifty thousand, yielded a sampling error of between 18% - 20% for iron and <5% for zinc. Consequently, a sample size of two hundred respondents was selected objectively to ensure size proportionality of sex within schools. Class balance (primary 1 - primary 4) equal number of public and private schools for each location.
2.4. Data
2.4.1. Dietary Intake
Dietary intake was assessed using the 24 hour dietary recall protocol. Portion sizes were estimated using standard household measures quantified in grams.
2.4.2. 24 Hour Dietary Recall
Subjects were asked to recall and describe all foods and drinks (including amounts) eaten in the previous 24 hours. Micronutrient values of the consumed diets were computed using data from food composition tables and other published materials [12,13]. The micronutrient intake of the subjects was evaluated using the Dietary Reference Intake [14] as a reference.
2.5. Blood Analyses
5 mls of non-fasting venous blood samples was collected by a certified laboratory Scientist (Hematologist). The sample for full blood count was taken to the Psychiatric Hospital Laboratory, Yaba and analyzed within 3 hours using an automated blood count system (Bayer Corp. SV Benedict Ave, Tarrytown, NY. 10591-5097 USA).
Serum was obtained by centrifugation at a maximum of six hours after collection and stored at –20˚C until analysis. The blood samples were analyzed for: serum ferritin, serum iron, serum zinc, serum copper, haemoglobin (Hb) and Packed Cell Volume (PCV). Atomic absorption spectrophotometer (VGP Buck Scientific Inc, East Norwalk Connecticut Model 210-VGP) was used in measuring iron, zinc and copper concentrations at the chemistry laboratory of the University of Agriculture, Abeokuta [15].
Serum ferritin was measured, using a commercial kit by Biosystems Reagents and Instruments (Cod 31326 and Cod 31926, Biosystem SA Costa Bravd, Barcelona Spain ISO 900 Tuv Cert. Reg. 011006696), following standard principles [16]. The analysis was carried out at the Virology Laboratory of the Nigeria Institute of Medical Research (NIMR) Lagos.
The serum samples, the reagents and the spectrophotometer (Heλios Gamma, 820, Linden Ave, Rochester, N.Y. 14625, USA & Delta 1998 Spectronic Instruments) were all brought to 37˚C.
2.6. Calculations
The ferritin concentration in the sample was calculated using a general formula [17].
The protein control serum level I (Cod 31087) and level 11 (Cod. 31088) were used to verify the performance of the measurement procedure. The values obtained were compared with previous works [18,19]. Hemoglobin (Hb) values were also compared [20,21]. Iron deficiency was defined as having serum ferritin values below 10 µg/l [22]. Anemia was defined as having Hb levels below 11 g/dl [23]. Iron deficiency Anemia was defined as a combination of iron deficiency and anemia. A serum iron concentration below 55 µg/dl, serum zinc concentration below 70 µg/dl, and serum copper concentration below 85 µg/dl were all defined as low [17].
2.7. Statistical Analyses
Microsoft excel was used to manage the data at entry stage but was later transferred into SPSS (Statistical Package for Social Sciences) for further analysis.
Descriptive statistics, (frequencies, mean, median) were used to describe variables, while chi-square test was employed to ascertain any significant association between variables in categories. Only variables, which were responded to, were analyzed. The significance level was put at 5%. Correlation analysis was employed to infer the degree of relationship between variables.
3. Results
3.1. Socio-Economic Characteristics of Subjects
49% of the subjects were males while 51% were females. Their mean age was 7.93 ± 2.218 with age ranging from 5 to 13 years.
3.2. Micronutrient & Phytate Composition of Major Foods and Drinks Consumed by Subjects
Foods eaten by at least 10 percent of the subjects were considered as major foods consumed (Table 1). However, only the foods consumed by at least 10 percent of the subjects and also do not have published data on their iron, zinc, copper and phytic acid content were chemically analyzed.
Results revealed that the mean intakes for iron ranged from 8.38 mg/d to 13.73 mg/d. The females (5 - 8 yrs) had the lowest intake while the highest intake was by the 9 - 13-year-old males. Also, the 9 - 13-year-old males had the highest zinc mean intake (9.15 mg/d) during the dry season.
Results as indicated on Table 2 below revealed that the mean intakes for iron ranged from 8.38 mg/d to 13.73 mg/d. The females (5 - 8 yrs) had the lowest intake while the highest intake was by the 9 - 13-year-old males. Also, the 9 - 13-year-old males had the highest zinc mean intake (9.15 mg/d) during the dry season.
3.3. Seasonal Micronutrient Status of Subjects
During the dry season, among the 5 - 8 years old subjects, 39.2%, 62.4% and 100% met the DRI for Iron, zinc, and copper respectively as compared to 40.2%, 64.25% and 100% who met DRI at the rainy season. Among the 9 - 13-year-old subjects, 55.1%, 55.9% and 91.7% met the DRI for iron, zinc and copper respectively as at the dry season whereas, 57.3%, 65% and 98.3% met DRI during the rainy season. During the dry season, only 39.3% of the males aged between 5 - 8 years met the DRI (10 mg/d) for iron, while 99.0% of them met at least 30% of the DRI. 39.2% of the same subjects met the DRI during the rainy season. Among the older males (9 - 13 years), 48.6% met the DRI (8 mg/d) during the dry, while more than half of them (52.9%) met the DRI during the rainy season. Across both seasons, not even all of them met 50% (4.0 mg/d) of the DRI for Iron.
The DRI for zinc for the 5 - 8-year-old (5 mg/d) was only met by 67.4% and 67.9% for both the dry and rainy season respectively, while 96.4% met 50% (2.5 mg/d) of it at the dry season. 53.3% of the 9 - 13-year-old met the DRI for zinc (8 mg/d) during dry season while 67.1% met it at rainy season. All of the 5 - 8-year-old males met the DRI for Copper (0.4 mg/d) during both seasons. 83.3% and 96.7% of the older males (9 - 13 years) met the DRI (0.7 mg/d) during the dry and rainy season respectively.
About 39% and 41% of the 5 - 8-year-old females met the DRI for Iron (10 mg/d) during both seasons respectively. Among the older females, (9 - 13 years), 61.7% met the DRI for Iron (8 mg/d) for both seasons.
About 58% of the 5 - 8-year-old females met the DRI for zinc (5 mg/d) during the dry season while 60.6% met it during the rainy season. Among the 9 - 13-year-old females, more (62.5%) of them met the DRI for Zinc (8 mg/d) during the rainy than the dry season (58.5%).
3.4. Seasonal Variation in Micro Nutrient Intake of Subjects
The t-test results indicate that there was no significant difference in the micronutrient (Iron, Zinc, and copper) intake of 5 - 8-year-old males across the two seasons where as, there were significant differences in the Zinc (0.047) and Copper (0.020) intake of 9 - 13-year-old males. Their Zinc intake was significantly higher during the rainy than the dry season while their Copper intake was significantly higher during the dry than the rainy season. There was however, no significant difference in

Table 1. Micro nutrient & phytate composition of major foods and drink consumed by subjects.
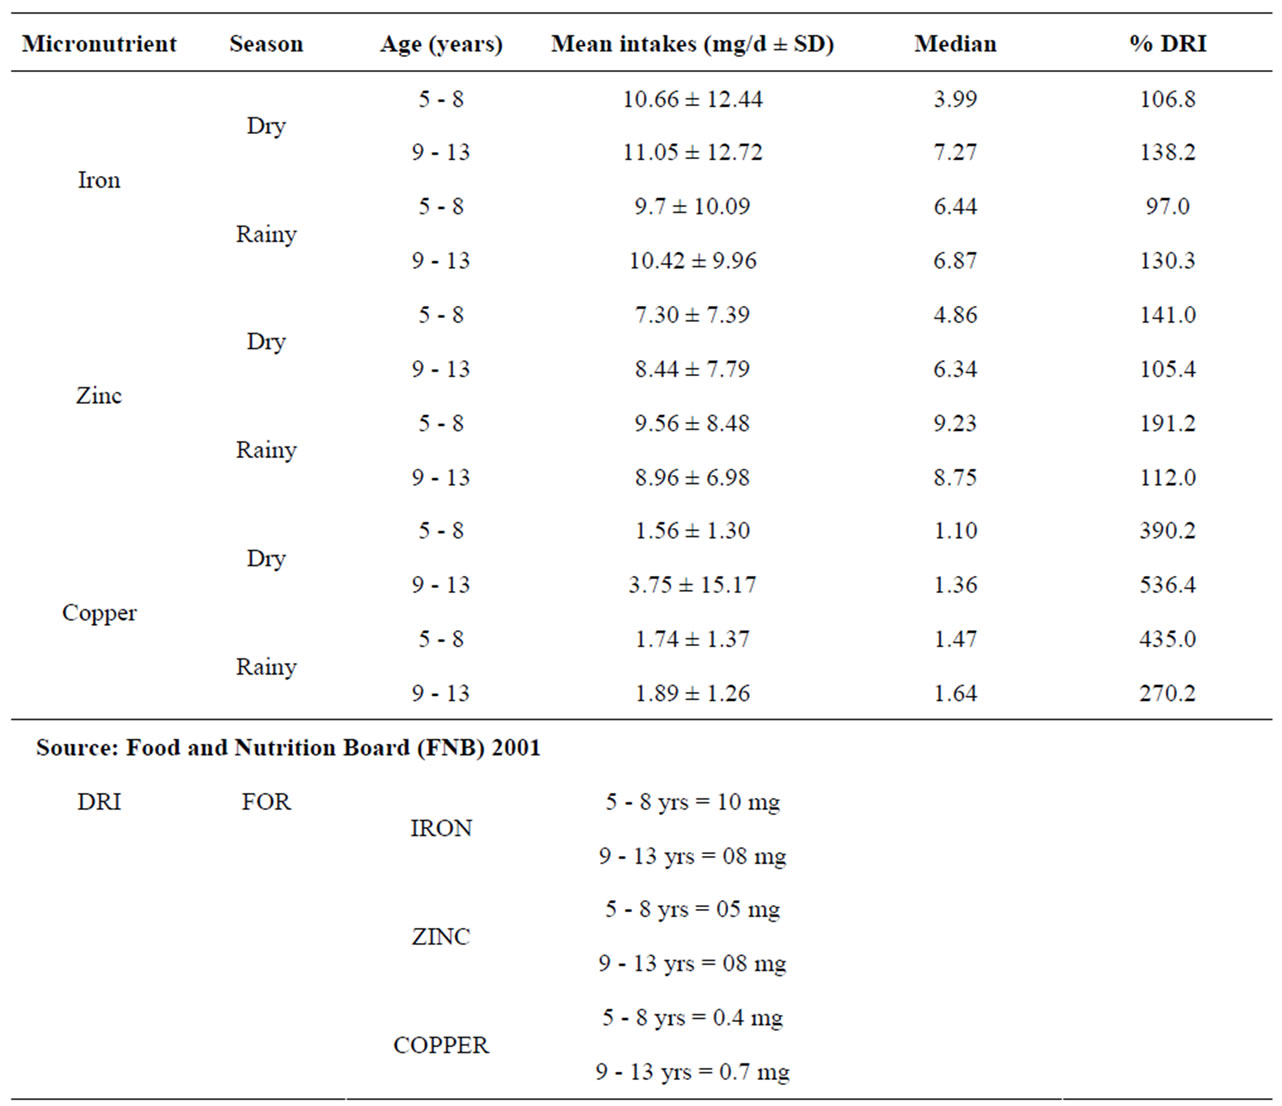
Table 2. Seasonal micronutrient intake of subjects and percentages of dietary reference intake (DRI) met.
their Iron (0.548) intake during both seasons.
While there was no significant difference in the micronutrient (iron, Zinc and Copper) intake for both seasons among the 9 - 13-year-old females, there were significant differences in the Zinc (0.055) and Copper (0.016) intake of younger females (5 - 8-year-old). They had significantly higher intakes during the rainy season, but there was no significant difference in their Iron intake for both seasons.
3.5. Haematological Indices and Status of Subjects
In an attempt to confirm the results of the micronutrient intake of the subjects, hematological and biochemical indices were measured using the blood samples of 85 of the subjects. The result revealed that the mean Hemoglobin (Hb) level of subjects was 11.19 µg/dl with a mean level of serum iron as 69.84 µg/dl, serum zinc (84.58 µg/l), serum copper (115.16 µg/l) and serum ferritin levels at 17.0 µg/l. 19.8%, 21.0% and 32.1% of the subjects had inadequate serum iron, copper and zinc respectively. Disaggregating the data into the different age and sex groups revealed that the older males (9 - 13 yrs) had the highest (11.52 µg/l) Hb mean level, while the lowest level (10.70 µg/l) was among the 5 - 8-year-old males, the older females (9 - 13 yrs) had the highest (76.97 µg/l) serum Iron levels whereas, the 9 - 13-year-old males had the least (61.73 µg/l).
The highest (93.15 µg/l) mean serum Zinc levels was among the 5 - 8-year-old males while the lowest (71.22 µg/l) was among the 5 - 8-year-old females. The older females had the least (108.76 µg/l) mean serum copper levels while the 9 - 13 years old males had the highest (130.72 µg/l). The highest (27.06 µg/l) concentration of serum ferritin was by the 9 - 13-year-old males while the least (12.28 µg/l) was by the older females (9 - 13 years). The highest number of subjects (30.8%) with low serum iron levels was among the older males (9 - 13 years) whereas; the lowest was among the younger males (5 - 8 years). Females aged between 5 - 8 years had the highest number (48.0%) of those who had inadequate serum Zinc levels, while the 5 - 8-year-old males had the least. Subjects with the highest percentage (25.9%) of low serum Copper were the 5 - 8-year-old males and the (9 - 13 years) old males had the least.
Results of the blood samples also indicated that 38.8% of the subjects were anemic, (11.8% had moderate anemia while 27.1% were mildly anemic,). 34.6% were iron deficient with 44.4% having depleted iron stores (serum ferritin <20 µg/l). 13.04% had iron deficiency anemia. The females aged between 5 - 8 years had the highest (55.0%) while males (9 - 13 years) had the least (21.7%) incidence of anemia. The highest (42.9%) prevalence of iron deficiency was among the older subjects (9 - 13 years) of males and females while the lowest (29.2%) was among the 5 - 8-year-old females. Female subjects aged between 5 - 8 years had the highest (35.0%) incidence of Iron deficiency Anemia, while the least incidence (13.3%) was among the older females (9 - 13-year-old).
4. Discussion
For both seasons, the mean iron intake of subjects ranged from 9.70 mg/day (5 - 8-year-old) to 11.05 mg/day (9 - 13-year-old). These values, (see Table 2) are lower than those obtained among the US population (NHANES, 1999-2000), as reported [24]. Subjects below 6 years had a mean iron intake of 12.9 mg/day while those between 6 - 11 years had a mean intake of 14.4 mg/day. While some of the subjects ate home-cooked iron-rich foods, some of them, (particularly those from the public schools) bought food from vendors for as many as three times in a day. Some of them ate as little as N10.00 (about 15 cents) worth of rice and beans (mean weight of 68 g) for a meal and sometimes, the meals were eaten without meat or fish or with very little quantities of them. It was only among the older females (9 - 13 years) that more than half (61.7%) met the DRI for iron during both seasons. 52.9% of the 9 - 13-year-old males met the DRI during the rainy season, only 48.6% met it during the dry season.. The reason for this is not far-fetched, because while some of the subjects consumed good quantities of ironrich foods, others consumed small quantities. There could also have been some measures of underreporting and exaggeration by some of the subjects.
Only 39.2% and 55.1% of the 5 - 8 year and 9 - 13-year-old subjects respectively met DRI for iron. This could be reflected in their iron status in general where 38.1% of the subjects had anemia and 34.6% had iron deficiency.
Mean iron intakes tended to increase with age among the male subjects while it tended to decrease with age among the female subjects. It could be suggested that the iron intake of the male subjects is reflected in the result of their iron status, where the 5 - 8-year-old males had higher incidence of anemia (50%) and iron deficiency anemia (30.4%) than the 9 - 13-year-old. The same could not be suggested for the younger females (5 - 8 years) who had higher incidence of anemia (55.0%) and iron deficiency anemia (35.0%) than the 9 - 13-year-old even though iron deficiency was more prevalent (42.9%) among the older females (9 - 13 years).This suggests that their low dietary iron intake pre-disposed them to low iron stores (serum ferritin < 10 µg/l). This has serious implications for these older females because of onset of menarché. During adolescence, iron requirements are increased and hence the risk for iron deficiency increases because of rapid growth. Among girls and women, menstruation increases the risk for iron deficiency. Therefore, entering menarché already iron-deficient, further increases the risk for iron deficiency anemia. A pregnant girl with iron-deficiency anemia is prone to having pregnancy complications and its attendant problems. The result of the iron status in general, has implications for all the subjects. There is a marked increase in hemoglobin mass and concentration, further increasing iron requirements in males during puberty, while females usually have their growth spurts before menarché (even though growth is not finished at that time) [25]. Iron status of adolescents could be as a consequence of their iron status before attaining puberty [26].
Mean serum iron levels of the subjects could not be said to be a reflection of their intake when it is considered that only 19.8% of the subjects had inadequate serum iron levels despite low dietary iron intake. Mean serum levels was higher among the younger males (5 - 8 years) with the percentage of those with low serum levels, higher (30.8%) among the 9 - 13 years old males despite that their intake was higher than that of the younger males. Prevalence of inadequate serum iron was lower (18.8%) among the older females (9 - 13 years) not withstanding their low dietary iron intake as compared to higher percentage of inadequate serum iron among the younger ones even with their higher dietary iron intake. It is possible that the intake of iron-containing foods by the subjects on the day the blood samples were collected was significantly higher than that of the day the 24-hour recall interview was conducted. Serum iron has been found to vary as much as 100% during a 24-hour interval in healthy subjects [27]. 6% of the subjects were reported to be taking iron supplements which they referred to as “blood tonic”, which could have also influenced their serum iron levels.
The results of the hemoglobin and serum ferritin levels of the subjects indicate that the prevalence of anemia (Hb level below 11g/dl) was moderate (38.1%). According to WHO classification, 11.8% of the subjects had moderate anemia (Hb between 7.09 - 9.9 g/dl) while, 27.06% of them had mild anemia (Hb levels between 10.0 and 10.09 g/dl).There was no case of severe anemia (Hb below 7.0 g/dl). The prevalence of iron deficiency anemia was mild (13.04%), while the prevalence of iron deficiency (serum ferritin below 10 µg/l) was moderate (34.6%) with 23.5% of the subjects having severe iron deficiency (Serum ferritin concentration less than 7 µg/l). This value is higher than that obtained in an earlier study [11] where 19.4% of children under 5 years were iron deficient (serum ferritin less than 10 ng/ml). The consequences of iron deficiency on growth, cognition, anemia and immunity are quite great and calls for public health attention.
Zinc intake increased with age among all the subjects. While the mean zinc intake (8.4 mg/d) of the younger subjects compared well with the mean zinc intake (8.1 mg/d) of the NHANES study, that of the older subjects was lower. The mean zinc intake of 6 - 11-year-old in the NHANES study was 10.6 mg/d while that of this study was 8.70 mg/d. Even though more than 50% of the subjects met 100% DRI for zinc across season, it is only among the 5 - 8-year-old females that all the subjects met 50% of DRI for both seasons.
In this study, 21% of the subjects were zinc deficient (serum zinc below 70 µg/dl). This compares well with the aforementioned study [11] where 20% of the subjects under 5 years were zinc deficient (serum zinc below 70 µg/dl). The mean serum zinc levels did not necessarily reflect mean intake in males even though the older males had higher intake. This is probably due to the fact that zinc concentrations do not sufficiently reflect individual zinc status [28]. However; more (38.5%) older males had inadequate serum zinc than their younger counterparts (14.8%). The mean zinc levels of the females could not possibly reflect their intake also because more (48.6%) of the younger females than the older females (31.3%) had inadequate serum zinc levels. Among the older females, not all the subjects met 30% DRI during the dry season. Perhaps the serum zinc values do not reflect their recent intake since changes in plasma/serum zinc do not seem to occur until the capacity to re-establish homoeostasis (by reducing excretion and or growth) has been exceeded. Hence zinc concentrations do not sufficiently reflect individual zinc status [29]. It is also possible that what the children refer to as “blood tonic” could also contain zinc supplements. The result of the zinc status has implications for growth retardation and delayed sexual maturation in children. The same factors limiting iron nutrition have similar effects on zinc nutrition. Children have high requirements for zinc and factors inhibiting iron absorption (e.g. high phytate in the diets) often have even more pronounced effect on zinc absorption [3]. Similar to iron, the best dietary source of zinc is meat and the meat intake by the children in this study, was low. The prevalence of zinc deficiency as observed [30] appears to be similar to that of iron deficiency. The mean copper intake of the subjects tended to increase with age among males but not so among female subjects. All subjects, apart from the older males (9 - 13 years) met 100% of the DRI across seasons. All the older males however met 75% of the DRI across season. That all the females met DRI for specific age group during the two seasons could mean that they ate more of the copper containing foods. They would have taken more instant noodles which contained high amounts of copper. Despite that, the 9 - 13-year-old males did not meet 100% DRI for copper across both seasons; they had the lowest prevalence (7.7%) of inadequate serum copper, while the 5 – 8-year-old males with 115.26 mg/dl mean level had the highest prevalence (25.9%). The major source of water for the subjects in this study was pipe-borne water, which contained 0.82 mg/g of copper. This would have contributed to their having met more than 200% of the DRI for copper during both seasons. According to an earlier study [31], Copper pipes may contribute substantially to the intake of copper and depending on the copper content of the local soil; 13% - 50% of copper in meals may be supplied by water. Despite that, all but the 9 - 13-year-old males met 100% of DRI for copper across season, the result of the serum copper levels also revealed that 32.1% of the subjects were copper deficient (serum copper below 85 mg/dl). 25.4% of the 5 - 8-year-old males and 24.0% of the 5 - 8-year-old females were also copper deficient. The poor copper status could be due to poor absorption; this could have implications for public health when it is considered that copper is a relatively uninvestigated micronutrient in Nigeria. It has been reported [29] that there are limited data supporting a high prevalence of copper deficiency in developed countries. Copper deficiency could lead to anemia because copper is an essential component of feroxidase 1. Copper deficiency causes a dramatic decrease in feroxidase activity which in turn prevents the mobilization of iron from stores (by being oxidized from +2 to +3) and its incorporation into hemoglobin. Serum plasma or copper concentration is the most commonly measured indicator of copper status and except in cases of severe copper deficiency, it is the least reliable [32].
5. Conclusions and Implications
• Dietary intakes did not provide right amounts of micronutrients to meet body requirement.
• Prevalence of inadequate serum iron, zinc and copper was moderate. There was also moderate prevalence of anemia and iron deficiency.
• Nutrition education should therefore be included in the curriculum of primary school children.
• There is the need to formulate and implement nutrition education programs to correct micronutrient deficiency among primary school-attending children in Lagos.
6. Acknowledgements
The authors wish to thank the Lagos State Government for personnel support in making the study possible.
REFERENCES
- C. Kennedy, G. Nantel and P. Shetty, “The Scourge of Hidden Hunger: Global Dimensions of Micronutrient Deficiencies,” FAO Food, Nutrition and Agriculture, No. 32, 2003, pp. 15-16.
- ACC/SCN, “Nutrition of the School Age Child,” SCN News, No. 16, 1998, pp. 3-25.
- Food and Agriculture Organization (FAO), “The State of Food Insecurity in the World,” Food and Agriculture Organization, Rome, 2002, pp. 2-4.
- R. J. Stoltzfus, H. M. Chwaya, J. M. Tielsch, K. J. Schulze, M. Albonico and L. Saviol, “Epidemology of Iron Deficiency Anaemia in Zanzibari School Children: The Importance of Hookworms,” American Journal of Clinical Nutrition, Vol. 65, No. 1, 1997, pp. 153-159.
- G. I. Gleason and N. S. Schrimshaw, “An Overview of Functional Significance of Iron Deficiency, Nutritional Anaemia,” Swiss Federal Institute of Technology, 2007, pp. 46-57.
- M. Ezzati, A. D. Lopez, A. Rodgers, S. Vanderhoom and G. L. Murray, “Selected Major Risk Factors and Global Regional Burden of Disease,” Lancet, Vol. 360, No. 9343, 2002, pp. 1342-1360. doi:10.1016/S0140-6736(02)11403-6
- World Health Report, “Reducing Risks, Promoting Healthy Life,” World Health Organization, Geneva, 2002.
- W. Fisher, M. Ezatti and R. E. Black, “Global and Regional Child Mortality and Burden of Disease Attributable to Zinc Deficiency,” European Journal of Clinical Nutrition, Vol. 63, No. 5, 2009, pp. 591-597. doi:10.1038/ejcn.2008.9
- J. B. Mason, M. Lotfi, M. Dalmiya, K. Sethuraman, M. Dietchler, S. Giebel, K. Gillenwater, M. A. Gilman, K. Mason and N. Mock, “The Micronutrient Report: Current Progress and Trends in the Control of Vitamin A, Iodine and Iron Deficiency,” The Micronutrient Initiative, Ottawa, 2001.
- C. Bankowski, “International Guidelines for Ethical Review of Epidemiological Studies,” Council for International Organizations of Medical Sciences (CIOMS), Geneva, 1991.
- B. Maziya-Dixon, I. O. Akinyele, E. B. Oguntona, S. Nokoe, R. A. Sanusi and E. Harris, “Nigeria Food Consumption and Nutrition Survey 2001-2003 Summary,” International Institute of Tropical Agriculture, Ibadan, 2004.
- O. O. Onabanjo and C. R. B. Oguntona, “Iron, Zinc Copper and Phytate Content of Standardized Nigerian Dishes,” Journal of Food Composition and Analysis, Vol. 16, No. 6, 2003, pp. 669-676. doi:10.1016/S0889-1575(03)00063-2
- E. B. Oguntona and I. O. Akinyele, “Composition of Nigeria Foods Cooked Raw and Processed,” FBFI, Ibadan, 1995.
- Food and Nutrition Board, “Dietary Reference Intakes for Vitamin K, Chromium and Minerals. Reference Intakes,” National Academy Press, Washington DC, 2001.
- N. W. Tietz, “Textbook of Clinical Chemistry,” 3rd Edition, E. R. Saunders, Philadelphia, 1990.
- A. Bernard and R. Lauwerys, “Turbidimetric Latex Immunoassay for Serum Ferritin,” Journal of Immunological Methods, Vol. 71, No. 2, 1984, pp. 141-147. doi:10.1016/0022-1759(84)90060-7
- N. W. Tietz, “Textbook of Clinical Chemistry,” W. B. Saunders, Philadelphia, 1986.
- B. Pourghassem, G. S. M. Kimiagar, A. A. Abolfathi, N. Vallaii and M. Ghaffarpour, “Prevalence of Iron deficiency, Anaemia, and Iron Deficiency Anaemia in High School Students in Jolfa, East Azerbaijan,” Food and Nutrition Bulletin, Vol. 21, No. 3, 2000, pp. 301-304.
- N. W. Tietz, “Clinical Guide to Laboratory Tests,” 3rd Edition, W. B. Saunders, Philadelphia, 1995.
- CDC, “Recommendations to Prevent and Control Iron Deficiency in the United States,” Morbidity and Mortality Weekly Report, Vol. 47, No. RR-03, 1998, pp. 1-25.
- A. C. Looker, P. R. Dallman, M. D. Carrol, E. W. Gunter and C. L. Johnson, “Prevalence of Iron Deficiency in the United States,” Journal of American Medical Association, Vol. 277, No. 12, 1997, pp. 973-976. doi:10.1001/jama.1997.03540360041028
- P. R. Dallman, M. A. Siimes and A. Stekel, “Iron Deficiency in Infancy and Childhood,” American Journal of Clinical Nutrition, Vol. 33, No. 1, 1980, pp. 86-118.
- CDC, “Criteria for Anaemia in Children and Childbearing-Aged Women,” Morbidity and Mortality Weekly Report, Vol. 38, No. 22, 1989, pp. 400-404.
- J. D. Wright, T. Kennedy-Stephenson and R. Bethene, “Dietary Intake of Ten Key Nutrients for Public Health, United States, 1999-2000,” CDC, No 334, 17 April 2003.
- FAO, “The State of Food Insecurity in the World,” Food and Agriculture Organization of the United Nations, Rome, 2002.
- F. Tiniakors, “Iron Status and Cognitive Function in Poor Inner City Primary School Children,” Unpublished M.Sc. Thesis, University of London, London, 1993.
- J. D. Cook and B. S. Skikne, “Iron Deficiency and the Measurement of Iron Status,” Nutrition Research Review, Vol. 5, No. 1, 1992, pp. 189-202. doi:10.1079/NRR19920014
- C. King, “Assessment of Zinc Status,” Journal of Nutrition, Vol. 120, No. 11, 1990, pp. 1474-1479
- M. H. N. Golden, “The Diagnosis of Zinc Deficiency,” In: C. F. Mills, Ed., Zinc in Human Biology, Springer-Verlag, London, 1989, pp. 325-333.
- B. O. Lonnerdal, “Micronutrient Interactions,” Impact on Child Health and Nutrition, ILSI Press, Washington DC, 1996, pp. 3-10.
- G. M. Wardlaw and M. W. Kessel, “Perspectives in Nutrition,” 5th Edition, McGraw-Hill Education, New York, 2002.
- D. B. Milne, “Assessment of Copper Nutritional Status,” Clinical Chemistry, Vol. 40, No. 8, 1994, pp. 1479-1484.