Food and Nutrition Sciences
Vol. 2 No. 1 (2011) , Article ID: 3641 , 4 pages DOI:10.4236/fns.2011.21004
Factors Influencing Household Food Security Status
![]()
1Urmia University of Medical Science, Urmia, Iran; 2Tabriz University of Medical Science, Tabriz, Iran; 3Urmia University of Medical Science, Urmia, Iran
Email: r_sharafkhani@yahoo.com, Saeed.Dastgiri@gmail.com, *r-gharaaghaji@umsu.ac.ir, Ghavamzadeh@hotmail.com
Received August 9th, 2010; revised December 20th, 2010; accepted October 4th, 2010
Keywords: Food Insecurity Status, Influencing Factors, Prevalence, Household
ABSTRACT
Poor nutrition can lead to reduced immunity, impaired physical and mental development and reduced productivity. The objectives of this study were to determine the Influencing factors on the household food insecurity status. This cross-sectional study conducted on 2500 households selected from Qaresoo region in the northwest of Iran. Household food security status measured by a validated short questionnaire including six questions and other required data (influencing factors) obtained alongside the validated questionnaire. Chi-square and logistic regression used for data analysis using SPSS software. Forty Percent of households suffered from low food insecurity and twenty percent had experienced very low food insecurity. Severity of household food insecurity increased with increasing distance from the city (Exp (B) = 1.05, 95% C.I = 1.03-1.07). It decreased with increasing centers that provides food (Exp (B) = 0.97, 95% C.I = 0.97- 0.98) Residential infrastructure (Exp (B) = 0.99, 95% C.I = 0.98-0.99) Family size (Exp (B) = 0.92, 95% C.I = 0.87- 0.98) and the presence of both parents in comparison the presence of single parent at home (Exp (B) = 0.46, 95% C.I = 0.32-0.66). Spearman correlation test also showed that mean per capita income had a significant inverse correlation with household food insecurity status. (Correlation coefficient = –0.3, P < 0.05). Socioe-conomic factors were affecting the household food insecurity status. More studies seem to be essential in order to provide practical solutions to reduce the severity of food insec-urity.
1. Background
Nutrition and food safety are interdependent components of public health and concern everybody. Poor nutrition can lead to reduced immunity, impaired physical and mental development and reduced productivity [1,2]. According to USDA classification, Household food security status has three levels [3]:
1) Food secure: These households had access, at all times, to enough food for an active, healthy life for all household members.
2) Food insecure: At times during the year, these households were uncertain of having, or unable to acquire, enough food to meet the needs of all their members because they had insufficient money or other resources for food. Food-insecure households include those with low food security and very low food security.
2-1) Low food security (with out hunger): These food-insecure households obtained enough food to avoid sub-stantially disrupting their eating patterns or reducing food intake by using a variety of coping strategies, such as eating less varied diets, participating in Federal food asistance programs, or getting emergency food from community food pantries.
2-2) Very low food insecurity (whit hunger): In these food-insecure households, normal eating patterns of one or more household members were disrupted and food intake was reduced at times during the year because they had insufficient money or other resources for food. In reports prior to 2006, these households described as “food insecure with hunger”.
Food insecurity exists whenever the availability of nutritionally adequate and safe foods or the ability to acquire foods in socially acceptable ways is limited or uncertain [4]. Globally the number of food-insecure people in the world rose from 849 million to 982 million between 2006 and 2007 [5]. According reports 14.6 percent of American’s households were food insecure at least some time during 2008, including 5.7 percent with very low food security [6] In spite of the dramatic progress in some areas of nutrition during recent years, FAO estimates that 1.02 billion people undernou-rished worldwide in 2009 [7].
Hunger has long been a concern of world leaders, as evidenced by the 1948 Universal Declaration of Human Rights [8], stating “everyone has the right to a standard of living adequate For the health and well-being of himself and of his family, Including food” At the 1996 World Food Summit in Rome. Studies done indicate that household’s economic, social and cultural situation are important factors on household’s food security status. According to the 2008 report of Statistics Center of Iran, the average annual income per household was estimated 88219386 Rial ($ 8822) and 48423784 Rial ($ 4843) for urban and rural areas respectively. The mean family size has also been estimated by the same center 3.9 and 4.4 people for urban and rural areas, respectively. The aim of study was determine influencing factors on the Household Food Insecurity Status in northwest of Iran.
2. Material and Methods
This cross-sectional study was conducted at Qaresoo region in city (northwest of Iran).This area is located southeast of khoy city and consists of nearly 18,648 populations and 3700 household. Region’s people speak Azari language. Two thousand five hundred households with approval and knowledge from research objectives were enrolled to study. After interviewer’s education, Household food security status measured by a validated short questionnaire including six questions. According to U.S. Household Food Security Survey Module: Six-Item Short Form [3] Households that reply negative answer to six items or only a positive answer classified High or marginal food security (HFS), Households with 2-4 positive answer classified Low food security (LFS) and those answered 5-6 positive answer classified Very low food security (VLFS). In questions one, three and four option yes, questions five and six options often or sometimes, in question two options almost every month or some months were positive answers. Other required data (influenc-ing factors) obtained alongside the validated questionnaire. Chi-square and Binary logistic Regression applied for data analysis using SPSS (version 16) software.
3. Results
Of 2500 household, 58 household did not reply to financial questions and excluded from analysis. From 2442 household, 984 (40.3%) households had HFS, 970 (39.7%) households had LFS and 488 (20%) households had VLFS (Figure 2). One way-ANOVA test showed that Average per capita income according to household food security status (HFS, LFS, VLFS) was significantly different (p < 0.05). Spearman correlation test also showed that mean per capita income had a significant inverse correlation with Severity of household food insecurity (correlation coefficient = – 0.3, P < 0.05), (Figure 2). Univariate logistic regression showed there was not significant relation between independent variables such as (Presence or absence of smoker in household, responsible’s age for household nutrition, Machine status (having versus not having), and Private Residence status (having versus not having) whit household food insecurity status (LFS, VLFS). While variables such as distance from city, residential infrastructure, number of centers that provides food, Family size & the presence of both parents in comparison the presence of single parent at home and education level) had significant relation with food insecurity status. All significant variables were entered to the multivariate logistic regression model using (BackWard: Wald) method. Results from multivariate logistic showed that Severity of household food insecurity

Figure 1. Household food security status.
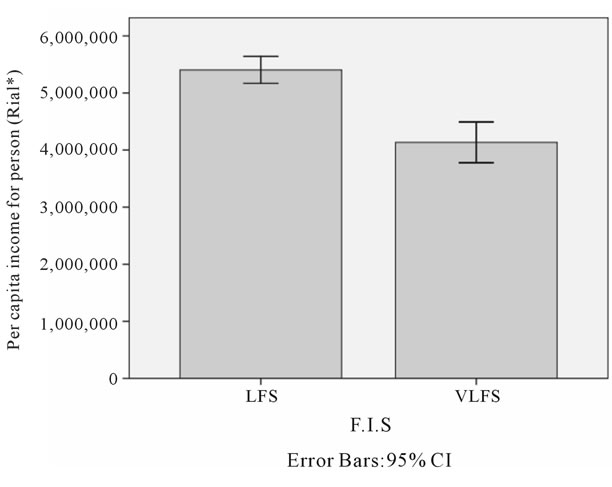
Figure 2. Per capita income for person by food insecurity status.
Notes: 1. F.I.S: food insecurity status; 2. 1$ = 10000 Rial;
3. Per capita income for person: 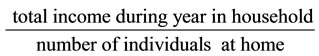
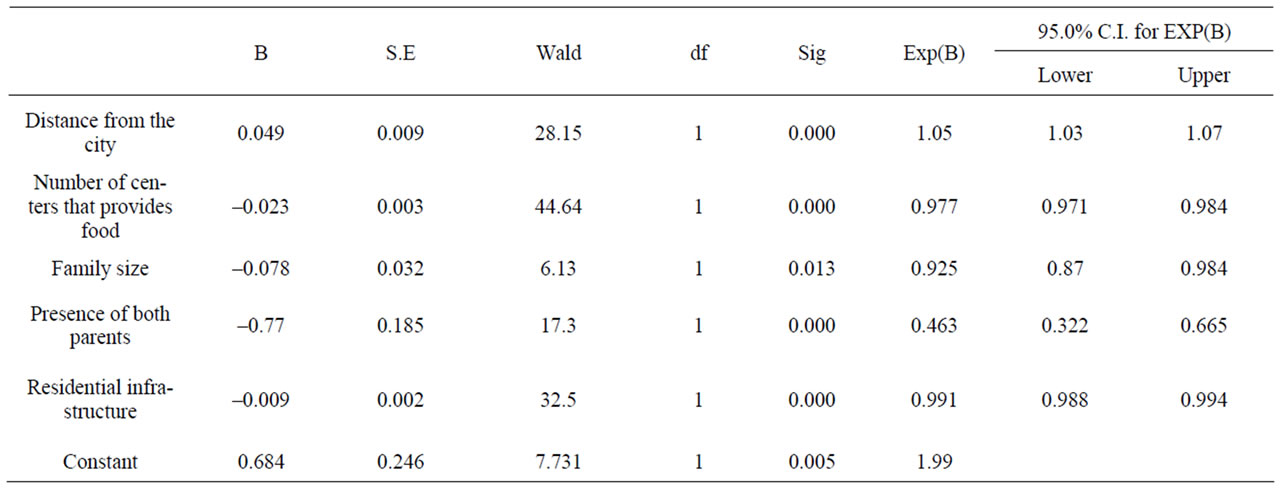
Table 1. Multivariate logistic regression model.
increased with increasing distance from the city while it decreased with increasing number of centers that provides food, Residential infrastructure, Family size and the presence of both parents in comparison the presence of single parent at home (table 1).
4. Discussion
Our findings indicated that household food insecurity was prevalent in the Norwest of Iran. Of food insecure households, 970 (39.7%) households had LFS (Low food security) and 488 (20%) households had VLFS (Very low food security). Study done by Ostadrahimi AR on 300 household in the northwest of Iran indicated that 41.6 percent had LFS and 26 percent had VLFS. Although energy sufficiency method had applied to determine the household food insecurity status, the findings of two studies had Coordination [9].
In study conducted by Tahereh Ramesh, using USDA questionnaire including 18-item, the results showed that the prevalence of food insecurity without hunger was 27.8 percent and food insecurity with hunger was 16.2 percent. Food insecurity had significant relation with socioeconomic condition and having children under 18 [10].
Study conducted by Piaseu N, Which conducted on 199 household in Thailand Showed that 39.2 percent of households experienced food insecurity without hunger and 30.1 percent of households had food insecurity with hunger [11].
Study conducted by Mrs AliHosseini, who study demographic and social factors that explain the severity of food insecurity, showed that more than 99 percent of the study population had experienced food insecurity and 37.3 percent of households had experienced food insecurity with hunger. Presence of Patient at home, Ratio of working people in family, supervisor education, Family Support Network and Supervisor activity status identified as the most important variables, which explain the severity of food insecurity respectively [12]. Graph-2 indicates that economic factors were effective on food insecurity status (LFS versus VLFS). SNAP is one of the most important programs running in order to reduce food insecurity in USA. The aim of this program is support low-income household to provide food for healthy life. Average financial aid per personmonth was 124 $ in 2009. Next to this plan, SNAP-ED and FSNE are running programs in order to provide nutrition education to low-income families and create healthy nutritional practices in families. We found only one interventional study to reduce food insecurity. Results of this study indicate that Food insecurity and food insufficiency in the experimental group compared with the control group were significantly improved [13-15]. It seems the best way to reduce food insecurity, is intervention on both section (economic & culture), particularly in high exposure groups. This question comes to mind-Due to lack of financial source-whether can decrease the severity of food insecurity by nutrition education? Whether can decrease the Prevalence of VLFS? Answer these questions need further research, which can help Policy makers in order to promote food security status in community.
5. Acknowledgements
The authors gratefully acknowledge households that participated to study, especially interviews under all villages (Leila Seyfloo, Habib Dorostye, Ali Akbar Sharifi, Mostafa Aliloo, Hossein Ebrahimpour Sadaghyani, Esmail Aboul Zanjeremaskan, Gholam Reza Zamanloo and Ali Shahmerzaloo) also we thanks from Urmia university of medical science for financial supporting.
REFERENCE
- WHO (World Health Organization), Fact Sheet: Second WHO European Action Plan for Food and Nutrition Policy: Tackling Noncommunicable and Acute Diseases, pp. 1-2.
- World Bank, Poverty and Hunger: Issues and Options for Food Security in Developing Countries, World Bank Policy Study, Washington D. C., 1986.
- M. Nord, M. S. Andrews and S. Carlson, Household Food Security in the United States, Washington D. C., 2005.
- http://www.worldhunger.org/articles/Learn/world%20hunger%20facts%202002.htm.
- IFT, Number of “Food-Insecure” People Increases Worldwide, Institute of Food Technologists Weekly, 2008.
- M. Nord, M. Andrews and S. Carlson, Household Food Security in the United States, 2008.
- http://www.fao.org/hunger/hunger_home/hunger_at_glance/en/
- United Nations High Commissioner for Human Rights, All Human Rights for All: Fiftieth Anniversary of the Universal Declaration of Human Rights, Geneva, Switzerland, 1998.
- A. R. Ostadrahimi, S. A. Mahboob, H. Tutunchi, S. Dastgiri and L. Dadgar, “The Prevalence and Extent of Food Insecurity in Two Dimensions (Hidden & Reveal Hunger) in Asad Abad Tabriz,” Journal of Lorestan University of Medical Sciences, Vol. 8, No. 1, 2005, pp. 61-66.
- T. Ramesh, A. D. Motlagh and M. Abdollahi, “Prevalence of Food Insecurity on Urban Household in Shiraz City and It’s Related Socioeconomic Factors,” Iranian Journal of nutrition and food technology, Vol. 1388, No. 4, pp. 53-64.
- N. Piaseu and P. Mitchell, “Household Food Insecurity among Urban Poor in Thailand,” Journal of Nurs Schlarsh, Vol. 36, 2004, pp. 115-121. doi:10.1111/j.1547-5069.2004.04023.x
- J. AliHosseini, “Demographic and Social Factors Associated with Food Insecurity in Households Covered by Imdad Committee,” Tehran (zone-20), Masters Thesis in Demography, Tehran University, 2005.
- http://www.oregon.gov/DHS/assistance/foodstamps/nutrition/index.shtml
- http://www.fns.usda.gov/pd/SNAPsummary.htm
- http://www.fns.usda.gov/fns/nutrition.htm