American Journal of Plant Sciences
Vol.5 No.11(2014), Article ID:45982,21 pages DOI:10.4236/ajps.2014.511167
In Silico Mining of EST-SSRs in Jatropha curcas L. towards Assessing Genetic Polymorphism and Marker Development for Selection of High Oil Yielding Clones
Neeraj Jain1*, Ganesh B. Patil2, Poonam Bhargava3, Rajani S. Nadgauda1
1Plant Cell and Molecular Biology, Indian Institute of Advanced Research, Gandhinagar, India
2Molecular Breeding and Applied Genomics, MAHYCO Seeds Ltd., Dawalwadi, India
3Gujarat State Biotechnology Mission, Gandhinagar, India
Email: *neerajjain@iiar.res.in
Copyright © 2014 by authors and Scientific Research Publishing Inc.
This work is licensed under the Creative Commons Attribution International License (CC BY).
http://creativecommons.org/licenses/by/4.0/


Received 14 March 2014; revised 12 April 2014; accepted 22 April 2014
ABSTRACT
In recent years, Jatropha curcas L. has gained popularity as a potential biodiesel plant. The varying oil content, reported between accessions belonging to different agroclimatic zones, has necessitated the assessment of the existing genetic variability to generate reliable molecular markers for selection of high oil yielding variety. EST derived SSR markers are more useful than genomic markers as they represent the transcriptome, thus, directly linked to functional genes. The present report describes the in silico mining of the microsatellites (SSRs) using J. curcas ESTs from various tissues viz. embryo, root, leaf and seed available in the public domain of NCBI. A total of 13,513 ESTs were downloaded. From these ESTs, 7552 unigenes were obtained and 395 SSRs were generated from 377 SSR-ESTs. These EST-SSRs can be used as potential microsatellite markers for diversity analysis, MAS etc. Since the Jatropha genes carrying SSRs have been identified in this study, thus, EST-SSRs directly linked to genes will be useful for developing trait linked markers.
Keywords:Bio-Diesel, Jatropha curcas L., EST, SSR, MAS, Diversity, Marker, Mining, Polymorphism, In Silico

1. Introduction
In recent years, Jatropha curcas L. has gained popularity as a potential biodiesel plant. It is commonly known as purging nut/Barbados nut. This plant belongs to the family Euphorbiaceae and is a native of Mexico and Central America and was later on introduced in many parts of tropics and subtropics. J. curcas is commonly known to be a poisonous plant. It is a semi-evergreen shrub or small tree reaching a height of 6 mt (20 ft). It can survive arid conditions; therefore, can be grown on drylands and wastelands. The seeds of this plant are highly toxic but produce oil that can be used as biodiesel after transesterification, besides that, in soap and candle making. Being traditionally considered as a weed, its oil has recently started gaining importance as “fuel of the future” or “green fuel” and has been in news, with transport companies eager to run trains, cars and aeroplanes using biodiesel to cut down both on cost and pollution.
The oil content in Jatropha curcas is reported to be varying between accessions belonging to different agroclimatic zones (40% to 58% in kernels) of India [1] -[3] . In recent years, emphasis has been laid on producing high oil yielding Jatropha plant which can be achieved through genetic selection and crop improvement methods. As a means to this end, it is necessary to assess the existing genetic variability and generate reliable molecular markers for selection.
DNA markers are not typically influenced by environmental conditions, therefore, can be used to describe patterns of genetic variation among plant populations and to identify duplicated accessions within germplasm collections [4] . To assess the genetic diversity, several types of popular PCR based markers like, RAPD (Random Amplified Polymorphic DNA) [5] , ISSR (Inter Simple Sequence Repeat) [6] [7] and AFLP (Amplified Fragment Length Polymorphism) [8] [9] are routinely used due to the advantage of no requirement of prior sequence information [3] .
The existing information regarding the extent and pattern of genetic variation in J. curcas population is limited [10] . Common molecular markers like AFLP [3] and, RAPD and ISSR [10] [11] have been used to assess the genetic diversity of J. curcas. The assessment of genetic diversity using molecular markers disclosed low interaccessional variability in local J. curcas germplasm [12] . Basha and Sujatha [11] used RAPD, ISSR and SSR markers to study the diversity between J. curcas accessions from different countries, which revealed low genetic variability between accessions from same country and maximum divergence between Indian accessions and a non-toxic Mexican accession. They also developed SCAR markers to differentiate Indian accessions from non-toxic Mexican accession.
There are less popular but extremely useful markers like SSRs (Simple Sequence Repeats) and SNPs (Single Nucleotide Polymorphisms) [13] which can be used for genetic diversity profiling. Of these markers, SSRs [14] , also known as Microsatellites or Tandem repeats are short repeating nucleotide sequences in DNA that provide greater confidence for the assessment of genetic diversity and relationship [15] . These are the markers of choice for plant genetics and breeding applications [16] [17] as the data generated by these markers can be used for selections during backcross breeding programs [15] , and also because of their reproducibility, multiallelic nature, codominant inheritance, relative abundance and good genome coverage [17] . Marker Assisted Selection (MAS) has proved to be the best resource for improvement of many crops [18] . SSRs have been used for MAS in crops like rice [19] and common bean [20] .
The traditional methods of developing SSR markers are usually time consuming and labor-intensive [21] [22] . In contrast to this approach, in silico mining of SSRs from available ESTs in public databases, with an increasing data accumulating at a fast rate, is an expeditious and cost effective alternative [21] . The search of SSRs in ESTs (representing genes or coding region) becomes more attractive in wake of report of abundance of SSRs in single or low-copy rather than in repetitive or non-coding sequences as assumed earlier [23] . Therefore, molecular SSRs can be searched in EST databases and employed for designing locus-specific primers [24] . Such markers are termed as EST-SSRs. By convention, the EST sequences containing SSRs are generally referred to as SSR-ESTs, whereas the markers developed from SSR-ESTs are called EST-SSRs [17] [25] , the same has been followed throughout this paper.
Expressed Sequence Tags (ESTs) are generated by end sequencing of large number of randomly picked clones from cDNA library constructed using mRNA isolated from specific tissue or specific developmental stage of an organism. EST-derived SSR markers are generally less polymorphic than genomic SSRs [26] due to an associated lower polymorphism of coding regions in contrast to non-coding ones [27] . There are also reports of moderate [28] to very high polymorphism associated with EST-SSRs [29] [30] . In spite of contrasting reports about the level of polymorphism related to EST-SSRs, there are several advantages of using expressed sequences compared with genomic sequences as genetic markers. As the EST derived markers represent the functional component of the genome and are transferable across species [31] , they can serve as efficient tool for gene discovery and genetic mapping of genes [32] [33] . Therefore, EST-SSRs enhance the role of genetic markers by assaying variations in transcribed and known function of genes [21] [26] [34] . In spite of several studies, till date no genetic map of Jatropha has been reported [22] and there is a very recent report of SNP-based linkage map by Wang et al. [35] . There is also a need to develop molecular markers for MAS for high oil yielding variety and assessing the genetic diversity.
The present report describes the in silico mining of the microsatellites (SSRs) using the J. curcas ESTs from various tissues viz., embryo, root, leaf and seed available in the public domain of NCBI. At the time of mining, a total of 13513 ESTs were available and downloaded. From these ESTs, 7552 unigenes were obtained, and 395 EST-SSRs were generated from 377 SSR-ESTs. The EST-SSRs obtained through computational method in this study can be used as potential microsatellite markers for various studies like diversity analysis, MAS etc. Since, the Jatropha genes carrying SSRs have been identified in this study, thus, EST-SSRs directly linked to genes will be useful for developing trait linked markers.
2. Materials & Method
Search for EST-SSRs and Primer Designing
EST sequences of J.curcas were downloaded from NCBI’s dbEST database (http://ncbi.nlm.nih.gov/) [36] which contains sequences generated from different tissue specific cDNA libraries of embryo, root, leaf and seed. These sequences were arranged in a single FASTA file, which was used for the sequence analysis using different softwares and Analysis Tools.
To find the singletons and to assemble the contigs from the total ESTs, an online tool “EGassembler” (http://egassembler.hgc.jp/) [37] was used. The main parameter provided was ‘Overlap Identity cutoff (N > 65): 85’. From the unigenes (singletons+contigs), EST-microsatellites [EST-SSRs] were searched using “SSRlocator version 1” (http://www.ufpel.tche.br/faem/fitotecnia/fitomelhoramento/faleconosco.html) [38] .
The SSR search was carried out for repeat motifs (ranging from monoto hexa-nucleotides). For each repeat motif the parameters were: Mononucleotide repeat-20, Dinucleotide repeat-10, Trinucleotide repeat-07, Tetranucleotide repeat-05, Pentanucleotide repeat-04, Hexanucleotide repeat-04 (the numbers indicating repeat unit i.e. minimum number of times the motif was repeated at a stretch); Space between SSRs-100, Space between imperfect SSRs [<=]-05. After obtaining the motifs, the sequence complementarity was taken into consideration and accordingly the complementary motifs like AG and CT or AC and GT or AAC and GTT motifs were grouped into a single class under mono-, di-, tri-, tetra-, pentaor hexa-nucleotides, respectively. After getting SSRs, the primers were designed from the flanking regions using the same software as for SSR search. The parameters provided in the software for primer designing are given in Table 1.
EST Sequences, which have credit in the primer designing, were searched for their gene annotations using BLASTX at The Arabidopsis Information Resource (TAIR) (http://www.arabidopsis.org/index.jsp) [39] . This data was used to get the Gene Ontology (GO) Annotations and functional categorization of ESTs using locus identifiers at Bulk Data Retrieval System of TAIR (http://www.arabidopsis.org/tools/bulk/go/index.jsp) [40] .
3. Results and Discussions
3.1. Assembling of ESTs as Unigenes
The size of the available EST data used in this study has been calculated in accordance with the size of the

Table 1. Parameters for primer designing.
genome of J. curcas (C = 416 Mb) reported by Carvalho and coworkers [41] . The ESTs of J. curcas generated from tissue specific cDNA library of various tissues (viz. embryo, root, leaf and seed) available in the NCBI’s public database dbEST, were downloaded and pooled. These downloaded ESTs were inclusive of the seed specific ESTs generated in our laboratory. The pooled set consisted of 13513 ESTs (~6.2 MB) in all, which comprised of 9844 ESTs of embryo, 1000 of leaf, 1304 of root and 1375 of seed library. Using the EGassembler, all the sequences were categorized into singletons and contigs. The EGassembler segregated 13513 ESTs into 6098 singletons and 7415 redundant sequences. Then it assembled the redundant sequences into 1454 contigs. Therefore, through the software, the total ESTs were categorized into contigs and singletons, which were together grouped as 7552 (~3.8 MB) Unigenes. These data showed that the 45% of the total ESTs, downloaded from the database, were singletons and the rest 55% were assembled into contigs (Figure 1). The assembling of the redundant ESTs into contigs was beneficial in reducing the errors in sequence analysis in addition to removing the redundancy so that only the unigenes were used for SSR mining and for annotation. As reported by Raji and coworkers [18] , these unigenes, when used for the mining of SSRs result in a realistic estimate of the microsatellite repeat frequency and ensures that non redundant EST-SSR markers that correspond to unique loci in the genome are obtained. Therefore, in this study the unigenes were used for SSR search. The mining of the EST-SSRs starting with downloading of all the Jatropha ESTs is outlined in Figure 1.
3.2. Occurrence and Frequency of Microsatellites
For searching the SSRs, the repeat motifs in the software, were selected from monoto hexa-nucleotide as
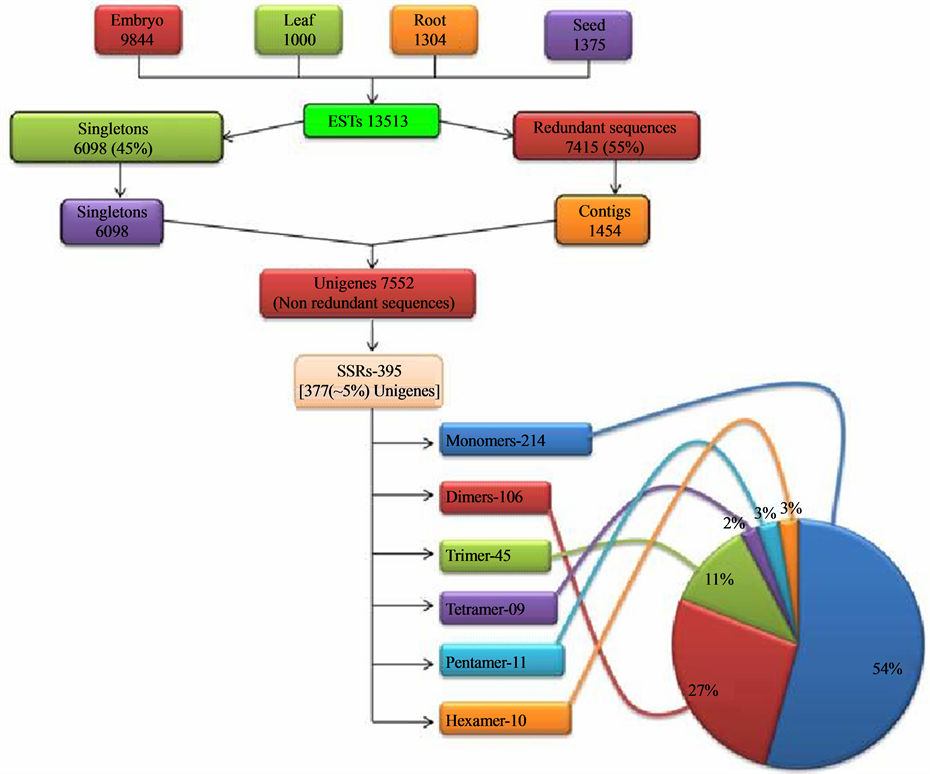
Figure 1. Overview of the study indicating the major steps and the statistics leading to generation of the EST-SSRs.
going above this motif range, the frequency of occurrence of SSRs is drastically reduced. Thus, the SSRs were obtained in the form of repeat motifs ranging from monoto hexa-nucleotides. Out of the 7552 unigenes searched for SSRs, 395 SSRs (Table 2) were generated from 377 unigenes. These 395 SSRs can be termed as EST-SSRs and 377 unigenes possessing SSRs can be termed as SSR-ESTs according to the convention. The 377 SSR-ESTs amounted to approximately 5% (inclusive of the mononucleotide repeat motif) of total unigenes and 2.78% of total downloaded EST data set. The various studies show a representation ranging from 2.65% - 16.82% [25] to 26.84% [42] in dicot species and 7% - 10% [43] in cereals or monocots. The workers [17] [21] [25] who have carried out similar studies are of the view that the variation in the percentage may be due to variation in sample size, search criteria, size of database, and the tools used for EST-SSR development. The percentage of SSR-ESTs in the present study could be owing to more stringent preset parameters for EST mining compared to other similar studies [21] [42] that reported a higher percentage of SSR-ESTs.
The 395 SSRs were present in 377 SSR-ESTs as 17 (4%) SSR-ESTs contained more than one SSR e.g. FM889616.1 with 3 SSRs, having motifs (GA)32, (AG)14, (AG)14 (data not shown). The SSRs in mononucleotide class were found to be the most abundant with a frequency of 1/17.83 kb followed by dinucleotide 1/36.00 kb, trinucleotide 1/84.82 kb, tetranucleotide 1/424.11 kb, pentanucleotide 1/347.00 kb and hexanucleotide 1/381.70 kb.
3.3. Distribution of Microsatellite Classes and Motifs
The overall analysis of the distribution of the microsatellites into various classes of the repeat types (mono-, di-, tri-, tetrapentaand hexa-nucleotides) showed that the number of the microsatellites decreased with increasing motif size (Figure 2, Table 3). It was observed that mononucleotide repeats were the most abundant (representing 54% of the total microsatellites), followed by dinucleotide (27%) and trinucleotide (11%). The least frequent were tetra-, pentaand hexa-nucleotides (2% - 3%). The abundance of mononucleotides is in accordance with several previous reports [23] [25] [44] and also that these contributed to nearly half of all the SSRs, is similar to those in certain species of dicots analysed previously [25] . The dinucleotides were the second most abundant class as reported across most of the dicots investigated by Kumpatla and Mukhopadhyay [25] , suggesting an over-representation of UTRs (un-translated regions) compared with ORFs (Open Reading Frames).
The non-dominance of trinucleotides compared to other classes, by virtue of which the decreasing trend of various classes with increasing motif size, is in contrast to several earlier studies but in concurrence to that reported for several dicots [25] . These observations about the abundance and therefore, the dominance of one SSR motif category over other categories, holds significance in the chances of fixation of mutations against selection pressure [45] . The trinucleotides have more chances of getting fixed against mutation pressure due to selection against frameshift events [45] The prevalence of diover tri-nucleotide in this study could be attributed to 1. increased stringency of preset parameters in this study compared to previous studies [21] [22] , so as not to compromise on polymorphism level and thus their utility as markers. The results were also computed with relaxed preset parameter of repeat length which gave a higher percentage of total SSRs especially trinucleotides (data not shown). But, the results reported here are those obtained with more stringent parameter of minimum repeat length 2. a bias in representation of 5’ and 3’UTRs in the EST dataset used for mining. A lowered representation of tetranucleotides, as also observed in this study, is also suggestive of under representation of 3’UTRs [25] .
In terms of SSR coverage of available Unigenes data (~3.8 MB), it was observed that a total of 11.7 kb (0.31%) region was covered by SSR motifs. Out of this, mono-represented 6.5 kb (0.17%) region, di—3.3 kb (0.08%), tri—1.1 kb (0.03%), tetra—0.18 kb (0.004%), penta—0.26 kb (0.006%) and hexa-nucleotides 0.24 kb (0.006%).
The various classes of repeat motifs, when analyzed further, showed that some motifs in each category were more abundant than others (Table 4), e.g. among the dinucleotide repeats, the AG/CT motif was the most common (33%) followed by the motifs GA/TC (31%) and, the least common was AC/GT (0.94%). The abundance of AG/CT/GA/TC motifs are in concurrence with previous studies [25] [43] [44] where ESTs were used for mining SSRs, in contrast to abundance of AT motif when genomic data was used for mining SSRs [44] [46] . Thus, abundance of the motifs is attributed to systematic bias resulting from the use of ESTs (coding sequences) instead of genomic sequences (non-coding) as a source for SSR mining [43] . The CG motif was found to be totally absent, which is in concurrence to earlier studies, where it has been observed to be either the least [43] or absent [44] . Among the trinucleotide repeats, the most common motif is AGA/TCT subclass amounting to
Table 2. Categorization of SSRs by repeat units and repeat motif.
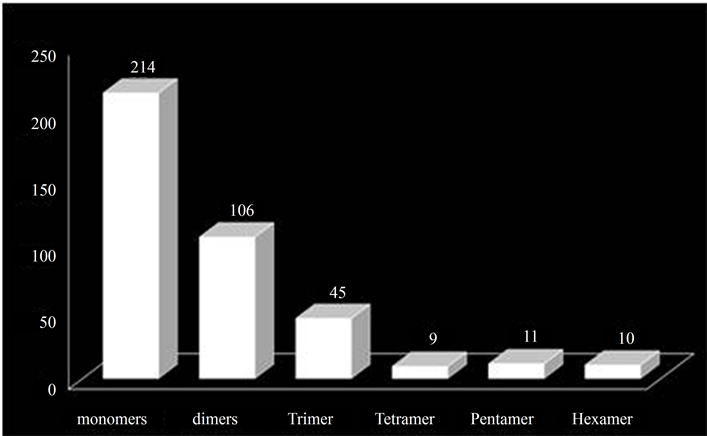
Figure 2. Distribution of SSRs into various classes.
Table 3. Abundance of SSRs of various types.
Table 4. Most abundant motifs and their relative abundance in each of the SSR types.
26.6% and rest of them ranging from 2% - 13% of the total microsatellites in this class. The CCG/CGG motif is reported to be the rarest motif in dicots [23] [25] and was observed to be absent in this study. In the tetranucleotide repeats, most of the motifs were AT rich. The most common motif was AAGA/TCTT (22%) and the rest of them were each ~11% of the total microsatellites in this class. In the pentanucleotide class of motifs the most common one was AAGAA/TTCTT and TATTT/AAATA (18% each) and others were each 9%. The hexanucleotide class TTTCTC/GAGAAA (30%) formed the most abundant subclass and the rest of them were 10% each. In general, the motifs were observed to be AT rich and less of GC rich motifs, similar to that observed for dicots [25] .
The analysis of repeat units under each motif class revealed a varying range of repeat units in each of the classes of repeat motifs. It was observed that, in dinucleotide motif, repeat units ranged from 10 - 45; in trinucleotide motif, from 7 - 13; in tetranucleotide, from 5 - 6 units; in pentanucleotide, from 4 - 6; and hexanucleotide motif was represented by a single class of 6 repeat units only. Further analysis of the number of repeat units in every class of the SSRs, especially tri-, tetrapentaand hexa-nucleotides, showed that the number of the microsatellites decreased with increasing repeat unit length with little variation, e.g. for trinucleotide motif, SSRs with 7 repeats were represented by 42.2% while 2.2% by 13 repeat units. Amongst the pentanucleotide SSRs, the category with 4 repeat units shared as much as 45.5% of the total class in comparison to 9% for repeat unit of seven (Figure 3). Therefore, it can be said that as the class of the SSR motif size increases, like tetra-, pentaand hexa-nucleotide, higher number, rather 100% of microsatellites were found in the category of <10 repeat units (Table 2) which is similar to that observed by Varshney and co-workers [43] . These results clearly indicate the effect of increased stringency of parameters which were maintained during this study to retain the polymorphism level and utility of the SSRs as markers because the probability of polymorphism increases with increasing length of SSRs [47] -[49] and, a higher number of repeat followed by shorter stretches would be beneficial for marker development [48] . The polymorphism reported in Jatropha in earlier studies was very low, therefore, the parameters for mining the SSRs were kept more stringent in this study, which lead to lower frequency of SSRs but with a longer repeat length; as in the case of trinucleotide repeats, keeping the minimum repeat length of 7 resulted in it not being the most abundant class, as reported in other similar studies.
3.4. Designing of Primers towards Marker Development
For the use of SSRs as markers, it is necessary to design the primers. The SSRs commonly used for marker development are those belonging to di-, triand tetra-nucleotides [25] . The mononucleotides are useful for population genetic analyses of chloroplast genomes [50] and can also be useful in filling gaps in linkage maps created by di-, tri-, and tetra-nucleotide repeats [25] but, at the same time they cause difficulties in accurate sizing of polymorphisms [18] . Therefore, to design the primers for potential SSR markers, the mononucleotide repeats were not included. Thus, out of 395 EST-SSRs generated from 377 SSR-ESTs, the primers were designed for only 181 SSRs.
For each of the SSRs, a pair of reverse and forward primer was designed from the flanking regions of their respective SSR-ESTs by the software. 181 SSRs generated from 172 SSR-ESTs were used for primer designing and yielded 79 SSR mediated primer pairs (data not shown). These 79 primer pairs were designed from 76 SSR-ESTs as some of these contained more than one SSR e.g. JES 56 and 57 (Supplementary Table A). Thus, 76 SSR-ESTs having credit in primer designing have been termed as ESTs-PD and were further annotated. The primers could not be designed for some of the EST-SSRs from their respective SSR-ESTs. As reported by Varshney and coworkers [42] , this could be due to any or all of the following reasons, (a) SSR-ESTs are too short, (b) EST-SSRs are too close to the cloning site of the SSR-ESTs, or (c) the flanking sequences are not unique, as was also observed for some of the SSRs in this study.
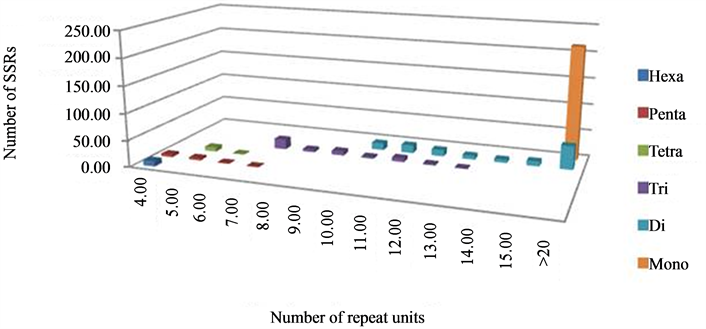
Figure 3. Distribution of SSRs as per repeat unit size in different types.
3.5. Functional Annotation of the ESTs-PD
The GC level of the genome of J. curcas is typical of core dicots, therefore, it should be easy to annotate by sequence comparison with Arabidopsis [41] , hence, ESTs-PD were searched for their gene annotations using BLASTX at TAIR. The Gene Ontology (GO) Annotations and functional categorization of ESTs-PD obtained using locus identifiers are given in Supplementary Table A.
The data showed that most of the ESTs-PD are expressing functional proteins and still there are some for which the protein is not yet predicted. On the basis of the functions related to the predicted protein, the ESTs-PD were classified into three major classes viz. Cellular Component, Biological Process and Molecular Function (Figure 4). In the limits of the available data in the public database for the ESTs of J. curcas, it was found that one of the ESTs-PD (Contig1345) containing SSR (JES35) expresses gene of oil biosynthesis pathway (AT1G48750).
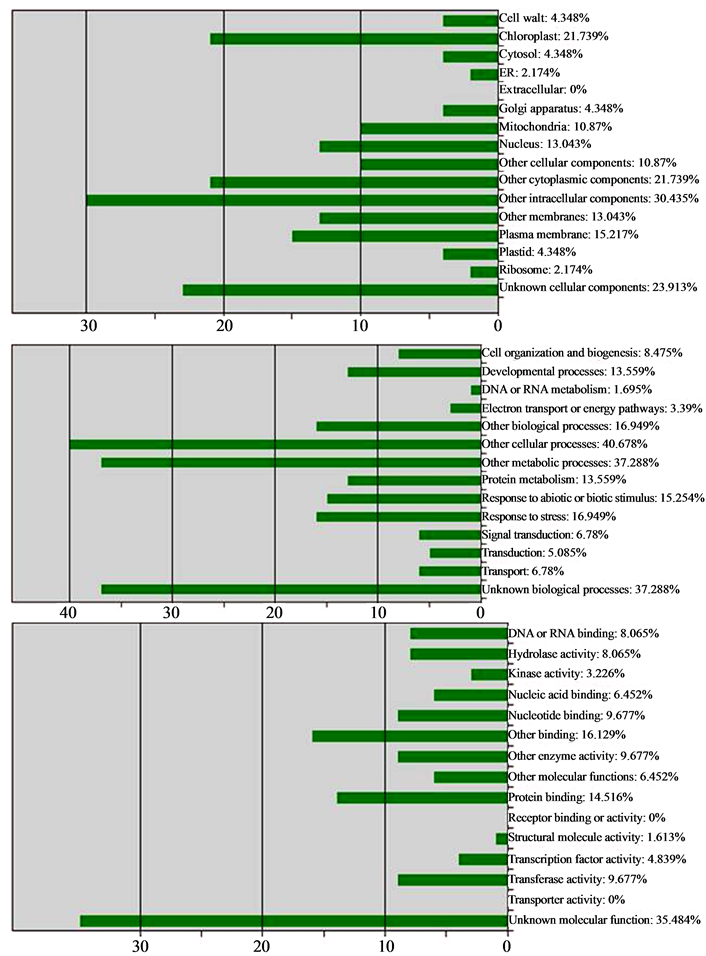
Figure 4. Functional categorization of ESTs-PD by loci A: Cellular component, B: Biological process, C: Molecular function.
4. Conclusion
The in silico mining of EST-SSRs of Jatropha was carried out in this study taking advantage of the availability of enormous EST data in the public database, the importance of ESTs in SSR mining and, the potential of modern bioinformatics tools combined with their speed and ease. The stringency of the preset parameters was kept high so as not to compromise on the level of polymorphism in potential EST-SSRs, thus, their utility as markers, more so in this study, as low levels of polymorphisms have been reported in Jatropha. The functional annotation of the SSR-ESTs showed that most of them are associated with expressed proteins and therefore, trait linked genes. Thus, in this study, the genes of Jatropha carrying SSRs were identified. The EST-SSRs generated would be useful for developing trait linked markers. As the expressed sequences are highly conserved, the SSRs developed from the ESTs are characterized by transferability across species. Owing to this characteristic, these SSRs could also be useful as markers across closely related species like Ricinus, thus, saving time and resources in reiteration of SSR mining or; for related species with limited or no sequence information. EST-SSRs like JES35 generated from EST expressing gene of fatty acid biosynthesis pathway (AT1G48750) would be of utmost importance towards marker development in Jatropha. With more data being submitted at a rapid pace to the public database, more such SSRs can be looked for in comparative genomic studies and, the knowledge generated in this study is a step towards development of markers in this plant and also related species.
Acknowledgements
The authors are thankful to the Department of Biotechnology, Government of India, for financial support for research and fellowships of two authors Dr. Poonam Bhargava and Mr. Ganesh B. Patil and, Puri foundation for Education in India, for providing infrastructure facilities.
References
- Ginwal, H.S., Rawat, P.S. and Srivastava, R.L. (2004) Seed Source Variation in Growth Performance and Oil Yield of Jatropha curcas Linn. in Central India. Silvae Genetics, 53, 186-192.
- Ikbal, K., Boora, S. and Dhillon, R.S. (2010) Evaluation of Genetic Diversity in Jatropha curcas L. Using RAPD Markers. Indian Journal of Biotechnology, 9, 50-57.
- Tatikonda, L., Wani, S.P., Kannan, S., Beerelli, N., Sreedevi, T.K., Hoisington, D.A., Devi P. and Varshney, R.K. (2009) AFLP-Based Molecular Characterization of an Elite Germplasm Collection of Jatropha curcas L., a Biofuel Plant. Plant Science, 176, 505-513. http://dx.doi.org/10.1016/j.plantsci.2009.01.006
- Jubera, M.A., Janagoudar, B.S., Biradar, D.P., Ravikumar, R.L., Koti, R.V. and Patil, S.J. (2009) Genetic Diversity Analysis of Elite Jatropha curcas (L.) Genotypes Using Randomly Amplified Polymorphic DNA Markers. Karnataka. Journal of Agricultural Sciences, 22, 293-295.
- Williams, J.G.K., Kubelik, A.R., Livak, K.J., Rafalski, J.A. and Tingey, S.V. (1990) DNA Polymorphisms Amplified by Arbitrary Primers Are Useful as Genetic Markers. Nucleic Acids Research, 18, 6531-6535. http://dx.doi.org/10.1093/nar/18.22.6531
- Alhani, M.C. and Wilkinson, M.J. (1998) Inter Simple Sequence Repeat Polymerase Chain Reaction for the Detection of Somaclonal Variation. Plant Breeding, 117, 573-575. http://dx.doi.org/10.1111/j.1439-0523.1998.tb02210.x
- Blair, M.W., Panaud, O. and McCouch, S.R. (1999) Inter-Simple Sequence Repeat (ISSR) Amplification for Analysis of Microsatellite Motif Frequency and Fingerprinting in Rice (Oryza sativa L.). Theoretical and Applied Genetics, 98, 780-792. http://dx.doi.org/10.1007/s001220051135
- Vos, P., Hogers, R., Bleeker, M., Reijans, M., van de Lee, T., Hornes, M., Frijters, A., Pot, J., Peleman, J., Zabeau, M. and Kuiper, M. (1995) AFLP: A New Technique for DNA Fingerprinting. Nucleic Acids Research, 23, 4407-4414. http://dx.doi.org/10.1093/nar/23.21.4407
- Zhu, J., Gale, M.D., Quarrie, S., Jackson, M.T. and Bryan, G.J. (1998) AFLP Markers for the Study of Rice Biodiversity. Theoretical and Applied Genetics, 96, 602-611. http://dx.doi.org/10.1007/s001220050778
- Basha, S.D., Francis, G., Makkar, H.P.S., Becker, K. and Sujatha, M. (2009) A Comparative Study of Biochemical Traits and Molecular Markers for Assessment of Genetic Relationships between Jatropha curcas L. Germplasm from Different Countries. Plant Science, 176, 812-823. http://dx.doi.org/10.1016/j.plantsci.2009.03.008
- Basha, S.D. and Sujatha, M. (2007) Inter and Intra-Population Variability of Jatropha curcas L. Characterized by RAPD and ISSR Markers and Development of Population-Specific SCAR Markers. Euphytica, 156, 375-386. http://dx.doi.org/10.1007/s10681-007-9387-5
- Sujatha, M., Reddy, T.P. and Mahasi, M.J. (2008) Role of Biotechnological Interventions in the Improvement of Castor (Ricinus communis L.) and Jatropha curcas L. Biotechnology Advances, 26, 424-435. http://dx.doi.org/10.1016/j.biotechadv.2008.05.004
- Vieux, E.F., Kwok, P.Y. and Miller, R.D. (2002) Primer Design for PCR and Sequencing in High-Throughput Analysis of SNPs. BioTechniques, 32, S28-S32.
- Levinson, G. and Gutman, G.A. (1987) Slipped-Strand Mispairing: A Major Mechanism for DNA Sequence Evolution. Molecular Biology and Evolution, 4, 203-221.
- Chakravarthi, B.K. and Naravaneni, R. (2006) SSR Marker Based DNA Fingerprinting and Diversity Study in Rice (Oryza sativa. L.). African Journal of Biotechnology, 5, 684-688.
- Tripathi, K.P., Roy, S., Khan, F., Shasany, A.K., Sharma, A. and Khanuja, S.P.S. (2008) Identification of SSR-ESTs Corresponding to Alkaloid, Phenylpropanoid and Terpenoid Biosynthesis in MAPs. Online Journal of Bioinformatics, 9, 78-91.
- Varshney, R.K., Graner, A. and Sorrells, M.E. (2005) Genic Microsatellite Markers in Plants: Features and Applications. Trends in Biotechnology, 23, 48-55. http://dx.doi.org/10.1016/j.tibtech.2004.11.005
- Raji, A.A.J., Anderson, J.V., Kolade, O.A., Ugwu, C.D., Dixon, A.G.O. and Ingelbrecht, I.L. (2009) Gene-Based Microsatellites for Cassava (Manihot esculenta Crantz): Prevalence, Polymorphisms, and Cross-Taxa Utility. BMC Plant Biology, 9, 1471-1429. http://www.biomedcentral.com/1471-2229/9/118
- Wang, Y.H., Liu, S.J., Ji, S.L., Zhang, W.W., Wang, C.M., Jiang, L. and Wan, J.M. (2005) Fine Mapping and MarkerAssisted Selection (MAS) of a Low Glutelin Content Gene in Rice. Cell Research, 15, 622-630. http://dx.doi.org/10.1038/sj.cr.7290332
- Carneiro, F.F., Santos, J.B. and Leite, M.E. (2010) Marker-Assisted Backcrossing Using Microsatellites and Validation of SCAR Phs Marker for Resistance to White Mold in Common Bean. Electronic Journal of Biotechnology, 13, Online Version. http://ejb.ucv.cl/content/vol13/issue6/full/13/index.html
- Gupta, S. and Prasad, M. (2009) Development and Characterization of Genic SSR Markers in Medicago truncatula and Their Transferability in Leguminous and Non-Leguminous Species. Genome, 52, 761-771. http://dx.doi.org/10.1139/G09-051
- Wen, M., Wang, H., Xia, Z., Zou, M., Lu, C. and Wang, W. (2010) Development of EST-SSR and Genomic-SSR Markers to Assess Genetic Diversity in Jatropha curcas L. BMC Resarch Notes, 3, 42. http://www.biomedcentral.com/1756-0500/3/42
- Morgante, M., Hanafey, M. and Powell, W. (2002) Microsatellites Are Preferentially Associated with Nonrepetitive DNA in Plant Genomes. Nature Genetics, 30, 194-200. http://dx.doi.org/10.1038/ng822
- Riju, A, Chandrasekar, A. and Arunachalam, V. (2007) Mining for Single Nucleotide Polymorphisms and Insertions / Deletions in Expressed Sequence Tag Libraries of Oil Palm. Bioinformation, 2, 128-131. http://dx.doi.org/10.6026/97320630002128
- Kumpatla, S.P. and Mukhopadhyay, S. (2005) Mining and Survey of Simple Sequence Repeats in Expressed Sequence Tags of Dicotyledonous Species. Genome, 48, 985-998. http://dx.doi.org/10.1139/g05-060
- Garcia, R.A.V., Rangel, P.N., Brondani, C., Martins, W.S., Melo, L.C., Carneiro, M.S., Borba, T.C. and Brondani, R.P. (2011) The Characterization of a New Set of EST-Derived Simple Sequence Repeat (SSR) Markers as a Resource for the Genetic Analysis of Phaseolus vulgaris. BMC Genetic, 12, 41-54. http://dx.doi.org/10.1186/1471-2156-12-41 http://www.biomedcentral.com/1471-2156/12/41
- Ceresini, P.C., Silva, C.L.S.P., Missio, R.F., Souza, E.C., Fischer, C.N., Guillherme, I.R., Gregorio, I., Da Silva, E.H.T., Cicarelli, R.M.B., Silva, M.T.A., Garcia, J.F., Avelar, G.A., Porto Neto, L.R., Marcon, A.R., Bacci Jr., M. and Marini, D.C. (2005) Satellyptus: Analysis and Database of Microsatellites from ESTs of Eucalyptus. Genetics and Molecular Biology, 28, 589-600.
- Pinto, L.R., Oliveira, K.M., Ulian, E.C., Garcia, A.A.F. and De Souza, A.P. (2004) Survey in the Sugarcane Expressed Sequence Tag Database (SUCEST) for Simple Sequence Repeats. Genome, 47, 795-804. http://dx.doi.org/10.1139/g04-055
- Eujayl, I., Sledge, M.K., Wang, L., May, G.D., Chekhovskiy, K., Zwonitzer, J.C. and Mian, M.A.R. (2004) Medicago truncatula EST-SSRs Reveal Cross-Species Genetic Markers for Medicago spp. Theoretical and Applied Genetics, 108, 414-422. http://dx.doi.org/10.1007/s00122-003-1450-6
- Fraser, L.G., Harvey, C.F., Crowhurst, R.N. and Silva, H.N. (2003) EST-Derived Microsatellites from Actinidia Species and Their Potential for Mapping. Theoretical and Applied Genetics, 108, 1010-1016. http://dx.doi.org/10.1007/s00122-003-1517-4
- Ellis, J.R. and Burke, J.M. (2007) EST-SSRs as a Resource for Population Genetic Analyses. Heredity, 99, 125-132. http://dx.doi.org/10.1038/sj.hdy.6801001
- Sato, K., Nankaku, N. and Takeda, K. (2009) A high-Density Transcript Linkage Map of Barley Derived from a Single Population. Heredity, 103, 110-117. http://dx.doi.org/10.1038/hdy.2009.57
- Shirasawa, K., Oyama, M., Hirakawa, H., Sato, S., Tabata, S., Fujioka, T., et al. (2011) An EST-SSR Linkage Map of Raphanus sativus and Comparative Genomics of the Brassicaceae. DNA Research, 18, 221-232. http://dx.doi.org/10.1093/dnares/dsr013
- Varshney, R.K., Mahendar, T., Aggarwal, R.K. and Börner, A. (2007) Genetic Molecular Markers in Plants: Development and Applications. In: Varshney, R.K. and Tuberosa, R., Eds., Genomics-Assisted Crop Improvement: 1: Genomics Approaches and Platforms, Springer, Berlin, 13-29.
- Wang, C.M., Liu, P., Yi, C., Gu, K., Sun, F., Li, L., Lo, L.C., Liu, X., Feng, F., Lin, G., Cao, S., Hong, Y., Yi, Z. and Yue, G.H. (2011) A First Generation Microsatellite and SNP-based Linkage Map of Jatropha. PLoS ONE, 6, e23632. http://dx.doi.org/10.1371/journal.pone.0023632
- NCBI’s dbEST Database. http://www.ncbi.nlm.nih.gov/
- EGassembler. http://egassembler.hgc.jp/
- SSRlocator Version 1. [Standalone software] http://www.ufpel.tche.br/faem/fitotecnia/fitomelhoramento/faleconosco.html
- TAIR. [online] http://www.arabidopsis.org/index.jsp
- Locus Identifiers at Bulk Data Retrieval System of TAIR. http://www.arabidopsis.org/tools/bulk/go/index.jsp
- Carvalho, C.R., Clarindo, W.R., Praca, M.M., Araújo, F.S. and Carels, N. (2008) Genome Size, Base Composition and Karyotype of Jatropha curcas L., an Important Biofuel Plant. Plant Science, 174, 613-617.
- Raju, N.L., Gnanesh, B.N., Lekha, P., Jayashree, B., Pande, S., Hiremath, P.J., Byregowda, M., Singh, N.K. and Varshney, R.K. (2010) The First Set of EST Resource for Gene Discovery and Marker Development in Pigeon Pea (Cajanus cajan L.). BMC Plant Biology, 10, 45. http://www.biomedcentral.com/1471-2229/10/45
- Varshney, R.K., Thiel, T., Stein, N., Langridge, P. and Graner, A. (2002) In Silico Analysis on Frequency and Distribution of Microsatellites in ESTs of Some Cereal Species. Cell and Molecular Biology Letters, 7, 537-546.
- Cardle, L., Ramsay, L., Milbourne, D., Macaulay, M., Marshall, D. and Waug, R. (2000) Computational and Experimental Characterization of Physically Clustered Simple Sequence Repeats in Plants. Genetics, 156, 847-854.
- Metzgar, D., Bytof, J. and Wills, C. (2000) Selection against Frameshift Mutations Limits Microsatellite Expansion in Coding DNA. Genome Research, 10, 72-80.
- Morgante, M. and Olivieri, A.M. (1993) PCR-Amplified Microsatellites as Markers in Plant Genetics. The Plant Journal, 3, 175-182.
- Cho, Y.G., Ishii, T., Temnykh, S., Chen, X., Lipovich, L., McCouch, S.R., Park, W.D., Ayres, N. and Cartinhour, S. (2000) Diversity of Microsatellites Derived from Genomic Libraries and GenBank Sequences in Rice (Oryza sativa L.). Theoretical Applied Genetics, 100, 713-722. http://dx.doi.org/10.1007/s001220051343
- La Rota, M., Kantety, R.V., Yu, J.K. and Sorrells, M.E. (2005) Nonrandom Distribution and Frequencies of Genomic and EST-Derived Microsatellite Markers in Rice, Wheat, and Barley. BMC Genomics, 6, 23. http://www.biomedcentral.com/1471-2164/6/23
- Temnykh, S., DeClerck, G., Lukashova, A., Lipovich, L., Cartinhour, S. and McCouch, S. (2001) Computational and Experimental Analysis of Microsatellites in Rice (Oryza sativa L.): Frequency, Length Variation, Transposon Associations, and Genetic Marker Potential. Genome Research, 11, 1441-1452. http://dx.doi.org/10.1101/gr.184001
- Powell, W., Morgante, M., McDevitt, R., Vendramin, G.G. and Rafalski, J.A. (1995) Polymorphic Simple Sequence Repeat Regions in Chloroplast Genomes: Applications to the Population Genetics of Pines. Proceedings of National Academy of Sciences of the United States of America, 92, 7759-7763. http://dx.doi.org/10.1073/pnas.92.17.7759
Supplementary
Table A. GO annotations of ESTs-PDa.
Continued
Continued
Continued
Continued
Continued
Continued
Continued
Continued
aESTs of Jatropha curcas in the present study, which contained SSRs and also yielded primers through the online software; bESTs-PD categorized under “Molecular Function” when analyzed through TAIR; cESTs-PD categorized under “Biological Process” when analyzed through TAIR; dESTs-PD categorized under “Cellular Component” when analyzed through TAIR.
NOTES

*Corresponding author.