American Journal of Plant Sciences
Vol.4 No.5(2013), Article ID:32118,13 pages DOI:10.4236/ajps.2013.45121
Soybean Seed Protein, Oil, Fatty Acids, and Isoflavones Altered by Potassium Fertilizer Rates in the Midsouth
![]()
1Crop Genetics Research Unit, USDA-ARS, Stoneville, USA; 2Department of Plant Sciences, University of Tennessee, Jackson, USA; 3Crop Genetics Research Unit, USDA-ARS, Jackson, USA; 4Department of Plant Sciences, The University of Tennessee, Jackson, USA; 5Department of Biosystems Engineering and Soil Science, The University of Tennessee, Jackson, USA; 6Crop Production Systems Research Unit, USDA-ARS, Stoneville, USA.
Email: Nacer.Bellaloui@ars.usda.gov
Copyright © 2013 Nacer Bellaloui et al. This is an open access article distributed under the Creative Commons Attribution License, which permits unrestricted use, distribution, and reproduction in any medium, provided the original work is properly cited.
Received March 13th, 2013; revised April 25th, 2013; accepted May 10th, 2013
Keywords: Fatty Acids; Isoflavones; Oil; Oleic Acid; Potassium Fertilizer; Protein; Seed Composition
ABSTRACT
Previous research has shown that the effect of potassium fertilizer on soybean ([Glycine max (L.) Merr.] seed composition (protein, oil, fatty acids, and isoflavones) is still largely unknown. Therefore, the objective of this research was to investigate the effects of potassium application on seed protein, oil, fatty acids, and isoflavones under Midsouth environmental conditions. A three-year experiment was conducted in two locations (Milan, TN and Jackson, TN). Potassium (K) rates were applied in the form of K2O at a rate of 0 (Control, C), 45 (T1), 90 (T2), 134 (T3), and 179 (T4) kg·ha−1 in a randomized complete block design. The results showed that increasing the K application rate did not result in consistent effects on yield. However, increasing K application rate did increase protein, oleic acid, and individual and total isoflavone concentrations at both locations in 2008 and 2009. In Jackson in 2010, the increase of K rate did not change oleic acid, but resulted in an increase in glycitein and genistein isoflavone concentrations. In 2010, increasing K application rate increased protein concentrations, decreased individual and total isoflavones, and did not change oleic acid concentration at Milan. At the highest rate of K, 179 kg·ha−1, yield and some seed composition constituents were negatively impacted. Generally, K concentration in leaves at V5, R1, R3, and seed at harvest maturity stage (R8) increased with the increase of K rate applications. The research demonstrated that K application can alter seed composition, but this alteration depended on location, environmental stress factors, mainly heat and drought, K level in soil, and K application rate. Higher rates of K application may negatively impact seed composition constituents.
1. Introduction
Soybean is mainly produced for oil and soymeal, and the quality of oil and the soymeal depend on the composition of fatty acids and protein, respectively. Soybean seed contain about 42% protein and 19.5% oil [1], 33% carbohydrates [2-4], and from 1161 to 3309 µg·g−1 isoflavones [4,5]. Soybean seed contain five main fatty acids. Two are saturated fatty acids (palmitic, C16:0, ranging from 10% to 12%; stearic, C18:0, ranging from 2.2% to 7.2%), and three are unsaturated fatty acids (oleic, C18:1, about 24%; linoleic, C18:2, about 54%; linolenic, C18:3, about 8.0%) [2,6,7]. High oleic acid and low linoleic and linolenic acids are desirable because they contribute to oil stability. Soybean seeds also contain secondary metabolites such as phenolics, including isoflavones. There are three main isoflavones in soybean seed: daidzein, genistein, and glycitein [8]. Because of their functions as antiestrogens [9], antioxidants [10], and inhibitors for tyrosine protein kinase [11], isoflavones have a potential role in preventing cancer, heart disease, osteoporosis, and menopausal symptoms [12].
Seed composition constituents were reported to be genetically controlled [13-15]. However, seed composition have also shown to be affected by environment [16, 17], genotype, maturity, diseases [18-20], temperature [17,18] and drought [19,21,22], nutrients in soil and seed [23-25], and planting date [26,27]. For example, it was reported that [26] seed composition varied in the same cultivar grown in different years or under different environments in the same year, and seed protein concentration increased as planting was delayed. Significant effects of genetics and environment on isoflavones [4,5,19, 20,30-32] and on sugars [3,19,20] were observed. Isoflavone concentrations were found to vary from 1161 to 2743 μg·g−1 in 210 soybean cultivars [4]. Total and indi- vidual isoflavones were significantly affected by genotype, genotype × year, genotype × location, and genotype × year × location interactions [28]. It was reported that the concentration of isoflavones varied from 1160 to 3090 μg·g−1 in four soybean cultivars grown under the same environmental conditions, and from 460 to 1950 μg·g−1 in the same cultivar grown in different locations [29]. Other researchers showed that in the same cultivar and at the same location, year had significant effects on the total isoflavones concentration, and depending on the year, the range of isoflavone concentrations ranged from 1176 to 3309 μg·g−1 [5], and from 1176 to 1749 μg·g−1 among locations within the same year in the same cultivar [5]. It was also found that seeds exposed to high temperature during seed-fill had lower concentrations of isoflavones compared with those developed in lower temperatures [30,31].
Potassium is a major nutrient for crop growth, development, yield, and quality. It is involved in multiple physiological and biochemical process such as photosynthesis and respiration assimilates, phloem loading and transport [33], carbohydrate and amino acid transport [34], gas exchange, stomatal conductance, osmotic function [35], and nitrogen uptake and assimilation. Potassium is also involved in enzyme activation [36], plasmalemma H+- ATPase [37], protein synthesis [38], energy transfer in chloroplast and mitochondria [39], and its effect on seed protein and oil may depend on genotype and environment [40]. Potassium deficiency negatively impacts the synthesis of sugars, starch, and lipids [41].
Effects of potassium fertilizer on soybean seed composition are largely unknown [32,42,43], and information that is available focuses on the effect of K on yield and economic return [42]. Previous research on the effects of K on seed constituents showed conflicting results. For example, K fertilizer did not affect seed oil or protein [44], K fertilizer increased seed oil concentration, decreased protein concentration, altered oleic and linolenic acids [45], decreased protein synthesis in seed [46,47], or increased seed oil [42]. Therefore, the objective of this research was to further investigate the effects of K rates on seed protein, oil, fatty acids, and isoflavones in two Midsouth locations.
2. Materials and Methods
2.1. Growth Conditions and Experimental Design
Field trials were conducted on the University of Tennessee’s Research and Education Centers at Jackson and Milan from 2008 through 2010 to evaluate the effects of K application rates on seed composition and yields of soybean under no-tillage. The soils were Memphis silt loam at Jackson and Dexter loam at Milan. The experimental fields had been under continuous no-till management for over 10 years prior to experiment initiation. The previous crops were soybean at both locations.
Five K rate treatments of 0, 45, 90, 134, and 179 kg K2O·ha−1 (equal to 0, 40, 80, 120, and 160 lb K2O·ha−1) were selected for this study. The K fertilizer of all treatments was uniformly broadcast applied on soil surface as muriate of potash (0N-0P-60K2O). Each plot was 9.1 m long and 3.0 m wide. Soybean was planted with 76-cm row spacing. Soybean cultivar “Pioneer 94M80” was planted no-till in all three seasons at both locations. The planting dates were 6 May 2008, 12 May 2009, and 6 May 2010 at Jackson and 23 May 2008, 20 May 2009, and 13 May 2010 at Milan. Weed, pest, and disease control and fertilizer (except N and K) applications were conducted in a timely manner with the University of Tennessee Extension’s recommended management practices for soybean. Phosphate fertilizer was applied as needed according to the recommendations made by the University of Tennessee based on soil testing results each year [48]. Same plots and treatments were used each year. The daily rainfall and air temperature were recorded during the entire growing season each year at both locations. After soybean reached harvest maturity (R8 stage), soybean yield was determined using a plot combine to harvest a center strip of soybean 1.5 m wide ( the center two rows) for the entire plot length from each plot, and the yield was adjusted to moisture content of 130 g·kg−1 (13%) at both locations. The harvest dates were 29 September 2008, 21 October 2009, and 21 September 2010 at Jackson and 2 October 2008, 19 October 2009, and 20 September 2010 at Milan.
A randomized complete block design with four replications was used. ANOVA was conducted using the PROC MIXED model procedure in SAS [49]. Year, location, treatments, and their interactions were fixed effects and replication within year and location were considered random effects. Means were separated using PROC GLM procedure using Fisher’s least significant difference test at the 5% level.
2.2. Seed Analysis for Protein, Oil, and Fatty Acids
Seeds at harvest maturity stage (R8) were analyzed for protein, oil, and fatty acids. About 25 g of seed from each plot was ground using a Laboratory Mill 3600 (Perten, Springfield, IL) and analyzed by near infrared reflectance [18,50] using a diode array feed analyzer AD 7200 (Perten, Springfield, IL). Calibrations were initially developed by the University of Minnesota, using Perten’s Thermo Galactic Grams PLS IQ software. Protein and oil analyses were based on a seed dry matter basis [50,51], and fatty acids were analyzed based on an oil basis.
2.3. Seed Analysis for Isoflavones
Seeds at harvest maturity were analyzed for isoflavone daidzein, genistein, and glycitein concentrations. About 25 g of seed from each plot was ground using a Laboratory Mill 3600 (Perten, Springfield, IL), and isoflavones analysis was conducted following methodology previously reported [52,53] using a near-infrared reflectance (NIR) diode array feed analyzer (Perten, Spring field, IL). Calibration equations were initially developed by the University of Minnesota using Thermo Galactic Grams PLS IQ from Perten (Perten, Spring Field, IL). The analysis was performed on a dry matter basis. Total isoflavones were calculated by adding the levels of the three main isoflavones (daidzein, genistein, and glycitein) [4].
2.4. Leaf Potassium Analysis
A leaf sample consisting of twenty most recently fully developed trifoliate leaves (petiole included) was randomly collected at approximately V5 (8 July 2008, 26 June 2009 and 14 June 2010 at Jackson; 9 July 2008, 29 June 2009, and 17 June 2010 at Milan), R1 (16 July 2008, 6 July 2009, and 21 June 2010 at Jackson; 17 July 2008, 7 July 2009, and 28 June 2010 at Milan), and R3 (28 August 2008, 27 July 2009, and 26 July 2010 at Jackson;
29 August 2008, 23 July 2009, and 28 July 2010 at Milan) growth stages from each plot in each season at both locations for K concentrations determination. Leaf samples were dried in a forced air oven at 65˚C for at least 3 days and then ground in a Wiley mill (Arthur K. Thomas Co., Philadelphia) to pass a 1-mm sieve. Potassium in trifoliate leaves was analysed using the dry ash method [54]. Potassium in solution was determined by atomic absorption spectroscopy.
2.5. Seed Potassium Analysis
A seed sample was taken at harvest maturity from each plot at both locations for the determination of K concentrations. Seed samples were analyzed for K using the same procedures as for leaf samples.
Soil Potassium Analysis
A composite soil sample (10 cores per sample, 2.5-cm in diameter) was collected at the 0- to 15-cm depth randomly from each plot before treatment in each season at both locations. After soil samples were air-dried, ground to pass a 2-mm sieve, and thoroughly mixed, they were analyzed for soil basic properties by the University of Tennessee’s Soil, Plant, and Pest Center. Soil pH was determined in a 1:1 (soil:H2O) solution [55]. Soil available ,
,  , P, K, Ca, and Mg were extracted with the Mehlich I method [56].
3. Results
Analysis of variance showed that yield was significantly affected by year and location, but not by K treatment (Table 1). There were no K treatment effects or interaction between the main effects (year, location, and treatment) for yield. The most affected constituents were protein, oil, oleic acid, and individual and total isoflavones, where year, location, and treatment, and their interactions frequently showed significant effects (Table 1). This indicated that the effect of treatment (K application)

Table 1. Analysis of variance of the effect of source of variability (SV) (year, potassium rate, location, and their interactions) on seed protein, oil, fatty acids, and isoflavones in soybean grown in two locations Milan, TN and Jackson, TN, USA during 2008, 2009, and 2010†.
†Significance at P ≤ 0.05; ** Significance at P ≤ 0.01; *** Significance at P ≤ 0.001. Y = year; L = location; T = Potassium treatments; SV = Source of variability. Potassium was applied as K2O at rates of 0, 45, 90, 134, and 179 kg·ha−1. ‡TotIso = total isoflavones (daidzein+glycitein+genistein).

Table 2. Effect of potassium fertilizer rates (Treat) on yield (kg·ha−1),the concentration of seed protein (g·kg−1), oil (g·kg−1), fatty acids (g fatty acid kg−1 total oil), and isoflavones (µg·kg−1) in soybean grown in two locations Milan, TN and Jackson, TN, USA in 2008, 2009, and 2010†.
†Means within a column in each year followed by the same letter are not significantly different at the 5% level as determined by Fishers’ LSD test. Potassium was applied as K2O at rates of 0 (Control, C), 45 (T1), 90 (T2), 134 (T3), and 179 (T4) kg ha−1. TotIso=total isoflavones (daidzein+glycitein+genistein)
depended on year and location. Stearic and linoleic acid concentrations were the least affected by K application. Generally, yield in Milan was greater than in Jackson at higher rates (T2, T3, and T4) of K, and the lowest yield was recorded in 2010. There was no consistent effect of K application on yield in any year.
In 2008 in Jackson, application of K resulted in an increase of protein, oil, and oleic acid concentration, and a decrease of linolenic acid concentration compared to the control (Table 2). Compared with the control, application of K resulted in an increase in seed individual and total isoflavone concentrations at K rates 90 kg·ha−1 (T2), 134 kg·ha−1 (T3), and 179 kg·ha−1 (T4) (Table 2). In 2008 in Milan, a similar general trend was observed for oil, oleic acid, and individual and total isoflavones, except for protein concentration, where there no measurable change (Table 2). In 2008, the highest K rate (T4) resulted in a decrease of oil concentration compared with T3 in Jackson, but did not result in any significant change of oil concentration relative to T3 in Milan. In 2009 and compared with the control, application of K resulted in higher concentration of protein and oleic acids in Jackson, and higher protein, oil, oleic acid in Milan (Table 2). Individual and total isoflavones increased in response to K application in T2, T3, and T4 in Jackson (Table 2). In 2009 in Milan, K application resulted in higher individual and total isoflavones concentration in T3. However, K application at the highest rate (T4) resulted in a decrease in individual and total isoflavones in Milan (Table 2). In 2010 and compared to the control, K application resulted in higher protein in Milan only (Table 2). Although there was no clear trend in oil or fatty acids in 2010 in response to K application, oleic acid concentration was the highest in both locations compared with 2008 or 2009. Compared with the control, glycitein and genistein concentrations increased in response to K application in Jackson in 2010. In 2010 in Milan, daidzein, glycitein, genistein, and total isoflavones concentration decreased with the highest K application rate (T4). There was no clear trend for palmitic, stearic, and linolenic fatty acids in all years. Generally, protein and total isoflavone concentrations were higher in Jackson than in Milan. Since yield was either inconsistent each year or lower at higher rates of K application, this inconsistent trend impacted the total seed composition constituents (kg constituent ha−1) in each year at different rates of K application (Table 3). It appears that seed composition constituents such as protein, oil, oleic acid, and isoflavones responded more consistently to K application than yield. Based on this, seed yield may not be an indicator for seed composition quality. This explains the lack of significant, strong correlation between yield and K treatment or K concentration in leaves and seed with yield (data not shown). Total seed constituents (kg·ha−1) had inconsistent results due to inconsistent response of yield to K treatments. The higher total seed composition constituent in Milan than in Jackson reflected the yield and location effects.
3.1. Potassium in Leaves and Seed
Compared with the control, K in leaves increased with the increase of K rate in the two locations (Table 4). This trend was true for K concentration in leaves at stages V5, R1, and R3 in both locations in 2008, 2009, and 2010. In some cases, increasing the rate of K did not result in significant increase in K in leaves at different stages (V5, R1, R3) or in seeds at harvest maturity (R8). However, the application of K at highest rates resulted in an increase of K concentrations in the leaves at stages (V5, R1, R3) or in seeds at harvest maturity (R8). Potassium concentration in leaves and seed differed in each year and in each location (Table 4).
3.2. Weather Data
Air temperatures (minimum, maximum, and average) and rainfall are shown in Table Temperatures in both locations were different in each year. Temperatures in year 2008 and 2010 were higher than in 2009, and temperatures in 2010 were the highest in both locations. Both locations had similar temperatures in each year. Maximum temperatures during reproductive stages (JulySeptember) reached 33.2˚C and 34.3˚C in July and September, respectively, in Milan, and 33.4˚C and 34.2˚C in Jackson. Rainfall was higher in 2009 and 2010 than in 2008 in both locations. The driest year was recorded in 2008 in both locations.
4. Discussion
4.1. Seed Yield, Protein, Oil, and Fatty Acids
The lowest yield in 2010 may be due to the highest maximum temperatures during the reproductive stages between July and September in both locations (Table 5). The lack of K application effect on yield may be due to sufficient level of K in the soil, especially K level in Jackson, where the level of K ranged from 105 to 110 mg·kg−1, and this level could be sufficient [57,58] for growth and yield production. Although K in soil in both locations may be sufficient, K concentration in soil in Milan was much lower than in Jackson, and the lower level of K in Milan or other factors such as fertility or application and resulted in higher yield in Milan than in Jackson. The increase of protein, oil, and oleic acid in Jackson and oil and oleic acid in Milan in 2008 and 2009 with the increase of K application rates compared with
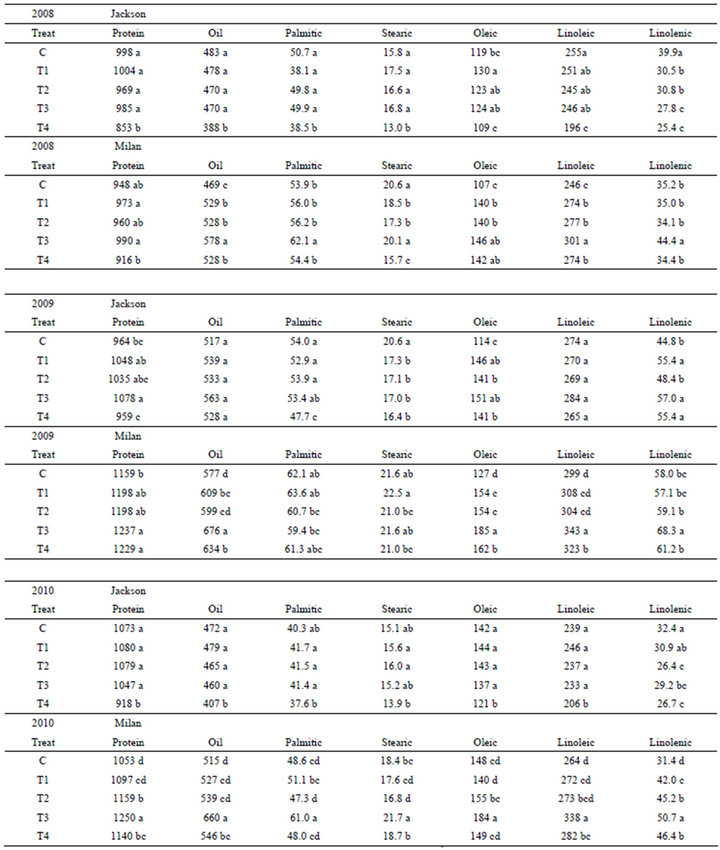
Table 3. Effect of potassium fertilizer rate (Treat) application on the total (kg constituent ha−1) seed protein, oil, and fatty acids in soybean grown in two locations Milan, TN and Jackson, TN, USA in 2008, 2009, and 2010†.
†Means within a column in each year followed by the same letter are not significantly different at the 5% level as determined by Fishers’ LSD test. Potassium was applied as K2O at rates of 0 (Control, C), 45 (T1), 90 (T2), 134 (T3), and 179 (T4) kg ha−1. Total fatty acids were measured based on the percentage of each fatty acid to total oil.
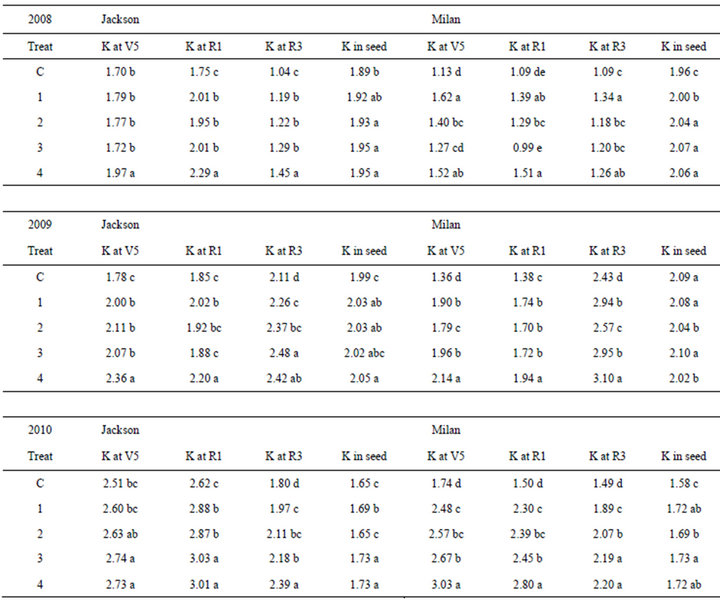
Table 4. Potassium (K) fertilizer rates (Treat) application on K percentage (%) in leaves at vegetative (V5), beginning flowering (R1), beginning pod (R3), and in mature seed at harvest maturity (R8) when soybeans were grown in two locations Milan, TN and Jackson, TN, USA in 2008, 2009, and 2010†.
†Means within a column in each year followed by the same letter are not significantly different at the 5% level as determined by Fishers’ LSD test. Potassium was applied as K2O at rates of 0 (Control, C), 45 (T1), 90 (T2), 134 (T3), and 179 (T4) kg ha−1.
the control indicated that K application had a positive effect on seed composition constituents. Palmitic and stearic acids were the least sensitive to K fertilizers. Research on the effect of potassium application on soybean seed composition is almost non-existent [42,43], and information available is still inconsistent [43]. For example, previous research showed that K fertilizer did not affect seed oil or protein [40,44], increased oil concentration, decreased protein concentration, altered oleic and linolenic acids [45], or increased seed oil [42]. Recently, it was found that P and K fertilizers significantly increased protein concentrations and K alone or in combination with P also increased seed oil concentrations [43]. In this research both protein and oil increased with the increase of K fertilizer rates, indicating that the classic inverse relationship between protein and oil may not always occur. Although these findings were also shown [43], further investigation is needed before conclusive interpretation can be made. It was shown that the rate (the increase of oil with the increase of K rate over time) of oil increase decreased with higher K rates [43], indicating lack of linear correlation between K rate increase and the increase in seed constituents. Our results are in agreement with previous research [42,43,59], but in disagreement with those found by others [60] who reported that oil decreased with the increase of P and K fertilization rates, or those found by others [40,44] who found that K fertilizer did not affect seed oil or protein. Based
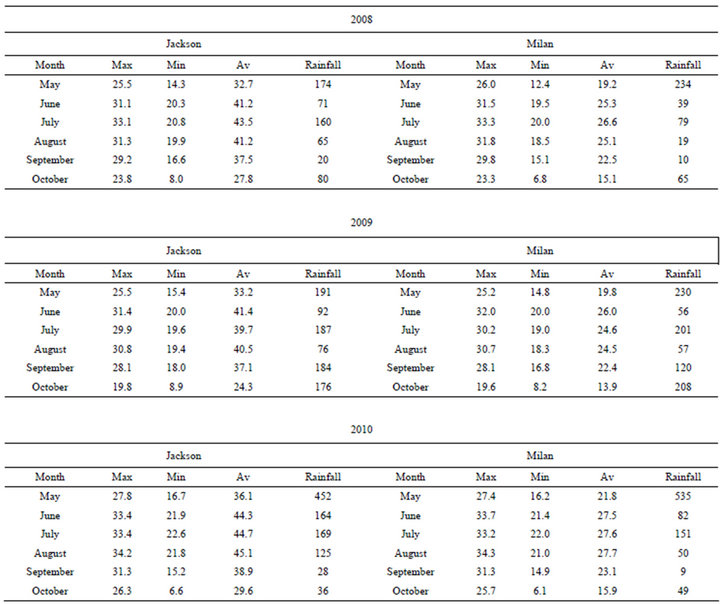
Table 5. Maximum (Max), minimum (Min), average (Av), and rainfall in Jackson and Milan, TN in 2008, 2009, and 2010.
on our experiment, the reported oil decrease with the increase K fertilization rates [60] or non-change of oil or protein concentration with K fertilizer [44] could be due to differences in the environmental conditions (probably drought and heat), location, cultivar differences [40], and K rate. Our experiment showed that in 2008 oil concentration did not result in increase with the increase in K between the intermediate rate (T3) and highest rate in Jackson. At Milan, the highest K rate (T4) had lower oil concentration compared with T3, reflecting the possible negative impact of higher rates of K application on seed composition [40].
The different concentrations of seed constituents among years in both locations reflected the effect of environmental factors on seed composition constituents. It was reported that seed constituents were affected by environment [16,17,40], temperature [17,18], drought [19,21,22,40], and nutrients in soil and seed [3-5]. It was reported that seed constituents vary in the same soybean cultivar grown in different years or under different environments in the same year [26]. In this study, differences of seed constituents between years and locations may be due to the maximum temperatures differences or drought. For example, maximum temperature was highest at 33.2˚C, 34.3˚C, and 31.3˚C in July, August, and September respectively during critical reproductive stages in Milan 2010, and only 50 and 9 mm of rainfall were recorded in August and September (seed-fill stage period) at Milan 2010 (Table 5). It was shown that maximum temperature had significant effects on seed protein, oil, and fatty acids, and the increase or decrease of seed oil or protein concentration dependent on the temperature range under which soybean seed mature [18]. Other researchers also found that maximum temperatures correlated better with seed composition than minimum temperatures [61,62]. Therefore, the lower seed protein and oil concentrations in Milan than in Jackson could be due to combination of high maximum temperatures and lower rainfall (drought stress). Although the maximum temperatures in Milan and Jackson were generally similar, except in 2010, the rainfall was different between the two locations, especially during the seed-fill period in August and September. This difference in rainfall can expose soybean seed during this critical period to different level of drought stress. Previous research on irrigation in the Midsouth, using soil water potential sensors, showed that −15 kPa represented the water field capacity, −50 to −60 kPa represented water stress level where irrigation is needed for higher yield, and −100 kPa represented drought conditions where yield and seed composition can be negatively impacted [22]. Previous research also showed that after a regular irrigation (once per 7 to 10 days), soybean required about 56.8 mm of water per week to 10 days to avoid water stress (Bellaloui and Mengistu, 2008). It was shown that in the Midsouth pan evaporation was typically 6.35 mm·day-1 during R1 (beginning of flowering) to R6 (full seed-fill) and about 76.2 mm of water was needed for about every 12 days for cracking soil and furrow irrigation [63]. Since the experiment was not irrigated and rainfall was low during reproductive stages, especially in Milan and Jackson in 2008 and 2010, drought may have occurred, resulting in differences in seed constituents concentrations between years and locations.
4.2. Seed Daidzein, Glycitein, Genistein, and Total Isoflavones
The significant effects of year, location, treatment (K application rates), and their interactions on individual and total isoflavones indicated the significant influence of these factors on isoflavones. The interaction between year, location, and treatment indicated that the level of treatment effects depended on year and location, reflecting the environmental effects of the growing season on isoflavones. Previous research reported that isoflavones were significantly influenced by genotype × year, genotype × location, and genotype × year × location interactions [28,29,32]. It was reported that the concentrations of isoflavones varied from 460 to 1950 μg·g−1 in the same cultivar grown in different locations [29], and in the same cultivar and in the same location, year had significant effects on the total isoflavones concentration which ranged, depending on the year, from 1176 to 3309 μg·g−1 [5]. It was also reported that location had a significant effects on isoflavones, and isoflavone concentration varied from 1176 to 1749 μg·g−1 among locations within the same year in the same cultivar [5]. It was found that seed developed at high temperature during seed-fill had lower concentration of isoflavones compared with seed developed at lower temperatures [30, 31].
The increase of individual and total isoflavone concentrations in 2008, 2009, and 2010 in Jackson, and in 2008 and 2009 in Milan with the increase of K fertilizer rates indicated that K can alter isoflavones concentrations. The decrease of individual and total isoflavones after the maximum concentration of isoflavones were reached, as in Milan 2009, may be due to possible negative effects of extremely high K rates on isoflavone concentrations. The different concentrations of individual and total isoflavones in each year and in each location may be due to environmental effects such as temperature and drought in each year, K concentration in soil in each location and K concentrations in leaves and seed. Previous research showed that isoflavones have been affected by biotic and abiotic factors, including air temperature, soil moisture, soil fertility, and diseases [31,31]. It was reported that on soils low to medium in potassium K, seed isoflavone concentrations may be increased by 20% by K fertilization (90 kg·K·ha−1) compared with an unfertilized control [57]. On the other hand, it was reported that K application did not increase isoflavones, and it was explained that this could be due to high soil fertility [32]. It was also reported that a direct deep-banded K or residual surface-applied K on low-K soils resulted in higher concentrations of daidzein, genistein, and total isoflavone; however, application of K on medium to high K concentration in soil had less effect on isoflavones [57]. In our experiment K concentration increased in leaves at R1 (beginning of flowering), R3 (beginning of seed pod), and in seed with the increase of K rate increases in 2008, 2009, and 2010 in Jackson (Table 4). In Milan, K rate increases resulted in K concentration increase in leaves at V5 in 2009 and 2010, in leaves at R1 in 2008 and 2010, in leaves at R3 in 2008, 2009, and 2010 in leaves at R1 in 2008, and in seed in 2008 and 2010 (Table 4). Therefore, in most cases, there was a positive response of leaves and seed to K fertilizer increases. It was also reported that individual and total isoflavones were often positively correlated with leaf and seed K in low-K soils, and therefore, K management could become an effective tool to increase isoflavones in low K soils [57]. Our results are in agreement with those of previous research [43,57], but in disagreement with those of others [32]. The decrease of individual and total isoflavones with the extremely high K rate application, such as in 2010 in Milan, indicated that K fertilizer application at extremely high rates can have negative effects on isoflavones. It appears that the positive, negative, or no effects of K fertilizer on isoflavones depends on the environmental factors (mainly temperature and drought stress), location, K level in soil, K rate applied, and soil type.
5. Conclusion
Our experiment demonstrated that K fertilizer can alter seed protein, oil, oleic acid, and isoflavones. However, the alteration (increase or decrease) of these seed composition constituents depended on K rate, yearly environmental factors, such as drought and temperature, location, and K level in soil. The interaction between K rate and year, and between K rate and location for seed protein, oil, oleic, and isoflavones signifies the sensitivity of the seed constituents to the environment, creating a challenge for the breeding program to select for high seed oil, protein, and isoflavone breeding lines that produce high stable levels of these constituents under drought and warm environment and across locations. The lack of positive responses or decrease of oil and isoflavones to the highest rate of K fertilizer (T4), in some cases such as in 2010 in Milan, may indicate possible negative effects of K fertilizer on seed composition constituents at high rates of K. Although the recommended rate (either 0 or 45 kg·ha−1) of K in TN may be adequate for yield on the test fields, higher K rates than the recommended could be beneficial for improving seed composition constituents. The mechanisms explaining the stimulatory or inhibitory effects of K nutrition on seed constituents remain largely unknown and require further research.
6. Acknowledgements
The authors are thankful to Robert Sharp, James McClure, Jason Williams, and James Warren, for high quality field work and to Sandra Mosley for seed composition analysis. The US Department of Agriculture (USDA) prohibits discrimination in all its programs and activities on the basis of race, color, national origin, age, disability, and where applicable, sex, marital status, familial status, parental status, religion, sexual orientation, genetic information, political beliefs, reprisal, or because all or part of an individual’s income is derived from any public assistance program. (Not all prohibited bases apply to all programs.) Persons with disabilities who require alternative means for communication of program information (Braille, large print, audiotape, etc.) should contact USDA’s TARGET Center at (202) 720-2600 (voice and TDD). To file a complaint of discrimination, write to USDA, Director, Office of Civil Rights, 1400 Independence Avenue, S.W., Washington, D.C. 20250- 9410, or call (800)
795-3272 (voice) or (202) 720-6382 (TDD). USDA is an equal opportunity provider and employer.
REFERENCES
- R. F. Wilson, “Seed Composition,” In: H. R. Boerma and J. E. Specht, Eds., Soybeans: Improvement, Production, and Uses, 3rd Edition, ASA Monogr, 16. ASA, Madison, 2004, pp. 621-669.
- T. Hymowitz and F. I. Collins, “Variability of Sugar Content of Seed of Glycine max (L.) Merr. and G. soja Serb. and Zucco,” Agronomy Journal, Vol. 66, No. 2, 1974, pp. 239-240. doi:10.2134/agronj1974.00021962006600020017x
- N. Bellaloui, J. R. Smith, A. M. Gillen and J. D. Ray, “Effect of Maturity on Seed Sugars as Measured on NearIsogenic Soybean (Glycine max) Lines,” Crop Science, Vol. 50, No. 5, 2010, pp. 1978-1987. doi:10.2135/cropsci2009.10.0596
- C. Wang, M. Sherrard, S. Pagadala, R. Wixon and R. A. Scott, “Isoflavone Content among Maturity Group 0 to II Soybeans,” Journal of the American Oil Chemist’s Society, Vol. 77, No. 5, 2000, pp. 483-487. doi:10.1007/s11746-000-0077-6
- H. Wang and P. Murphy, “Isoflavone Composition of American and Japanese Soybeans in Iowa. Effects of Variety, Crop Year, and Location,” Journal of Agricultural and Food Chemistry, Vol. 42, No. 8, 1994, pp. 1674- 1677. doi:10.1021/jf00044a017
- J. H. Cherry, L. Bishop, P. M. Hasegawa and H. R. Leffler, “Differences in the Fatty Acid Composition of Soybean Seed Produced in Northern and Southern Areas of the USA,” Phytochemistry, Vol. 24, No. 2, 1985, pp. 237- 241. doi:10.1016/S0031-9422(00)83527-X
- S. R. Schnebly and W. R. Fehr, “Effect of Years and Planting Dates on Fatty Acid Composition of Soybean Genotypes,” Crop Science, Vol. 33, No. 4, 1993, pp. 716- 719. doi:10.2135/cropsci1993.0011183X003300040016x
- X. Yin and T. J. Vyn, “Relationships of Isoflavone, Oil, and Protein in Seed with Yield of Soybean,” Agronomy Journal, Vol. 97, No. 5, 2005, pp. 1314-1321. doi:10.2134/agronj2004.0316
- H. Adlercreutz, T. Fotsis and C. Bannwart, “Determination of Urinary Lignans and Phytoestrogen Metabolites, Potential Antiestrogens and Anticarcinogens, in Urine of Women on Various Habitual Diets,” Journal of Steroid Biochemistry, Vol. 25, No. 5, 1986, pp. 791-797. doi:10.1016/0022-4731(86)90310-9
- M. Naim, B. Gestetner, A. Bondi and Y. Birk, “Antioxidative and Antihemolytic Activity of Soybean Isoflavones,” Journal of Agricultural and Food Chemistry, Vol. 22, No. 5, 1974, pp. 806-811. doi:10.1021/jf60195a031
- T. Akiyama, J. Ishida, S. Nakagawa, H. Ogawara, S. Watanabe, N. Itoh, M. Shiuya and Y. Fukami, “Genistein, a Specific Inhibitor of Tyrosine Protein Kinases,” Journal of Biological Chemistry, Vol. 262, No. 12, 1987, pp. 5592- 5595.
- M. Messina, “Modern Applications for an Ancient Bean: Soybeans and the Prevention and Treatment of Chronic Disease,” Journal of Nutrition, Vol. 125, No. 3, 1995, pp. S567-S569.
- A. M. Simpson Jr. and J. R. Wilcox, “Genetic and Phenotypic Associations of Agronomic Characteristics in Four High Protein Soybean Populations,” Crop Science, Vol. 23, No. 6, 1983, pp. 1077-1081. doi:10.2135/cropsci1983.0011183X002300060013x
- E. E. Hartwig and T. C. Kilen, “Yield and Composition of Soybean Seed from Parents with Different Protein, Similar Yield,” Crop Science, Vol. 31, No. 2, 1991, pp. 290-292. doi:10.2135/cropsci1991.0011183X003100020011x
- T. C. Helms and J. H. Orf, “Protein, Oil, and Yield of Soybean Lines Selected for Increased Protein,” Crop Science, Vol. 38, No. 3, 1998, pp. 707-711.
- D. M. Maestri, D. O. Labuckas, J. M. Meriles, A. L. Lamarques, J. A. Zygadlo and C. A. Guzman, “Seed Composition of Soybean Cultivars Evaluated in Different Environmental Regions,” Journal of the Science of Food and Agriculture, Vol. 77, No. 4, 1998, pp. 494-498. doi:10.1002/(SICI)1097-0010(199808)77:4<494::AID-JSFA69>3.0.CO;2-B
- J. L. Dardanelli, M. Balzarini, M. J. Martinez, M. Cuniberti, S. Resnik, S. F. Ramunda, R. Herrero and H. Baigorri, “Soybean Maturity Groups, Environments, and Their Interaction Define Mega-Environments for Seed Composition in Argentina,” Crop Science, Vol. 46, No. 5, 2006, pp. 1939-1947. doi:10.2135/cropsci2005.12-0480
- N. Bellaloui, J. R. Smith, J. D. Ray and A. M. Gillen, “Effect of Maturity on Seed Composition in the Early Soybean Production System as Measured on Near-Isogenic Soybean Lines,” Crop Science, Vol. 49, No. 2, 2009, pp. 608-620. doi:10.2135/cropsci2008.04.0192
- N. Bellaloui, A. Mengistu, D. K. Fisher and C. A. Abel, “Soybean Seed Composition Constituents as Affected by Drought and Phomopsis in Phomopsis Susceptible and Resistant Genotypes,” Journal of Crop Improvement, Vol. 26, No. 3, 2012, pp. 428-453. doi:10.1080/15427528.2011.651774
- N. Bellaloui, A. Mengistu, L. H. S. Zobiole and W. T. Shier, “Resistance to Toxin-Mediated Fungal Infection: Role of Lignins, Isoflavones, Other Seed Phenolics, Sugars, and Boron in the Mechanism of Resistance to Charcoal Rot Disease in Soybean,” Toxin Reviews, Vol. 31, No. 1-2, 2012, pp. 16-26. doi:10.3109/15569543.2012.691150
- J. E. Specht, K. Chase, M. Macrander, G. L. Graef, J. Chung, J. P. Markwell, H. H. Orf and K. G. Lark, “Soybean Response to Water: A QTL Analysis of Drought Tolerance,” Crop Science, Vol. 41, No. 2, 2001, pp. 493- 509. doi:10.2135/cropsci2001.412493x
- N. Bellaloui and A. Mengistu, “Seed Composition Is Influenced by Irrigation Regimes and Cultivar Differences in Soybean,” Irrigation Science, Vol. 26, No. 3, 2008, pp. 261-268. doi:10.1007/s00271-007-0091-y
- A. N. Kravchenko and D. G. Bullock, “Spatial Variability of Soybean Quality Data as a Function of Field Topography: II. A Proposed Technique for Calculating the Size of theArea for Differential Soybean Harvest,” Crop Science, Vol. 42, No. 3, 2002, pp. 816-821. doi:10.2135/cropsci2002.0816
- A. N. Kravchenko and D. G. Bullock, “Spatial Variability of Soybean Quality Data as a Function of Field Topography: I. Spatial Data Analysis,” Crop Science, Vol. 42, No. 3, 2002, pp. 804-815. doi:10.2135/cropsci2002.0804
- N. Bellaloui, J. E. Hanks, D. K. Fisher and A. Mengistu, “Soybean Seed Composition Is Influenced by With-In Field Variability in Soil Nutrients,” Crop Management, 2009. doi:10.1094/CM-2009-1203-01-RS
- T. C. Helms, C. R. Hurburgh Jr., R. L. Lussenden and D. A. Whited, “Economic Analysis of Increased Protein and Decreased Yield Due to Delayed Planting of Soybean,” Journal of Production Agricultural, Vol. 3, No. 3, 1990, pp. 367-371. doi:10.2134/jpa1990.0367
- N. Bellaloui, K. N. Reddy, A. M. Gillen, D. K. Fisher and A. Mengistu, “Influence of Planting Date on Seed Protein, Oil, Sugars, Minerals, and Nitrogen Metabolism in Soybean Under Irrigated and Non-irrigated Environments,” American Journal of Plant Science, Vol. 2, 2011, pp. 702- 715. doi:10.4236/ajps.2011.25085
- J. A. Hoeck, W. R. Fehr, P. A. Murphy and G. A. Welke, “Influence of Genotype and Environment on Isoflavone Contents of Soybean,” Crop Science, Vol. 40, No. 1, 2000, pp. 48-51. doi:10.2135/cropsci2000.40148x
- A. Eldridge and W. Kwolek, “Soybean Isoflavones: Effect of the Environment and Variety on Composition,” Journal of Agricultural Food Chemistry, Vol. 31, No. 2, 1983, pp. 394-396. doi:10.1021/jf00116a052
- K. Kitamura, K. Igita, A. Kikuchi, S. Kudou and K. Okubo, “Low Isoflavone Content in Some Early Maturing Cultivars, So Called ‘Summer-Type Soybeans’,” Japanese Journal Breeding, Vol. 41, 1991, pp. 651-654.
- C. Tsukamoto, S. Shimada, K. Igita, S. Kudou, M. Kokubun, K. Okubo and K. Kitamur, “Factors Affecting Isoflavone Content in Soybean Seeds: Changes in Isoflavones, Saponins, and Composition of Fatty Acids at Different Temperatures during Seed Development,” Journal of Agricultural and Food Chemistry, Vol. 43, No. 5, 1995, pp. 1184-1192. doi:10.1021/jf00053a012
- P. Seguin and W. Zheng, “Potassium, Phosphorus, Sulfur, and Boron Fertilization Effects on Soybean Isoflavone Content and other Seed Characteristics,” Journal of Plant Nutrition, Vol. 29, No. 4, 2006, pp. 681-698.
- K. Mengel and H. E. Haeder, “Effect of Potassium Supply on the Rate of Phloem Sap Exudation and the Composition of Phloem Sap of Ricinus communis,” Plant Physiology, Vol. 59, No. 2, 1977, pp. 282-284. doi:10.1104/pp.59.2.282
- K. Mengel, M. Secer and K. Koch, “Potassium Effect on Protein Formation and Amino Acid Turnover in Developing Wheat Grain,” Agronomy Journal, Vol. 73, No. 1, 1981, pp. 74-78. doi:10.2134/agronj1981.00021962007300010018x
- D. A. Baker and P. E. Weatherley, “Water and Solute Transport by Exuding Root Systems of Ricinus communis,” Journal of Experimental Botany, Vol. 20, No. 3, 1969, pp. 485-496. doi:10.1093/jxb/20.3.485
- C. Miller, “Potassium Selectivity in Proteins-Oxygen Cage or in the Face,” Crop Science, Vol. 261, No. 5129, 1993, pp. 1692-1693.
- K. H. Mühling, S. Schubert and K. Mengel, “Role of Plasmalemma H+ ATPase in Sugar Retention by Roots of Intact Maize and Field Bean Plants,” Zeitschrift für Pflanzenernährung und Bodenkunde, Vol. 156, No. 2, 1993, pp. 155-161. doi:10.1002/jpln.19931560210
- R. G. W. Jones and A. Pollard, “Proteins, Enzymes and Inorganic Ions,” In: A. Läuchli and R. L. Bieleski, Eds., Inorganic Plant Nutrition, Springer, New York, 1983, pp. 528-562.
- A. L. Kursanov and E. Vyskrebentzewa, “The Role of Potassium in Plant Metabolism and the Biosynthesis of Compounds Important for the Quality of Agricultural Products,” In: Potassium and the Quality of Agricultural Products, International Potash Institute, Bern, 1966, pp. 401-420.
- K. Krueger, A. S. Goggi, A. P. Mallarino and R. E. Mullen, “Phosphorus and Potassium Fertilization Effects on Soybean Seed Quality and Composition,” Crop Science, Vol. 53, No. 2, 2013, pp. 602-610. doi:10.2135/cropsci2012.06.0372
- D. Anac and H. Colakoglu, “Current Situation of K Fertilization in Turkey,” In: K. Mengel and K. Krauss, Eds., K Availability of Soils in West Asia and North AfricaStatus and Perspectives, International Potash Institute, Basel, 1995, pp. 235-247.
- X. Yin and T. J. Vyn, “Potassium Placement Effects on Yield and Seed Composition of No-Till Soybean Seeded in Alternate Row Widths,” Agronomy Journal, Vol. 95, No. 1, 2003, pp. 126-132. doi:10.2134/agronj2003.0126
- M. K. Abbasi, M. M. Tahir, W. Azam, Z. Abbas and N. Rahim, “Soybean Yield and Chemical Composition in Response to Phosphorus-Potassium Nutrition in Kashmir,” Agronomy Journal, Vol. 104, No. 5, 2012, pp. 1476-1484. doi:10.2134/agronj2011.0379
- J. A. Lutz, G. R. Jones and E. B. Hale, “Chemical Composition and Yield of Soybeans as Affected by Irrigation and Deep Placement of Lime, Phosphorus and Potassium,” Journal of the Indian Society of Soil Science, Vol. 21, No. 4, 1973, pp. 475-483.
- E. M. Gaydou and J. Arrivets, “Effects of Phosphorus, Potassium, Dolomite, and Nitrogen Fertilization on the Quality of Soybean Yields, Protein and Lipids,” Journal of Agricultural and Food Chemistry, Vol. 31, No. 4, 1983, pp. 765-769. doi:10.1021/jf00118a022
- K. Koch and K. Mengel, “The Influence of the Level of Potassium Supply to Young Tobacco Plants (Nicotiana tabacum L.) on Short-Term Uptake and Utilization of Nitrate-Nitrogen (15N),” Journal of the Science of Food and Agriculture, Vol. 25, No. 5, 1974, pp. 465-471. doi:10.1002/jsfa.2740250504
- K. Koch and K. Mengel, “Effect on K and N Utilization of Spring Wheat during Grain Protein Formation,” Agronomy Journal, Vol. 69, No. 3, 1977, pp. 477-480. doi:10.2134/agronj1977.00021962006900030036x
- H. J. Savoy and D. Joines, “Lime and Fertilizer Recommendations for the Various Crops of Tennessee,” Chapter 2, Agronomic Crops, 2009.
- SAS, “SAS 9.1 TS LeVel 1M3, Windows Version 5.1.2600,” SAS Institute, Cary, 2001.
- J. R. Wilcox and R. M. Shibles, “Interrelationships among Seed Quality Attributes in Soybean,” Crop Science, Vol. 41, No. 1, 2001, pp. 11-14. doi:10.2135/cropsci2001.41111x
- E. Boydak, M. Alpaslan, M. Hayta, S. Gercek and M. Simsek, “Seed Composition of Soybeans Grown in the Harran Region of Turkey as Affected by Row Spacing and Irrigation,” Journal of Agricultural Food Chemistry, Vol. 50, No. 16, 2002, pp. 4718-4720. doi:10.1021/jf0255331
- J. Morrison, E. R. Cober, M. F. Saleem, N. B. McLaughlin, J. Fregeau-Reid, B. L. Ma, W. Yan and L. Woodrow, “Changes in Isoflavone Concentration with 58 Years of Genetic Improvement of Short-Season Soybean Cultivars in Canada,” Crop Science, Vol. 48, No. 6, pp. 2201-2208. doi:10.2135/cropsci2008.01.0023
- T. Sato, K. Eguchi, T. Hatano and Y. Nishiba, “Use of Near-infra Red Reflectance Spectroscopy for the Estimation of Isoflavone Contents of Soybean Seeds,” Plant Production Science, Vol. 11, No. 4, 2008, pp. 481-486. doi:10.1626/pps.11.481
- R. G. Gavlak, D. A. Horneck and R. O. Miller, “Plant, Soil and Water Reference Methods for the Western Region,” Western Regional Extension Publication (WREP) 125, University of Alaska, Fairbanks, 1994.
- M. E. Watson and J. R. Brown, “pH and Lime Requirement,” In: J. R. Brown, Ed., Recommended Chemical Soil Test Procedures for the North Central Region, No. 221, NCR Research Publication, University of Missouri, Columbia, 1998, pp. 13-16.
- J. T. Sims, “Comparison of Mehlich 1 and Mehlich 3 Extractants for P, K, Ca, Mg, Mn, Cu and Zn in Atlantic Coastal Plain Soils,” Community Soil Science Plant Analogy, Vol. 20, No. 17-18, 1989, pp. 1707-1726. doi:10.1080/00103628909368178
- T. J. Vyn, X. H. Yin, T. W. Bruulsema, C. J. C. Jackson, I. Rajcan and S. M. Brouder, “Potassium Fertilization Effects on Isoflavone Concentrations in Soybean [Glycine max (L.) Merr.],” Journal of Agricultural and Food Chemistry, Vol. 50, No. 12, 2002, pp. 3501-3506. doi:10.1021/jf0200671
- G. Rehm and M. Schmitt, “Potassium for Crop Production,” Regents of the University of Minnesota, 2002, Verified on May 22, 2013. http://www.extension.umn.edu/distribution/cropsystems/dc6794.html
- M. Haq and A. P. Mallarino, “Response of Soybean Grain Oil and Protein Concentrations to Foliar and Soil Fertilization,” Agronomy Journal, Vol. 97, No. 3, 2005, pp. 910-918. doi:10.2134/agronj2004.0215
- [61] G. D. Jones and J. A. Lutz Jr., “Yield of Wheat and Soybeans and Oil and Protein Content of Soybean as Affected by Fertility Treatments and Deep Placement of Limestone,” Agronomy Journal, Vol. 63, No. 6, 1971, pp. 931-934. doi:10.2134/agronj1971.00021962006300060033x
- [62] R. W. Howell and J. L. Cartter, “Physiological Factors Affecting Composition of Soybeans: I. Correlation of Temperature During Certain Portions of the Pod Filling Stage with Oil Percentage in Mature Beans,” Agronomy Journal, Vol. 45, No. 11, 1953, pp. 526-528. doi:10.2134/agronj1953.00021962004500110002x
- [63] J. R. Wilcox and J. F. Cavins, “Normal and Low Linolenic Acid Soybean Strains: Response to Planting Date,” Crop Science, Vol. 32, No. 5, 1992, pp. 1248-1251. doi:10.2135/cropsci1992.0011183X003200050037x
- [64] L. G. Heatherly, “Early Soybean Production System (ESPS),” In: L. G. Heatherly and H. F. Hodges Eds, Soybean Production in the Midsouth, CRC Press, Boca Raton, 1999, pp. 103-118.