American Journal of Plant Sciences
Vol.4 No.4(2013), Article ID:29705,14 pages DOI:10.4236/ajps.2013.44098
Stability of Brazilian Seasonally Dry Forests under Climate Change: Inferences for Long-Term Conservation
![]()
1Laboratório de Genética & Biodiversidade, Instituto de Ciências Biológicas, Universidade Federal de Goiás, Goiânia, Brazil; 2Laboratório de Macroecologia, Universidade Federal de Goiás, Jataí, Brazil; 3Departamento de Ecologia, Instituto de Ciências Biológicas, Universidade Federal de Goiás, Goiânia, Brazil.
Email: *rosanegc68@hotmail.com
Copyright © 2013 Rosane G. Collevatti et al. This is an open access article distributed under the Creative Commons Attribution License, which permits unrestricted use, distribution, and reproduction in any medium, provided the original work is properly cited.
Received February 10th, 2013; revised March 11th, 2013; accepted March 31st, 2013
Keywords: Cerrado Biome; Ecological Niche Modelling; Global Climate Change; Quaternary Climate Change; Gap Analysis
ABSTRACT
We identified climatically stable areas of seasonally dry forests (SDFs) from Central Brazil through time and assessed the effectiveness of the current reserves network in representing these climatically stable areas, as well as areas of high suitability in the present or in the future only. We used an ensemble approach based on several methods for ecological niche modelling (ENMs) to obtain potential distributions 16 SDF’ species for past (last glacial maximum), present, and future (end of XXI century) climate scenarios. We then computed how many current Brazilian reserves matched both stable areas (suitable areas for all time periods), present and future geographical ranges alone for each species, in a multi-level gap analysis. We found range shifts due to climate changes for SDF’ species. Although the future geographical range and stable areas for all analyzed species matched at least with one reserve, many protected areas will lose importance in protecting suitable areas for species in the future. Moreover, the current Brazilian reserves cover only a small amount of their climatically stable areas. However, some reserves will be suitable for many SDF’ species (90%) at the same time, but climatically stable for only half of them. Our findings show that vegetation community from SDFs may persist in Brazilian territories until the end of XXI century, and challenges about long-term conservation of the SDFs may be partially reached with already existing Brazilian reserve network, however the reserves should be connected to permit habitat tracking.
1. Introduction
Brazil is one of the most diverse countries in the world [1], with at least 19% of all existing plant species [2]. In contrast, it also has the highest number of threatened species according to the IUCN classification (www. iucnredlist.org), mainly due to habitat loss driven by the fast and uncontrolled agriculture expansion [3]. In order to avoid such a loss, Brazilian Government implemented a National System of Conservation Unities [4] and also 900 priority areas for conservation in the different Biomes—385 areas in Amazonia, 82 in Caatinga, 87 in Cerrado and Pantanal, 164 in the cost and ocean regions and 182 in Atlantic Forest and subtropical grasslands in Southern Brazil [5]. However, because seasonally dry tropical forests (SDFs hereafter) from Central and Northeastern Brazil (mainly in Brazilian “Cerrado”, or savannas) are not defined as an independent phytogeographical unity, but as a vegetation physiognomy embedded in other biomes [6], the conservation of these forests is hardly guaranteed by such policies [7,8].
Seasonally dry tropical forests are deciduous and semideciduous forests distributed in regions characterized by mean annual precipitation below 1600 mm and a distinct seasonality in rainfall [9]. They have high plant species diversity and endemism, usually 30 - 90 tree species/ha [10], with high variation among sites (β diversity) [11]. Because of the pronounced seasonality, dry forests usually reduce or stop growing during dry season [10], thus net primary productivity and basal area are 50% to 75% lower than in rain forests. Also, because the simpler community structure, SDFs can potentially recover faster from disturbance than rain forests, which have a more complex structure [10,12].
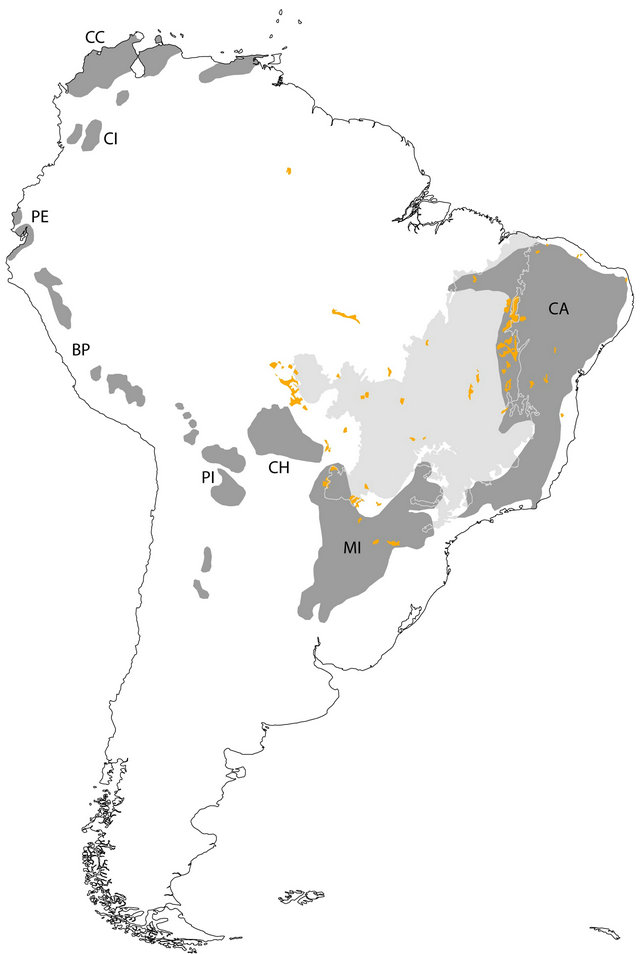
Originally, ~40% of the tropical and subtropical regions were dominated by forests, out of which ~42% were SDFs [9]. Currently, only ~1,048,700 km2 of tropical dry forest remains [13,14]. Most of their remaining areas are in South America (~54.2%), mainly in Northeast and Central Brazil and in Southeast Bolivia, Paraguay and Northern Argentina (Figure 1(a)), which represents ~22% of the forested area in this Continent [9]. In Brazil, the SDFs are distributed from the Northeast [15,16], in Caatinga (Figure 1(a)), towards the Southwest in Misiones nucleus (encompassing also the northeastern Argentina and eastern Paraguay), and also are scattered throughout other vegetation types such as Amazonia and savannas in Central Brazil [17], in areas of eutrophic and oligotrophic soils with moderate pH values and low levels of aluminium [18].
Most remaining areas of SDFs in Brazil are threatened mainly by agricultural expansion, harvesting for wood products and the increase of fire frequency due to agricultural practices [8]. For example, in Central Brazil, in the last 50 years, savanna and dry forests in the Cerrado biome have been rapidly replaced by crops and pasture [19] and only 2.2% of the Cerrado is protected in conservation units (CUs). Using Landsat imagery, Bianchi & Haig [20] estimated that deforestation and fragmentation in the Paranã River Basin, the most significant dry forest remains in the Central Brazil, caused a decrease of ~66.3% in forest extent between 1977 and 2008, with an annual rate of 3.5%. If this rate holds in the next years, SDFs may disappear in ~25 yr in this region [8].
Added to the direct anthropogenic disturbances, climate changes may cause a strong impact on SDFs biodiversity due to climatically suitable area loss [21,22]. Because current global warming occur at very high rates, range shift with retraction is more likely due to niche conservatism than adaptation to changing environment, which can increase the extinction rates [23,24]. Climate change also poses a major challenge to long-term SDFs conservation in the current reserve networks because focal species may shift their range away from current reserves boundaries, tracking for suitable areas [25,26]. This may result in a different spatial distribution of SDFs in the future. Although there are evidences of SDFs expansion during the glacial periods of the Quaternary [15, 27,28], the response of Neotropical vegetation is still poorly understood [9,22,28-30] with idiosyncratic responses among species [30,31]. Thus, bringing out the climate-induced variation in SDFs distribution through the time is a fundamental first step to evaluate the effectiveness of the current reserve design to preserve species in the future and to anticipate appropriate management actions to avoid biodiversity losses in the near time. In this sense, gap analysis has been used as a tool to assess the effectiveness of protected areas [32].
Ecological Niche Modelling (ENM) has increasingly been used to predict the effects of climate changes through time on species distribution [33-35]. Applications of ENMs for conservation purposes are frequently based on mapping the location of climatically suitable areas in the future [25] or investigating the historical distribution of entire vegetation communities (refugia) by modelling the potential distribution of biomes [22,36]. However, attempts to hindcast or forecast entire biome distribution based on randomly chosen training points in a defined area of the present distribution of the vegetation community of interest [22,36] may retrieve misleading results due to the mismatch between species distribution and biome boundaries, because the dominant species usually used to define vegetation communities may also occur in other communities [37].
Additionally, due to changes in climatic suitability over time, historically stable areas in the Quaternary (historical refugia) may not remain suitable in the present or future. Thus, climatic stability over time and shifts in suitable area in the future may have important consequences for conservation planning under climate change scenario. First, species may occupy areas previously unoccupied because of spatial shifts in climatic conditions, changing community composition and interactions among species [38]. Second, priority areas for conservation may be inappropriately settled in unsuitable areas in the future if the conservation planning does not cope with future climate scenarios [25]. In addition, areas of climatic stability over time may be important for long-term conservation because they affect population genetic diversity [27,39,40]. In one hand, demographic stability in climatic stable areas may lead to high effective population size and genetic variation [41] decreasing the risk of extinction due to multiple Allee effects [42]. On the other hand, range shifts and retraction may lead to demographical changes in effective population size causing loss of genetic variation, which in turn, may modify gene interactions leading to a reduction in individual fitness and population evolutionary potential, and thus changing species response to environmental conditions [43]. Thus, a more detailed analysis of the spatial shifting and location of climatically stable areas through time are necessary for devise valuable planning for long-term conservation [44-46].
Here we used the framework developed by Terribile et al. [47] to identify climatically stable areas of SDFs through time and assessed the effectiveness of the current reserves networks in representing these climatically stable
 (a)
(a)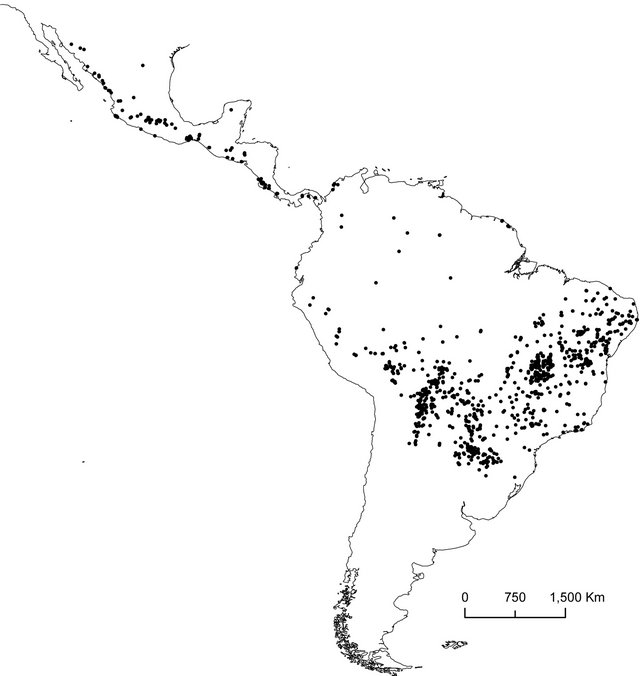 (b)
(b)
Figure 1. (a) Distribution of seasonally dry forest (SDF) (dark grey areas) in South America (Collevatti et al., 2013). Orange areas represent disjunct areas of deciduous and semideciduous forest in Brazil (mapped from IBGE, 2011). CA: Caatinga nucleus; MI: Misiones nucleus; CH: Chiquitano Dry Forest nucleus; PI: Piedmont nucleus; BP: Bolivian and Peruvian interAndean valleys; PE: Pacific coastal Ecuador; CI: Colombian inter-Andean valleys; CC: Caribbean coast of Colombia and Venezuela. Light grey area represents the Brazilian Cerrado; (b) Occurrence records used to generate distributions models for the 16 plant species in seasonally dry forests of South America. See Supporting Information Table S1 for the number of records for each species.
areas. To achieve this, we used an ensemble hindcasting/ forecasting approach for 16 SDF species to evaluate the climatically stable areas, i.e. climatically suitable to the species survival during past, present, and future climate scenarios. We then performed a gap analysis computing how many current Brazilian reserves matched both stable areas and future geographical ranges for each species. We found that the current Brazilian reserves will be suitable for many SDF’s species (90%) at the same time, but climatically stable for only one half.
2. Material and Methods
2.1. Species Analyzed
We selected 16 plant species from different families based on Collevatti et al. [28]: Tabebuia roseoalba, Tabebuia impetiginosa, Sterculia striata, Ruprechtia laxiflora, Pterogyne nitens, Myracroduon urundeuva, Mimosa hexandra, Magonia pubescens, Enterolobium contortisiliquum, Commiphora leptophloeos, Celtis pubescens, Ceiba speciosa, Balfourodendron riedelianum, Aspidosperma pyrifolium, Anadenanthera colubrina, and Amburana cearenses (see Supporting Information, Table S1 for more details). Some of them are widely distributed in SDFs and other Biomes (such as Amazonia) whereas others are restricted to SDFs, but all of them have a relatively high number of occurrences in an online herbarium database (Supporting Information, Table S1). Families were assigned according to the APG III [48], and valid species names were checked in the Lista de Espécies da Flora do Brasil [49]. Occurrence records across the Neotropical region (Figure 1(b)) were obtained from the Lista de Espécies da Flora do Brasil [49], Florescer (Flora Integrada da Região Centro-oeste; http://www. florescer.unb.br/), and GBIF (Global Biodiversity Information Facility; http://www.gbif.org/). All records were examined for probable errors and duplicates, and the nomenclature of species was checked for synonymies [50].
2.2. Climate Layers
The environmental space needed for ENMs was characterized by five bioclimatic variables: annual mean temperature, temperature annual range, precipitation of wettest month, precipitation of driest month, and precipitation of warmest quarter [47] and the Supplementary Material for details of collinearity among variables and selection of variables). These variables were calculated for pre-industrial (representing current climate conditions), Last Glacial Maximum (LGM, 21,000 years ago-21 ky BP) and future (2080-2100, 20-year mean; hereafter “end-of-century”-EOC), derived from four coupled Atmosphere-Ocean General Circulation Models (AOGCM): CCSM4, GISS-E2-R, MIROC-ESM and MRI-CGCM3 (Supporting Information, Table S2). The four AOGCMs were chosen because the available data have compatible projections for past, current and future climate. Due to the relatively coarse resolution of native AOGCMs outputs, we downscaled the climatic layers to a grid of 0.5˚ spatial resolution covering the entire Neotropics using a standard change-factor approach [51]. Details about AOGCMs, downscaling and variable selection are provided in Terribile et al. [47].
2.3. Ecological Niche Modelling (ENMs)
The ecological niche for each 16 species was first modeled for pre-industrial climatic scenario following the ensemble approach [52] and then projected onto LGM and EOC, thus generating the potential distribution in those time periods. For this, we used 13 algorithms including methods for presence-only and presence-absence data: BIOCLIM, Ecological Niche Factor Analysis (ENFA), Euclidian Distance (ED), Gower Distances (GD), Mahalanobis Distances (MD), Genetic Algorithm for Rule Set Production (GARP), Generalized Linear Models, Maximum Entropy (Maxent), Generalized additive models (GAM), Flexible Discriminant Analysis (FDA), Multivariate adaptive regression splines (MARS), Neural Networks (ANN) and Random Forest (RNDFOR) [53] (see Supporting Information Table S3). These ENM methods are integrated in the computational platform bioemsembles, which implements some methods as BIOCLIM and distance-based ENMs, and also includes source code translated from different sources (e.g. GARP from OpenModeller; http://openmodeller.sourceforge. net/), integration with external software (e.g. MAXENT uses the original software), or methods implemented in R (e.g. FDA, ANN).
Because species absence data are not available, we randomly selected pseudo-absences through the empty Neotropical grid cells, keeping prevalence equal to 0.25 [54], to fit the ENM algorithms based on presence-absence observations (i.e. for those that require this type of data). The models were evaluated based on both true skill statistics (TSS, [55]) and area under the receiver operating characteristic curve (AUC). AUC and TSS values for all models are provided in Supporting Information Table S4, and show relatively good fit for all models and species. The procedures for ENM using the ensemble approach in bioensembles have been discussed extensively elsewhere [52]. For each algorithm, models were built using a calibration subset of 75% of the presence cells selected at random and then evaluated with the remaining 25%, repeating this procedure 50 times. The 50 models were then used to generate occurrence maps based on thresholds established by the ROC curve. Finally, species’ frequencies of occurrence in each Neotropic grid cell at each period were obtained based on the 50 occurrence maps. Models with poor performance were eliminated from these frequency ensembles based on True Skill Statistics (TSS) (i.e., models with TSS < 0.5 were eliminated) [52].
This procedure resulted in 832 (16 species × 4 AOGCMs × 13 ENM methods) frequency maps for each time period. To disentangle and map the uncertainties in hindcast/forecast ensembles, we followed the protocol established in Diniz-Filho et al. [52] and improved by Terribile et al. [47]: an ANOVA was performed for each grid cell using frequency of occurrence as response and nesting methodological components within species and time components in different levels. The methodological uncertainties were obtained using a factorial ANOVA design (ENM, AOGCM, and their interaction) nested within species that are also nested within time periods. Thus, the predictive maps combining ENMs and AOGCMs represented replicates within species and time and expressed the uncertainty about species geographical ranges in each time period. Similarly, the variance across species maps expressed the uncertainty in their distributional ranges within a given time.
2.4. Long-Term Stability and Gap Analysis
To establish areas of long-term climatic stability (i.e. suitable areas for SDF species throughout time) we converted the consensus maps (i.e., frequency of occurrence of each species from the ensemble of ENMs and AOGCMs) in occurrence maps using a frequency threshold of 0.5. A cell was then considered climatically stable if a given species was predicted to occur in that cell during the three time periods (i.e., present, LGM and EOC). Therefore, the proportion of species in each grid cell that are present in the three periods expresses its relative stability for SDFs [47].
Finally, we assessed the effectiveness of Brazilian Protected areas for conservation of SDF species. We computed the proportion of the total suitability of each species that is represented by current Brazilian protected areas, obtained from the The World Database on Protected Areas (available at: http://www.protectedplanet. net/search) match both stable areas and future geographical ranges for each species. We considered all categories of protected areas, including particular ones and indigenous lands.
3. Results
The modeled distribution of Brazilian SDFs in presentday matched the boundaries of the Cerrado Biome in Central Brazil (including the Paranã river Basin), the dry forests along the Paraguay-Paraná system rivers (the “Misiones Nucleus”) and partially the Caatinga biome, indicating that the set of species used to model SDFs is representative of this phytogeographical unit (Figure 2). The occurrence of SDFs in the LGM (Figure 2(a)) was similar to the actual pattern (Figure 2(b)), with areas of high suitability southwestward of Brazil, but with a slight retraction on the Northeastern, Eastern and Southeastern edges, and expansion toward the Amazonian Basin. During EOC (Figure 2(c)), however, SDFs are expected to undergo important changes and reduction in area, with displacement southeastward and loss of suitability in the Caatinga and in large areas of Cerrado biome in the Central Brazil.
Common climatically stable areas taking into account
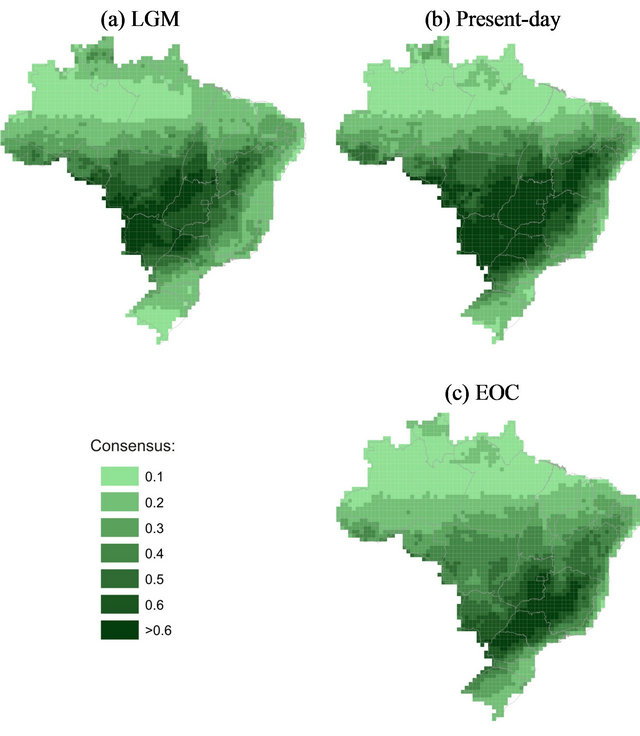
Figure 2. Consensus maps across the 832 models (13 ENMs × 4 AOGCMs × 16 Species) showing the potential distribution of seasonally dry forests in Brazil through time. (a) Last glacial maximum (LGM); (b) Present-day (current climatic conditions); (c) 20-year mean (2080-2100), “end-ofcentury”—EOC. The bar scale shows the climatic suitability.
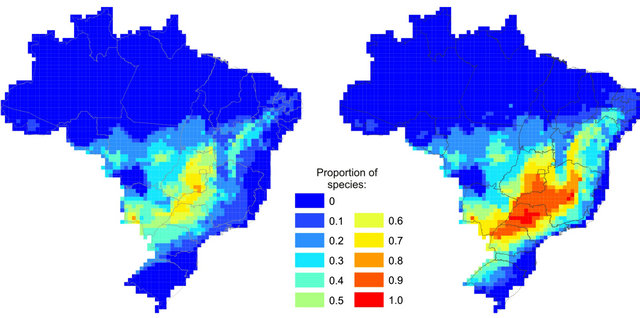
the three time periods (i.e., refugia areas of SDFs) are located in the Central Brazil, matching the core area of Cerrado biome and the Misiones Nucleus (Figure 3(a)). These areas are slightly different from areas of high suitability for all species during EOC alone (Figure 3(b)). The latter are wider, displaced southeastward, and contain a higher proportion of species than stable areas.
The Brazilian reserves overlap, in average, only about 10 to 50% of the climatically stable areas of each species, and most species are predicted to lose protected areas in the future (Figure 4). Taking into account the suitable areas only in the future scenario, some Brazilian reserves are predicted to be suitable for more than 90% of SDF’ species at the same time. However, this representation decreases to 60% of species considering the climatically stable areas (Figure 5; see also Supporting Information Figure S1).
4. Discussion
Our findings show large effects of climate changes on geographical ranges and shift of SDF' species. Although the future geographical range and stable areas for all analyzed species match at least with one reserve, most species will be lost from protected areas in the future.
 (a) (b)
Figure 3. Proportion of species for which each grid cell is (a) Climatically stable throughout time (refugia) or (b) Suitable in the future alone.

Figure 4. Proportion of current (Pres) and future (EOC) geographical range and stable areas (Ref: refugia) of each species overlapping with the current network of Brazilian reserves. Note that most species will lose protected range until end of the XXI century and stable areas will be poorly represented in reserves.
 (a) (b)
Figure 5. Proportion of species for which the Brazilian reserves are (a) Climatically stable through time; and (b) Climatically suitable in the future (EOC) alone.
Because niche conservatism and rapid climate change rates, the species often track suitable habitats during short time rather than evolve and adapt to new environmental conditions (see the “Habitat Tracking” hypothesis [24,56,57]). This assumes, of course, unlimited dispersal ability, which is still a missing important component in ENM analyses of species responses to climate changes. Consequently, the geographical range shift can potentially drive species outside the reserves [25,26]. Our results show that this may happen in Brazilian SDF species. Thus, global warming undoubtedly challenge the conservation planning and management actions to preserve SDF species on long-term in Brazilian territory, considering the current reserves network under future climate scenarios.
However, our findings also show that vegetation community from SDFs may persist in current Brazilian reserves until EOC. More than 90% species are predicted to occur in at least one unique reserve in the future, whilst their climatically stable areas are poorly represented. Stable areas throughout time, like proposed by Terribile et al. [47] and mapped here, are of interest for conservation because species do not need to disperse to track suitable habitats [45]. At the contrary, if suitable areas shift spatially through time as response to climate changes, the species necessarily either disperse to maintain viable populations or become highly prone to extinction because of demographic and genetic stochasticity [58]. Despite the high rate of plant migration reported for past climate changes [59,60], it is possible that the species will be unable to track the current climate change due to the fast changing and the high habitat fragmentation [61,62]. Thus an extinction scenario seems to be more likely for SDFs. A low number of SDF’ species would survive into the Brazilian reserves in the absence of dispersal because a small amount of their stable areas overlap with already existent reserves network.
It is important to highlight that we identified the areas most suitable for SDF species, based solely on climate. However, habitat destruction promoted by agriculture is the main current threat to biodiversity in general and to SDF in particular. The most suitable areas for SDFs in the future, in the Southeastern Brazil, are in the most disturbed Brazilian regions at the current time, with highly fragmented and degraded habitats due to human occupation. This may hold back population migration and persistence, especially with the land use changes forecasted to happen until the end of the century [3]. Moreover, studies on genetic diversity of Cerrado tree species have been showing an important effect of human footprint and climate changes in reducing the genetic variability on populations from the Southeastern Brazil [63-65].
Thus, given the limited ability of some species for natural dispersal, and disconnected habitats due to fragmentation, it would be necessary to conserve “in situ” these local populations in the southeastern region of Brazil. Otherwise, a cost effective environmental restoration program should be carried out urgently to guarantee effective species dispersal, tracking future suitable habitats. Further, assisted migration, although more expensive, may also be a good strategy for recovering these natural local populations that are now threatened by human disturbance.
In conclusion, our results show thus that the major challenges to maintain SDFs on long-term, and improve the efficiency of current network of Brazilian reserves are mainly linked to future dispersal conditions and species accessibility to suitable protected areas.
5. Acknowledgements
Our research program integrating Macroecology and Molecular Ecology has been continuously supported by grants to the research network GENPAC (Geographical Genetics and Regional Planning for natural resources in Brazilian Cerrado) supported by CNPq/MCT/FAPEG (projects no. 564717/2010-0, 563727/2010-1 and 563624/ 2010-8), which we gratefully acknowledge. We thank Thiago F. Rangel for providing access to computational platform BIOENSEMBLES, which was essential to our analyses encompassing the ecological niche modeling. We also acknowledge the World Climate Research Programmer’s Working Group on Coupled Modeling, which is responsible for CMIP5, and we thank the climate modeling groups (listed in Supporting Information Table S2 of this paper) for producing and making available their model outputs.
REFERENCES
- R. A. Mittermeier, G. P. Robles and C. G. Mittermeier, “Megadiversity: Earth’s Biologically Wealthiest Nations,” Conservation International e Agrupación Sierra Madre Cidade do México, 1997.
- A. M. Giulietti, R. M. Harley, L. P. de Queiroz, M. G. L. Wanderley and C. van den Berg, “Biodiversity and Conservation of Plants in Brazil,” Conservation Biology, Vol. 19, No. 3, 2005, pp. 632-639. doi:10.1111/j.1523-1739.2005.00704.x
- R. Dobrovolski, R. D. Loyola, P. de Marco Jr. and J. A. F. Diniz-Filho, “Agricultural Expansion Can Menace Brazilian Protected Areas during the 21st Century,” Natureza & Conservação, Vol. 9, No. 2, 2011, pp. 208-213. doi:10.4322/natcon.2011.027
- Ministério do Meio Ambiente—Sistema Nacional de Unidades de Conservação, Brasília, 2000. http://www.mma.gov.br/port/sbf/dap/doc/snuc.pdf
- Ministério do Meio Ambiente, “Biodiversidade Brasileira: Avaliação e Identificação de Áreas e Ações Prioritárias Para Conservação, Utilização Sustentável e Repartição de Benefícios da Biodiversidade Brasileira, Secretaria de Biodiversidade e Florestas,” Brasília, 2002.
- D. E. Prado, “Seasonally Dry Forests of Tropical South America: From Forgotten Ecosystems to a New Phytogeographic Unit,” Edinburgh Journal of Botany, Vol. 57, No. 3, 2000, pp. 437-461.
- G. A. Sanchez-Azofeifa, M. Kalacska, M. Quesada, J. C. Calvo-Alvarado, J. M. Nassar and J. P. Rodríguez, “Need for Integrated Research for a Sustainable Future in Tropical Dry Forests,” Conservation Biology, Vol. 19, No. 2, 2005, pp. 285-286. doi:10.1111/j.1523-1739.2005.s01_1.x
- M. M. Espírito-Santo, A. C. Sevilha, F. C. Anaya, R. Barbosa, G. W. Fernandes, G. A. Sanchez-Azofeifa, A. Scariot, S. E. Noronha and C. A. Sampaio, “Sustainability of Tropical Dry Forests: Two Case Studies in Southeastern and Central Brazil,” Forest Ecology and Management, Vol. 258, No. 6, 2009, pp. 922-930. doi:10.1016/j.foreco.2009.01.022
- P. G. Murphy and A. E. Lugo, “Dry Forests of Central America and the Caribbean,” In: S. H. Bullock, H. A. Mooney and E. Medina, Eds., Seasonally Dry Tropical Forests, Cambridge University Press, Cambridge, 1995, pp. 9-34. doi:10.1017/CBO9780511753398.002
- P. G. Murphy and A. E. Lugo, “Ecology of Tropical Dry Forest,” Annual Review of Ecology and Systematics, Vol. 17, 1986, pp. 67-88. doi:10.1146/annurev.es.17.110186.000435
- R. A. Linares-Palomino, A. T. Oliveira-Filho and R. T. Pennington, “Neotropical Seasonally Dry Forests: Diversity, Endemism and Biogeography of Woody Plants,” In: R. Dirzo, H. S. Young, H. A. Mooney and G. Ceballos, Eds., Seasonally Dry Tropical Forests: Ecology and Conservation, Island Press, Washington DC, 2011, pp. 3-21. doi:10.5822/978-1-61091-021-7_1
- L. M. Daniel and A. Scariot, “Principles of Natural Regeneration of Tropical Dry Forests for Restoration,” Restoration Ecology, Vol. 14, No. 1, 2006, pp. 11-20. doi:10.1111/j.1526-100X.2006.00100.x
- H. A. Mooney, S. H. Bullock and E. Medina, “Seasonally Dry Tropical Forests,” Cambridge University Press, Cambridge, 1995, pp. 1-8. doi:10.1017/CBO9780511753398.001
- L. Miles, A. C. Newton, R. S. De Fries, C. Ravilious, I. May, S. Blyth, V. Kapos and J. E. Gordon, “A Global Overview of the Conservation Status of Tropical Dry Forests,” Journal of Biogeography, Vol. 33, No. 3, 2006, pp. 491-505. doi:10.1111/j.1365-2699.2005.01424.x
- D. E. Prado and P. E. Gibbs, “Patterns of Species Distributions in the Dry Seasonal Forests of South America,” Annals of the Missouri Botanical Garden, Vol. 80, No. 4, 1993, pp. 902-927. doi:10.2307/2399937
- R. T. Pennington, G. P. Lewis and J. A. Ratter, “An Overview of the Plant Diversity, Biogeography and Conservation of Neotropical Savannas and Seasonally Dry Forests,” In: R. T. Pennington, G. P. Lewis and J. A. Ratter, Eds., Neotropical Savannas and Seasonally Dry Forests: Plant Diversity, Biogeography, and Conservation, CRC Press, London, 2006, pp. 193-211. doi:10.1201/9781420004496.ch1
- A. T. Oliveira-Filho and J. A. Ratter, “Vegetation Physionomies and Woody Flora of the Cerrado Biome,” In: P. S. Oliveira and R. J. Marquis, Eds., The Cerrados of Brazil: Ecology and Natural History of a Neotropical Savanna, Columbia University Press, New York, 2002, pp. 91-120.
- P. A. Furley and J. A. Ratter, “Soil Resources and Plant Communities of the Central Brazilian Cerrado and Their Development,” Journal of Biogeography, Vol. 15, No. 1, 1988, pp. 97-108. doi:10.2307/2845050
- C. A. Klink and R. B. Machado, “Conservation of the Brazilian Cerrado,” Conservation Biology, Vol. 19, No. 3, 2005, pp. 707-713. doi:10.1111/j.1523-1739.2005.00702.x
- C. A. Bianchi and S. M. Haig, “Deforestation Trends of Tropical Dry Forests in Central Brazil,” Biotropica, 2012. doi:10.1111/btp.12010
- B. de la Barreda-Bautista, A. A. López-Caloca1, S. Couturier and J. L. Silván-Cárdenas, “Tropical Dry Forests in the Global Picture: The Challenge of Remote SensingBased Change Detection in Tropical Dry Environments, Planet Earth 2011—Global Warming Challenges and Opportunities for Policy and Practice,” In: E. Carayannis, Ed., InTech, 2011, pp. 231-257. http://www.intechopen.com/books/planet-earth-2011-global-warming-challenges-andopportunities-for-policy-and-practice/tropical-dry-forests-in-the-global-picture-the-challenge-of-remotesensing-based-change-detection-in
- F. P. Werneck, G. C. Costa, G. R. Colli, D. E. Prado and J. W. Sites, “Revisiting the Historical Distribution of Seasonally Dry Tropical Forests: New Insights Based on Palaeodistribution Modelling and Palynological Evidence,” Global Ecology and Biogeography, Vol. 20, No. 2, 2011, pp. 272-288. doi:10.1111/j.1466-8238.2010.00596.x
- A. T. Peterson, J. Soberon and V. Sanchez-Cordero, “Conservatism of Ecological Niches in Evolutionary Time,” Science, Vol. 285, No. 5431, 1999, pp. 1265-1267. doi:10.1126/science.285.5431.1265
- C. Parmesan and G. Yohe, “A Globally Coherent Fingerprint of Climate Change Impacts across Natural Systems,” Nature, Vol. 421, 2003, pp. 37-42. doi:10.1038/nature01286
- L. Hannah, G. Midgley, S. Andelman, M. Araújo, G. Hughes, E. Martinez-Meyer, R. Pearson and P. Williams, “Protected Area Needs in a Changing Climate,” Frontiers in Ecology and the Environment, Vol. 5, No. 3, 2007, pp. 131-138. doi:10.1890/1540-9295(2007)5[131:PANIAC]2.0.CO;2
- M. B. Araújo, M. Cabeza, W. Thuiller, L. Hannah and P. H. Williams, “Would Climate Change Drive Species out of Reserves? An Assessment of Existing Reserve-Selection Methods,” Global Change Biology, Vol. 10, No. 9, 2004, pp. 1618-1626. doi:10.1111/j.1365-2486.2004.00828.x
- R. G. Collevatti, L. V. Terribile, M. S. Lima-Ribeiro, J. C. Nabout, G. Oliveira, T. F. Rangel, S. G. Rabelo and J. A. F. Diniz-Filho, “A Coupled Phylogeographic and Species Distribution Modeling Approach Recovers the Demographic History of a Neotropical Seasonally Dry Forest Tree Species,” Molecular Ecology, Vol. 21, No. 23, 2012, pp. 5845-5863. doi:10.1111/mec.12071
- R. G. Collevatti, L. V. Terribile, M. S. Lima-Ribeiro, J. C. Nabout, G. Oliveira, T. F. Rangel and J. A. F. Diniz-Filho, “Drawbacks to Palaeodistribution Modelling: The Case of South American Seasonally Dry Forests,” Journal of Biogeography, Vol. 40, No. 2, 2013, pp. 345-358. doi:10.1111/jbi.12005
- F. E. Mayle, “Assessment of the Neotropical Dry Forest Refugia Hypothesis in the Light of Palaeoecological Data and Vegetation Model Simulations,” Journal of Quaternary Science, Vol. 19, No. 7, 2004, pp. 713-720. doi:10.1002/jqs.887
- R. T. Pennington, D. E. Prado and C. A. Pendry, “Neotropical Seasonally Dry Forests and Quaternary Vegetation Changes,” Journal of Biogeography, Vol. 27, No. 2, 2000, pp. 261-273. doi:10.1046/j.1365-2699.2000.00397.x
- J. R. Stewart, et al., “Refugia Revisited: Individualistic Responses of Species in Space and Time,” Proceedings of the Royal Society B, Vol. 277, No. 1682, 2010, pp. 661- 671. doi:10.1098/rspb.2009.1272
- A. S. L. Rodrigues, S. J. Andelman, M. I. Bakar, L. Boitani, T. M. Brooks, et al., “Effectiveness of the Global Protected Area Network in Representing Species Diversity,” Nature, Vol. 428, 2004, pp. 640-643. doi:10.1038/nature02422
- C. Parmesan, “Ecological and Evolutionary Responses to Recent Climate Change,” Annual Review of Ecology, Evolution and Systematics, Vol. 37, 2006, pp. 637-669. doi:10.1146/annurev.ecolsys.37.091305.110100
- J. C. Svenning, C. Fløjgaard, K. A. Marske and D. Nó- gues-Bravo, “Applications of Species Distribution Modeling to Paleobiology,” Quaternary Science Reviews, Vol. 30, No. 21-22, 2011, pp. 21-22. doi:10.1016/j.quascirev.2011.06.012
- A. T. Peterson and J. Soberon, “Species Distribution Modeling and Ecological Niche Modeling: Getting the Concepts Right,” Natureza & Conservação, Vol. 10, No. 2, 2012, pp. 102-107. doi:10.4322/natcon.2012.019
- F. P. Werneck, C. Nogueira, G. R. Colli, J. W. Sites and G. C. Costa, “Climatic Stability in the Brazilian Cerrado: Implications for Biogeographical Connections of South American Savannas, Species Richness and Conservation in a Biodiversity Hotspot,” Journal of Biogeography, Vol. 39, No. 9, 2012, pp. 1695-1706. doi:10.1111/j.1365-2699.2012.02715.x
- F. I. Woodward, M. R. Lomas and C. K. Kelly, “Global Climate and the Distribution of Plant Biomes,” Philosophical Transactions of the Royal Society B: Biological Sciences, Vol. 359, No. 1450, 2004, pp. 1465-1476. doi:10.1098/rstb.2004.1525
- J. W. Williams and S. T. Jackson, “Novel Climates, NoAnalog Communities, and Ecological Surprises,” Frontiers in Ecology and the Environment, Vol. 5, No. 9, 2007, pp. 475-482. doi:10.1890/070037
- R. G. Collevatti, M. S. Lima-Ribeiro, A. C. Souza-Neto, A. A. Franco and L. V. Terribile, “Recovering the Demographical History of a Brazilian Cerrado Tree Species Caryocar brasiliense: Coupling Ecological Niche Modeling and Coalescent Analyses,” Natureza & Conservação, Vol. 10, No. 2, 2012, pp. 169-176. doi:10.4322/natcon.2012.024
- R. G. Collevatti, M. P. C. Telles, J. C. Nabout, L. J. Chaves and T. N. Soares, “Demographical History and the Low Genetic Diversity in Dipteryx Alata (Fabaceae) from Brazilian Neotropical Savannas,” Heredity, 2013, in Press.
- L. Excoffier, M. Foll and R. J. Petit, “Genetic Consequences of Range Expansions,” Annual Review of Ecolology, Evolution and Systematics, Vol. 40, 2009, pp. 481-501. doi:10.1146/annurev.ecolsys.39.110707.173414
- L. Berec, E. Angulo and F. Courchamp, “Multiple Allee Effects and Population Management,” Trends in Ecology and Evolution, Vol. 22, No. 4, 2006, pp. 185-191. doi:10.1016/j.tree.2006.12.002
- G. M. Hewitt, “The Genetic Legacy of the Quaternary Ice Ages,” Nature, Vol. 405, 2000, pp. 907-913. doi:10.1038/35016000
- M. B. Ashcroft, “Identifying Refugia from Climate Change,” Journal of Biogeography, Vol. 37, No. 8, 2010, pp. 1407-1413.
- C. Carroll, J. R. Dunk and A. Moilanen, “Optimizing Resiliency of Reserve Networks to Climate Change: Multispecies Conservation Planning in the Pacific Northwest, USA,” Global Change Biology, Vol. 16, No. 3, 2010, pp. 891-904. doi:10.1111/j.1365-2486.2009.01965.x
- C. H. Graham, J. van der Wal, S. J. Phillips, C. Moritz and S. E. Williamse, “Dynamic Refugia and Species Persistence: Tracking Spatial Shifts in Habitat through Time,” Ecography, Vol. 33, No. 6, 2010, pp. 1062-1069. doi:10.1111/j.1600-0587.2010.06430.x
- L. C. Terribile, M. S. Lima-Ribeiro, M. B. Araújo, N. Bizão, R. G. Collevatti, R. Dobrovolski, A. A. Franco, F. Guilhaumon, J. S. Lima, D. M. Murakami, et al., “Areas of Climate Stability in the Brazilian Cerrado: Disentangling Uncertainties through Time,” Natureza & Conservação, Vol. 10, No. 2, 2012, pp. 152-159. doi:10.4322/natcon.2012.025
- Angiosperm Phylogeny Group, “An Update of the Angiosperm Phylogeny Group Classification for the Orders and Families of Flowering Plants: APG III,” Botanical Journal of the Linnean Society, Vol. 161, No. 2, 2009, pp. 105-121. doi:10.1111/j.1095-8339.2009.00996.x
- Jabot-Banco de Dados da Flora, “Brasileira,” Instituto de Pesquisas Jardim Botânico do Rio de Janeiro, 2011. http://www.jbrj.gov.br
- R. Giovanni, L. C. Bernacci, M. F. Siqueira and F. S. Rocha, “The Real Task of Selecting Records for Ecological Niche Modeling,” Natureza & Conservação, Vol. 10, No. 2, 2012, pp. 139-144. doi:10.4322/natcon.2012.018
- R. L. Wilby, S. P. Charles, E. Zorita, B. Timbal, P. Whetton and L. O. Mearns, “Guidelines for Use of Climate Scenarios Developed from Statistical Downscaling Methods,” IPCC Task Group on Data and Scenario Support for Impact and Climate Analysis, 2004. http://www.ipcc-data.org/guidelines/dgm_no2_v1_09_2004.pdf
- J. A. F. Diniz-Filho, L. M. Bini, T. F. Rangel, R. D. Loyola, C. Hof, D. Nogués-Bravo and M. B. Araújo, “Partitioning and Mapping Uncertainties in Ensembles of Forecasts of Species Turnover under Climate Change,” Ecography, Vol. 32, No. 6, 2009, pp. 897-906. doi:10.1111/j.1600-0587.2009.06196.x
- J. Franklin, “Mapping Species Distribution: Spatial Inference and Prediction,” Cambridge University Press, Cambridge, 2009.
- T. Santika, “Assessing the Effect of Prevalence on the Predictive Performance of Species Distribution Models Using Simulated Data,” Global Ecology and Biogeography, Vol. 20, No. 1, 2011, pp. 181-192. doi:10.1111/j.1466-8238.2010.00581.x
- O. Allouche, A. Tsoar and R. Kadmon, “Assessing the Accuracy of Species Distribution Models: Prevalence, Kappa and the True Skill Statistic (TSS),” Journal of Applied Ecology, Vol. 43, No. 6, pp. 1223-1232. doi:10.1111/j.1365-2664.2006.01214.x
- N. Eldredge, “Macroevolutionary Dynamics: Species, Niches and Adaptive Peaks,” McGraw-Hill, New York, 1989.
- N. Eldredge, J. N. Thompson, P. M. Brakefield, S. Gavrilets, D. Jablonski, J. B. C. Jackson, R. E. Lenski, B. S. Lieberman, M. A. McPeek and W. Miller III, “The Dynamics of Evolutionary Stasis,” Paleobiology, Vol. 31, No. 5, 2005, pp. 133-145. doi:10.1666/0094-8373(2005)031[0133:TDOES]2.0.CO;2
- A. M. Lister, “The Impact of Quaternary Ice Ages on Mammalian Evolution,” Philosophical Transactions of the Royal Society B, Vol. 359, No. 1442, 2004, pp. 221- 241. doi:10.1098/rstb.2003.1436
- J. S. Clark, C. Fastie, G. Hurtt, S. T. Jackson, C. Johnson, G. A. King, M. Lewis, S. Pacala, C. Prentice, E. W. Schupp, T. Webb and P. Wyckoff, “Reid’s Paradox of Rapid Plant Migration,” BioScience, Vol. 48, No. 1, 1998, pp. 13-24. doi:10.2307/1313224
- [61] P. A. Colinvaux, P. E. Oliveira and M. B. Bush, “Amazonian and Neotropical Plant Communities on Glacial Time-Scales: The Failure of the Aridity and Refuge Hypotheses,” Quaternary Science Review, Vol. 19, No. 1-5, 2000, pp. 141-169. doi:10.1016/S0277-3791(99)00059-1
- [62] A. S. Jump and J. Peñuelas, “Running to Stand Still: Adaptation and the Response of Plants to Rapid Climate Change,” Ecology Letters, Vol. 8, No. 9, 2005, pp. 1010- 1020. doi:10.1111/j.1461-0248.2005.00796.x
- [63] A. A. Hoffmann and Y. Willi, “Detecting Genetic Responses to Environmental Change,” Nature, Vol. 9, 2008, pp. 421-432.
- [64] J. A. F. Diniz-Filho, J. C. Nabout, L. M. Bini, T. N. Soares, M. P. C. Telles, P. DeMarco and R. G. Collevatti, “Niche Modeling and Landscape Genetics of Caryocar brasiliense (“Pequi” Tree: Caryocariaceae) in Brazilian Cerrado: An Integrative Approach for Evaluating Central-Peripheral Population Patterns,” Tree Genetics and Genomes, Vol. 5, No. 4, 2009, pp. 617-627. doi:10.1007/s11295-009-0214-0
- [65] R. G. Collevatti, J. C. Nabout and J. A. F. Diniz-Filho, “Range Shift and Loss of Genetic Diversity under Climate Change in Caryocar brasiliense, A Neotropical Tree Species,” Tree Genetics and Genomes, Vol. 7, No. 6, 2011, pp. 1237-1247. doi:10.1007/s11295-011-0409-z
- [66] J. A. F. Diniz-Filho, R. G. Collevatti, L. J. Chaves, T. N. Soares, J. C. Nabout, T. F. Rangel, D. B. Melo, J. S. Lima and M. P. C. Telles, “Geographic Shifts in Climatically Suitable Areas and Loss of Genetic Variability in Dipteryx alata (“Baru” Tree; Fabaceae),” Genetics and Molecular Research, Vol. 11, No. 2, 2012, pp. 1618-1626. doi:10.4238/2012.June.15.11
Supporting Information
Additional Supporting Information may be found in the online version of this article:
Table S1. Characteristics of the species used in this study, including their geographical distribution. N: number of occurrences used in ecological niche modeling.
| Species | Family | Current distribution | N |
| Tabebuia roseoalba (Ridl.) Sandwith | Bignoniaceae | CA, CH, PI, CW, AM | 33 |
| Tabebuia impetiginosa (Mart. ex DC.) Standl. | Bignoniaceae | CA, CH, MI, PI, BP, PE, CI, CC, CW, AM, MA | 158 |
| Sterculia striata A.St.-Hil. & Naudin | Malvaceae | CA, MI, CW, AM | 68 |
| Ruprechtia laxiflora Meisn. | Polygonaceae | CA, MI, PI | 45 |
| Pterogyne nitens Tul. | Fabaceae | CA, CH, MI, PI, CW, AM | 82 |
| Myracroduon urundeuva Allemão | Anarcadiaceae | CA, PI, MI, CW | 117 |
| Mimosa hexandra Micheli | Fabaceae | CA, MI, CW | 22 |
| Magonia pubescens A.St.-Hil. | Sapindaceae | CA, MI, CW | 96 |
| Enterolobium contortisiliquum (Vell.) Morong | Fabaceae | CA, CH, MI, PI, CW | 82 |
| Commiphora leptophloeos (Mart.) J.B.Gillett | Burseraceae | CA, PI, BP, PE, CI, CC, CW, AM | 51 |
| Celtis pubescens (Kunth) Spreng. | Cannabaceae | CA, MI, CH, PI, BP, PE, CI, CC, CW, AM | 68 |
| Ceiba speciosa (A.St.-Hil.) Ravenna | Malvaceae | CA, MI, CH, PI, BP, PE, CI, CC, CW, AM | 43 |
| Balfourodendron riedelianum (Engl.) Engl. | Rutaceae | CA, MI | 21 |
| Aspidosperma pyrifolium Mart. | Apocynaceae | CA, MI, CW | 65 |
| Anadenanthera colubrina(Vell.) Brenan | Fabaceae | CA, CH, MI, PI, BP, PE, CI, CC, CW | 25 |
| Amburana cearenses (Allemão) A.C.Sm. | Fabaceae | CA, MI, PI, CW, AM | 68 |
Table S2. Details of the four climate models (AOGCMs) used in the ecological niche modeling.
| Model ID | Modeling Center | Resolution* | Source | Year |
| CCSM4 | University of Miami-RSMAS, USA | 0.9˚ × 1.25˚ | CMIP5/PMIP3 | 2012 |
| GISS-E2-R | NASA Goddard Institute for Space Studies, USA | 2.5˚ × 2.0˚ | CMIP5/PMIP3 | 2012 |
| MIROC-ESM | Atmosphere and Ocean Research Institute (University of Tokyo), National Institute for Environmental Studies, and Japan Agency for Marine-Earth Science and Technology, Japan | 2.8˚ × 2.8˚ | CMIP5/PMIP3 | 2012 |
| MRI-CGCM3 | Meteorological Research Institute, Japan | 1.1˚ × 1.1˚ | CMIP5/PMIP3 | 2012 |
*Longitude × latitude; CMIP5-Coupled Model Intercomparison Project, Phase 5 (http://cmip-pcmdi.llnl.gov/); PMIP3-Paleoclimate Modelling Intercomparison Project, Phase 3 (http://pmip3.lsce.ipsl.fr/).
Table S3. Ecological niche model methods used to model species distribution.
| Method | Species data type |
| Bioclimatic Envelope (BIOCLIM) | Presence only |
| Ecological Niche Factor Analysis (ENFA) | Presence only |
| Euclidian Distance | Presence only |
| Genetic Algorithm for Rule Set Production (GARP) | Presence/pseudo-absence |
| Generalized Linear Models (GLM) | Presence and absence |
| Gower Distance | Presence only |
| Mahalanobis Distance | Presence only |
| Maximum Entropy (Maxent) | Presence/pseudo-absence |
| Generalized additive models (GAM) | Presence and absence |
| Flexible discriminant analysis (FDA) | Presence and absence |
| Multivariate adaptive regression splines (MARS) | Presence and absence |
| Neural Networks (ANN) | Presence and absence |
| Random Forest (RNDFOR) | Presence and absence |
Table S4. Means and standard deviations of TSS and AUC statistics for each ENM, across the four AOGCMs and 16 species.
| Method | AUC | AUC (sd) | TSS | TSS (sd) |
| BIOCLIM | 0.892 | 0.082 | 0.475 | 0.106 |
| ENFA | 0.812 | 0.070 | 0.440 | 0.117 |
| Euclidian distance | 0.829 | 0.071 | 0.465 | 0.114 |
| GARP | 0.403 | 0.651 | 0.288 | 0.098 |
| GLM | 0.833 | 0.069 | 0.484 | 0.126 |
| Gower distance | 0.851 | 0.071 | 0.527 | 0.130 |
| Mahal. distance | 0.839 | 0.069 | 0.500 | 0.128 |
| Maxent | 0.935 | 0.029 | 0.601 | 0.093 |
| GAM | 0.935 | 0.042 | 0.608 | 0.085 |
| FDA | 0.910 | 0.041 | 0.547 | 0.094 |
| MARS | 0.891 | 0.243 | 0.560 | 0.095 |
| ANN | 0.887 | 0.246 | 0.529 | 0.111 |
| RNDFOR | 1.000 | 0.000 | 0.619 | 0.075 |

(a) (b)
Figure S1. Proportion of species by Conservation Unity (a) and cumulative proportion (b), taking into account the suitable areas in the future alone (dashed line) and the suitable areas in the three time periods—past, present and future (i.e., stable areas; solid line).
NOTES
*Corresponding author.