American Journal of Plant Sciences
Vol.3 No.4(2012), Article ID:18694,18 pages DOI:10.4236/ajps.2012.34054
Comparative Effect of Ca, K, Mn and B on Post-Drought Stress Recovery in Tea [Camellia sinensis (L.) O Kuntze]
![]()
1Plant Biochemistry and Molecular Biology Laboratory, School of Life Sciences, Assam (Central) University, Silchar, India; 2Department of Botany and Biotechnology, Karimganj College, Karimganj, Assam, India; 3Microbial and Agricultural Ecology Laboratory, Department of Ecology and Environmental Sciences, Assam (Central) University, Silchar, India; 4Department of Biotechnology, Indian Institute of Technology, Guwahati, India.
Email: *hkupbl_au@rediffmail.com
Received October 26th, 2011; revised December 27th, 2011; accepted January 11th, 2012
Keywords: Drought; Post Drought Recovery (PDR); Calcium; Potassium; Boron; Manganese; Camellia sinensis (Tea)
ABSTRACT
Tea (Camellia sinensis) is one of the most important economic crops. Being perennial in nature, tea plant often experiences natural drought, which affects its growth and productivity. The present investigation was undertaken to understand the mechanism of post-drought stress recovery on rehydration and the effect of nutrients in the recovery process of the selected clones of Camellia sinensis L. (TV-1, TV-20, TV-29 & TV-30). The results demonstrated that decrease in relative water content (RWC), dry mass of leaf and antioxidants like-ascorbate and glutathione in all the tested clones, as a result of imposed water stress, which caused damage was not permanent. Increase in phenolic content with decrease in , H2O2 and lipid peroxidation was indication of the recovery of stress induced oxidative damage following the post stress rehydration. Further, the post drought recovery was enhanced by foliar spray of K, Ca, Mn & B. Differential activities of enzymes like SOD, CAT, POX, GR and PPO in response to foliar spray of nutrients in rehydrated plant improved the recovery process. The present study reveals that the tested nutrients (K, Ca, Mn & B) showed some positive response in influencing growth and antioxidative responses during post drought recovery process, where K and Ca showed comparatively better effect in improving post drought recovery potential in tea plant.
1. Introduction
Tea is the second most commonly drank liquid on earth after water. Tea plant being perennial crop, is subjected to different environmental stress, drought being one of the important among them. Drought stress is an important abiotic stress, which induces oxidative damage in tea plant and affects the antioxidant systems, altering different physiological and biochemical processes [1] leading to significant crop losses. Plants under drought stress are highly regulated by components of osmoregulative and antioxidative systems and secondary metabolite contents as reported recently [2]. Drought induces an increase in ROS production resulting in various degree of oxidative damage in different clonal varieties of tea. However, recovery of stress induced damages after post-stress rehydration in terms of regaining antioxidative properties and photosynthetic functions has been reported earlier [1]. There are many studies on the water stress effects and rehydration response [1] and enhancement of recovery by hormone treatment [3]. However, role of nutrients (micro & macro) in post-drought recovering plant is one of the important areas to be explored. Various micro and macro nutrients are essential throughout all the stages of plant development. Manganese is an essential micronutrient [4] that plays a primary role in the activation of several enzymes of the tricarboxylic acid cycle in the shikimic acid pathway and in the biosynthetic pathway of isoprenoids [5]. Manganese also plays a key role in the photosynthetic apparatus [6], namely in the water-splitting system associated with photosystem II, ATP synthesis [7], RuBP carboxylase reactions [8] and the biosynthesis of fatty acids, acyl lipids and proteins [9]. The effect of manganese nutrition on the growth and chlorophyll concentration and superoxide dismutase activity has also been reported [10]. Boron is also an essential micronutrient, deficiency of which causes accumulation of chlorogenic acid and polyamines [11]. Boron is also known to influence water use efficiency in plants during the stress conditions [12]. Boron deficiency in plants is related to the reduction in both root and shoots growth as a result of reduction in biosynthesis of cytokinins and IAA in these organs [13]. In the post stress recovering plants both shoot and root growth are potent factor for resumption of plant growth and thus the effect of boron in recovering plants was tested in the present study. In a recent study, boron induced increase in a glutathione synthesis during the stress period has been reported [14]. Adequate boron nutrition is critical not only for high yields but also for high quality of crops. Both boron and manganese are essential micro-nutrients necessary for normal physiological and biochemical processes relating to plant growth. Whether these nutrients play some stress ameliorative role in post drought recovering plants has been tested in this study.
Calcium is another important nutrient which is well established as a secondary messenger and also known to ameliorate water stress affects [15]. Calcium is known to be involved in oxidative stress signaling participating in linking H2O2 perception and induction of antioxidant genes in plants [16]. Calcium is a player in most cellular signaling processes [17] and interacts strongly with ROS [18]. Emerging evidence points to numerous ways in which calcium signatures could be influenced by redox couples [19]. Calmodulin-regulated enzymes involved in ROS metabolism and detoxification reactions include isoforms of superoxide dismutase and catalase, etc., [20]. However, information on calcium mediated ROS metabolism and detoxification in post stress recovering plants are lacking, which we tried to find in this study. Potassium is one of the major nutrients, essential for plant growth and development. Potassium is the fourth most abundant mineral, constituting about 2.5% of the lithosphere. There are also increasing evidence that improving K status of plants can greatly lower ROS production imparting beneficial effects when plants are subjected to environmental stress [21,22] Potassium is also an important mineral regulating leaf osmotic potential affecting the water use efficiency in plants. Osmotic adjustment is an essential stress acclimatizing feature of stressed plant. Osmotic regulation with coordinated ROS metabolism and detoxification mechanism might play potent role during the post stress recovery in plants, for which the present experimentations were performed. The ability of varieties to recover and resume rapid growth following drought imposition and subsequent rehydration with possible enhancement of the recovery process by manipulating nutrient status of the plant is important for crop yield. The present investigation was undertaken for understanding the mechanism of drought stress induced oxidative damage on dehydration and its recovery on rehydration and the possible role of nutrients in enhancing the recovery process in selected clones of Camellia sinensis (L.) O Kuntze.
2. Materials and Methods
2.1. Plant Materials, Growth Conditions and Stress Imposition
Four clonal varieties of Camellia sinensis (L.) O Kuntze (viz. TV-1, TV-20, TV-29 & TV-30) seedlings of uniform age, one and half year old were procured from. Tocklai Tea Research Station, Silcoori, Silchar. These clones were selected to compare the effect of nutrients on them and to find the best responsive clone. The seedlings grown in field soil in polythene bags were procured from the nursery of the near by tea garden of Durgakona (Silchar) and brought to the laboratory. The seedlings were potted after removing the polythene sleeves and adding field soil in the pots. The plants were acclimatized for 10 - 15 days under the laboratory conditions and were grown under natural light and irrigation. The mineral contents were estimated as (mg/100 g DW): K, 54.37; Na, 55; Ca, 1945; B, 29.39).
After 10 - 15 days of acclimatization, drought was imposed by withholding water for 20 days. After 20 days the plants were rehydrated. After the appearance of new foliage, they were sprayed with 50 and 100 mM concentration of KCl, CaCl2, MnCl2 and boric acid, once in a week and leaves were sampled for recovery analysis after every 10 days of treatment for 30 days. Control plants were sprayed with distilled water. As a result of dehydration, soil moisture (%) content decreased to 12.88 ± 1.34 and 3.55 ± 0.28 after 10 d and 20 days of stress imposition respectively as compared to control with 23.46 ± 1.62. However, the average soil moisture content of 23.85 ± 1.73, 25.03 ± 1.09 and 25.21 ± 1.16 was maintained in all the pots after 10 d (PDRI), 20 d (PDRII ) and 30 d (PDRIII) of rehydration. Since the main objective of this paper is the role of nutrients in post stress recovery, data for drought stress was not shown here. For simple and easy interpretation of the findings, results of drought stress were presented elsewhere but it has been conceptually summarized as in Figure 6. The average temperature range during experimental period was noted as 25.1˚C - 32.3˚C and 12.5˚C - 24.7˚C max/min, respectively. The average relative humidity during the experimentation was 88% - 96% and 38% - 67% morning/afternoon, respectively. All the leaf samplings were done during the morning hours between 8 am to 9 am. All the experiments were repeated thrice.
2.2. Analysis of Fresh and Dry Mass of Leaf and RWC
Fresh mass of leaf was measured in three replicates using five leaves and expressed as g·leaf–1. For dry mass measurement same leaves were oven dried at 80˚C for 48 h and expressed as g·leaf–1. Relative water content (RWC) was measured by following the methods of Barrs and Weatherly [23].
2.3. Determination of Metabolite and Antioxidants Concentration
The total phenolic content was extracted from the tea leaves in 80% (v/v) ethanol. Total phenolic content was estimated as per the method of Mahadevan and Sridhar [24] using Follin Ciocalteau reagent and Na2CO3. Proline concentration in tea leaves was determined following the method of Bates et al. [25]. Leaf samples (0.5 g) were homogenized with 5.0 ml of sulfosalicylic acid (3%) using mortar and pestle and filtered through Whatman No. 1 filter paper. 2.0 ml of filtrate was incubated with 2.0 ml of glacial acetic acid and 2.0 ml ninhydrin reagent and boiled in a water bath at 100˚C for 30 min. After cooling the reaction mixture, 4.0 ml of toluene was added and after cyclomixing it, absorbance was read at 570 nm. Glutathione was extracted and estimated as per the method of Griffith [26]. Leaf tissue was homogenized in 5.0% (w/v) sulfosalicylic acid and the homogenate was centrifuged at 10,000 g for 10 mins. The supernatant (1.0 ml) was neutralized with 0.5 ml of 0.5 M potassium phosphate buffer (pH 7.5). Total glutathione was measured by adding 1.0 ml neutralized to a standard solution mixture consisting of 0.5 ml of 0.1 M sodium phosphate buffer (pH 7.5) containing EDTA, 0.2 ml of 6.0 mM 5,5’-dithio-bis (2-nitrobenzoic acid), 0.1 ml of 2.0 mM NADPH and 1.0 ml of 1-U (ml)–1 yeast-GR Type III (Sigma Chemicals, USA). The change in absorbance at 412 nm was followed at 25˚C ± 2˚C until the absorbance reached 5 U. For the extraction and estimation of ascorbate, the method of Oser [27] was used. The reaction mixture consists of 2.0 ml 2% Na-molybdate, 2.0 ml 0.15 N H2SO4, 1.0 ml 1.5 mM Na2HPO4 and 1.0 ml tissue extract. The reaction mixture was incubated at 60˚C in water bath for 40 min. Cooled and centrifuged at 3000 g for 10 min and the absorbance was measured at 660 nm.
2.4. Determination of Superoxide Anion ( ), H2O2 Concentration and Lipid Peroxidation
H2O2 was extracted in 5.0% trichloroacetic acid from tea leaves using fresh leaf samples (0.2 g). The homogenate was used for the estimation of total peroxide content [28]. Lipid peroxidation was measured as the amount of TBARS chiefly MDA determined by the thiobarbituric acid (TBA) reaction as described by Heath and Packer [29]. The leaf tissues (0.2 g) were homogenized in 2.0 ml of 0.1% (w/v) trichloroacetic acid (TCA). The homogenate was centrifuged at 10,000 g for 20 min. To 1.0 ml of the resulting supernatant, 1.0 ml of TCA (20%) containing 10.5% (w/v) of TBA and 10.0 cm6 (4.0% in ethanol) BHT (butylated hydroxytolune) were added. The mixture was heated at 95˚C for 30 min in a water bath and then cooled in ice. The contents were centrifuged at 10,000 g for 15 min and the absorbance was measured at 532 nm and corrected for 600 nm. The concentration of MDA was calculated using extinction coefficient of 155 m∙M–1∙ cm–1. The estimation of  was done as suggested by Elstner and Heupal [30] by monitoring the nitrate formation from hydroxylamine with some modifications. The plant materials were homogenised in 3.0 ml of 65 mM phosphate buffer (pH 7.8) and centrifuged at 5000 g for 10 min. The reaction mixture contained 0.9 ml of 65 mM phosphate buffer, 0.1 ml of 10 mM hydroxyl amine hydrochloride and 1.0 ml of the supernatant plant extract. After incubation at room temperature (25˚C) for 20 min, 1.0 ml of 17 mM sulphanilamide and 1.0 ml of 7 mM a-napthyl were added. After reactions at 25˚C, 1.0 ml of diethyl ether was added and centrifuged at 1500 g for 5 min and the absorbance was read at 530 nm. A standard curve with
  was established to calculate the production rate of
  from the chemical reaction of
  and hydroxylamine.
2.5. Extraction and Estimation of Enzyme Activities
Leaf tissues were homogenized with potassium phosphate buffer pH 6.8 (0.1 M) containing 0.1 mM EDTA, 1% PVP and 0.1 mM PMSF in prechilled mortar pestle. The extract was centrifuged at 4˚C for 15 min at 17,000 g in a refrigerated cooling centrifuge. The supernatant was used for the assay of catalase (CAT), peroxidase (POX), polyphenol oxidase (PPO), superoxide dismutase (SOD) and glutathione reductase (GR). Catalase activity was assayed according to Chance and Maehly [31]. The 5.0 ml mixture comprise of 3.0 ml phosphate buffer (pH 6.8), 1.0 ml (30 mM) H2O2 and 1.0 ml enzyme extract. The reaction was stopped by adding 10.0 ml 2.0% H2SO4 after 1min incubation at 20˚C. The acidified reaction mixture was titrated against 0.1 N KMnO4 for determining the quantity of H2O2 utilized by the enzyme. The CAT activity was expressed as mmole H2O2 destroyed min–1∙g.fr.wt. POX and PPO was assayed using pyrogallol as substrate according to Kar and Mishra [32] with slide modification, where 5.0 ml of assay mixture contained 300 mM H2O2 and 1.0 ml of enzyme extract. After the incubations at 25˚C for 5 min, the reaction was stopped by the additions of 1.0 ml of 10% H2SO4. The purpurogallin formed was read at 430 nm. For PPO assay reaction mixture was the same except H2O2 was not added. 1 unit of enzyme activity is defined as that amount of enzyme which forms 1 mmole of purpurogallin formed per minute under the assay conditions.
The activity of SOD was measured using the method of Giannopolitis and Reis [33]. 3.0 ml assay mixture for SOD contained 79.2 mM Tris HCI buffer (pH 8.9), having 0.12 mM EDTA and 10.8 mM tetra ethylene diamine, bovine serum albumin (3.3 × 10⁻³%), 6.0 mM nitroblue tetrazolium (NBT), 600 μM riboflavin in 5.0 mM KOH and 0.2 ml enzyme extract. Reaction mixture was illuminated by placing the test tubes in between the two tube lights (Philips 20 W). By switching the light on and off, the reaction mixture was illuminated and terminated. The increase in absorbance due to formazan formation was read at 560 nm. The increase in absorbance in the absence of enzyme was taken as 100% and 50% initial was taken to be an equivalent to 1 unit of SOD activity. Glutathione reductase (GR) was assayed by the method of Smith et al. [34]. The reaction mixture contained 1.0 ml of 0.2 M potassium phosphate buffer (pH 7.5) having 1 mM EDTA, 0.5 ml of 3.0 mM DTNB (5,5-dithiobis-2 nitrobenzoicacid) in 0.01 M potassium phosphate buffer (pH 7.5), 0.1 ml of 2.0 mM NADPH, 0.1 ml enzyme extract and distilled water to make up a final volume of 2.9 ml. Reaction was initiated by adding 0.1 ml of 2 mM GSSG (oxidised glutathione). The increase in absorbance at 412 nm was recorded at 25˚C over a period of 5 min, spectrophotometrically. The activity has been expressed as absorbance change (DA412) g. fresh mass–1∙sec–1.
2.6. Statistical Analysis
Each experiment was repeated thrice and data presented are mean ± standard error (SE). The results were subjected to ANOVA using GLM factorial model on all the parameters. Tukey test was used for comparision between pairs of treatments. The data analysis were carried out using statistical package, SPSS 7.5.
3. Results
3.1. Growth and RWC
A decrease in dry mass of leaf was observed in all the water stressed plants. On rehydration and micronutrient treatments an increase in dry mass of leaves in recovery phase was observed in all the tested clones after 10 d (PDR I), 20 d (PDR II) and 30 d (PDR III) of treatment (Table 1). This shows that dry mass of tea leaves increases as a result of micronutrient spray during the recovery process, with increasing days of treatment being highest after 30 days (PDRIII) of treatment. Such increase in dry mass as a consequent of K and Ca treatment might be due to enhanced photosynthesis or increased synthesis of antioxidant in plants.
Drought induced decrease in RWC was observed in all the tested clones of Camellia sinensis as reported earlier. After rehydration plants recover RWC and maintains highest content in TV-29 (84.61%), which was enhanced by the spray of almost all the tested micronutrient. Maximum recovery of RWC of leaf was observed in almost all the clones treated with various concentrations of K and Ca. The highest response of these micronutrient was observed in TV-1 followed by TV-30, TV-29 and TV-20 (Table 2).
3.2. Total Phenolic, Metabolites and Antioxidant Levels
Total phenolic content in tea leaves decreased with increasing water stress. On rewatering, the phenolic content of the stressed plant was found to have increased. The phenolic content of recovering plants showed significant differences with the micronutrient treatments as compared to control. Ca and K treatment showed the highest response in almost all the clones, with highest content in TV-30 (24.27% & 20.50%), followed by TV-29 (17.72% & 22.61%), TV-20 (24.63% & 38.01%) and TV-1 (27.52% & 21.78%). However, B treatment (50 mM) showed minimum increase in phenolic content, which again decrease with increasing concentration (100 mM) [Table 1].
Proline plays an important role as osmoprotectant during the stress period. An increase in proline content was observed in all the clones after water stress imposition as compared to well irrigated plants. But rehydration recovery study with nutrient treatment suggested a variation in response of nutrient treatment in different clones tested. TV-1 showed highest proline content in response to boron and calcium treatment while other three clones (TV-20, TV-29 & TV-30) showed better response with boron and Mn treatment [Table 2].
Increasing water stress, resulted in a significant decrease of non-enzymic antioxidant (ascorbate and glutathione) content in all the clonal seedlings of tea as indicated in Figure 6. In the present study, post drought recovery with nutrient treatments suggested the effective role of Ca & K in increasing the ascorbate content. TV-1 (200.93% & 151.67%) and TV-30 (145.93% & 147.16%) showed highest response to Ca and K treatment, followed by TV-29 (74.98% & 169.20%) and TV-20 (69.63% & 74.95%) [Figure 1(a)]. The glutathione content varied within clones in response to micronutrient treatment during post stress rehydration. Almost all the clones showed highest glutathione content in response to calcium treatment, with highest response in TV-1 and TV-30 followed by TV-29 and TV-20 even after 30 days of treatment (PDR III). The effect of Boron on glutathione content was also maximum in TV-1, with lowest response shown by TV-20. Again compared to only rehydrated plants, K treatment was mostly effective in TV-20, followed by TV-1, TV-30 and TV-29. However, Mn treatment was found to be most effective in TV-29, followed by TV-20, TV-30 and TV-1. Manganese was found to be most the
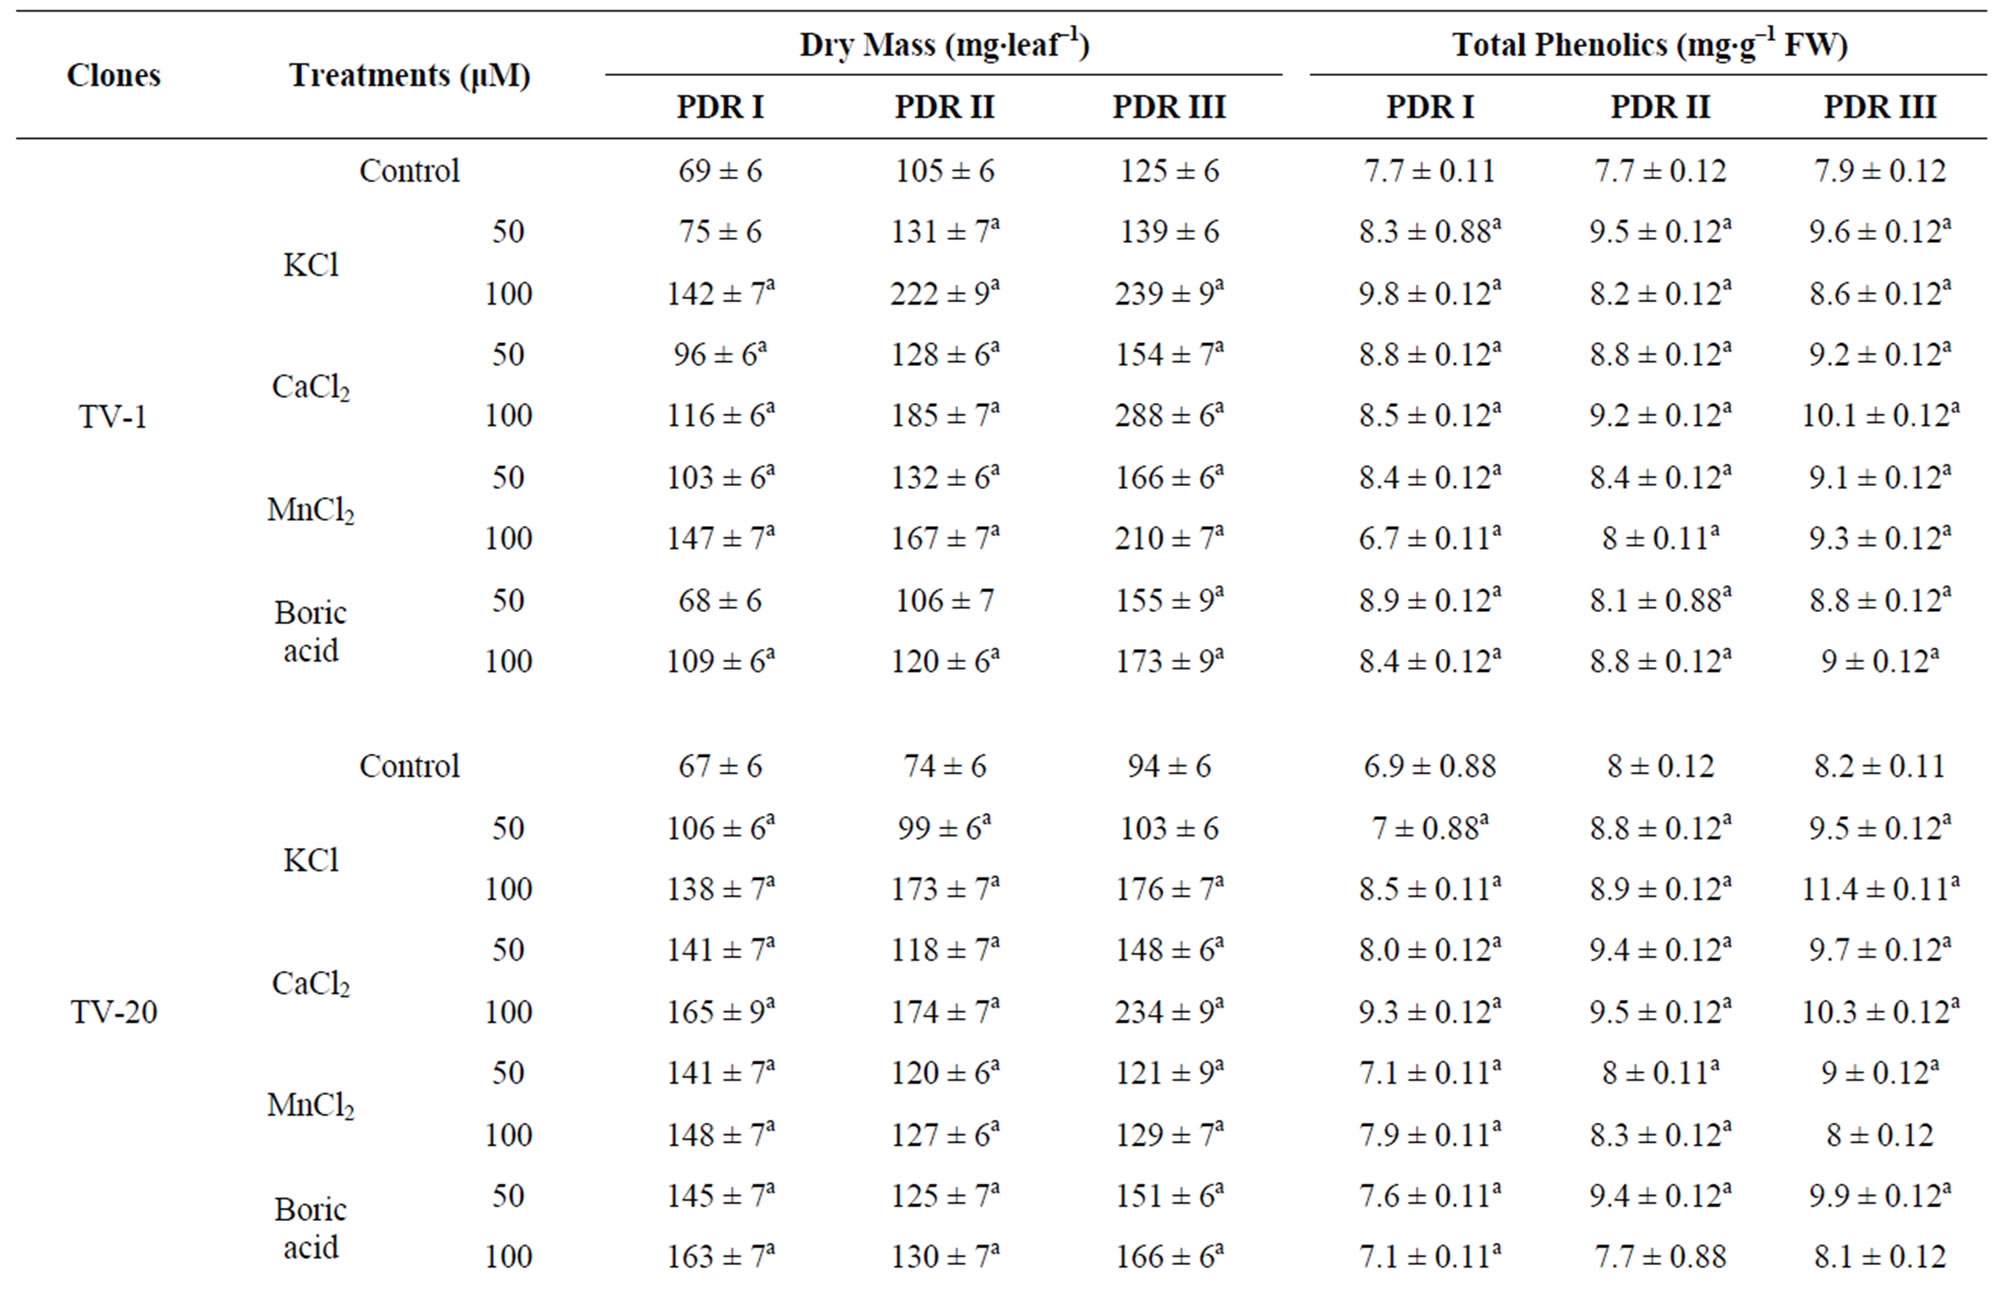
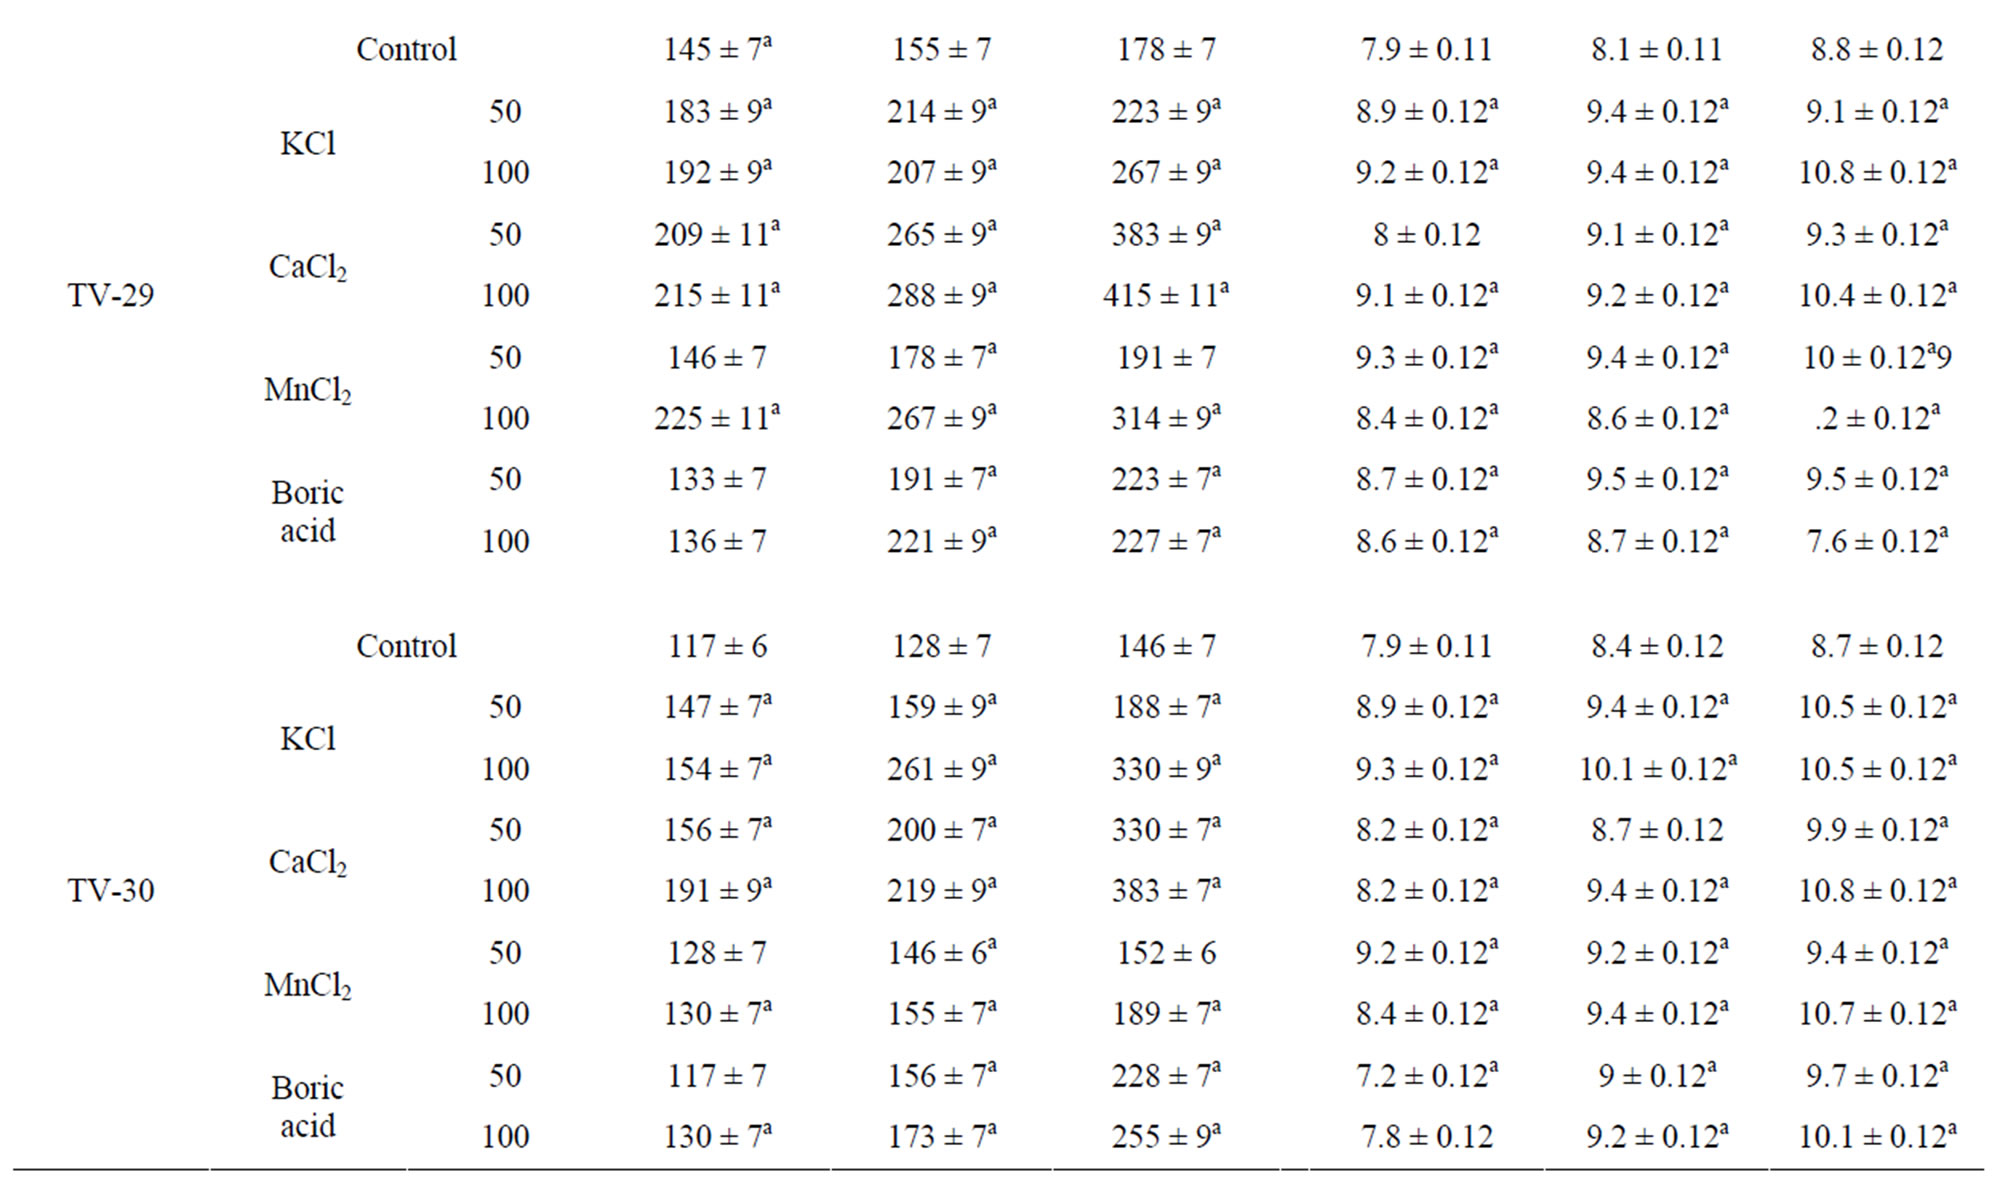
Table 1. Changes in dry mass and total phenolics content in four clonal varieties of Camellia sinensis subjected to post drought recovery after rehydration and nutrient treatments. Control was sprayed with distilled water. PDR I, PDR II and PDR III indicates sampling after 10 d, 20 d and 30 d of nutrient treatments following rehydration. Mean value superscript with “a” indicates significant mean difference from control at p = 0.05 in multiple comparision by Tukey test.
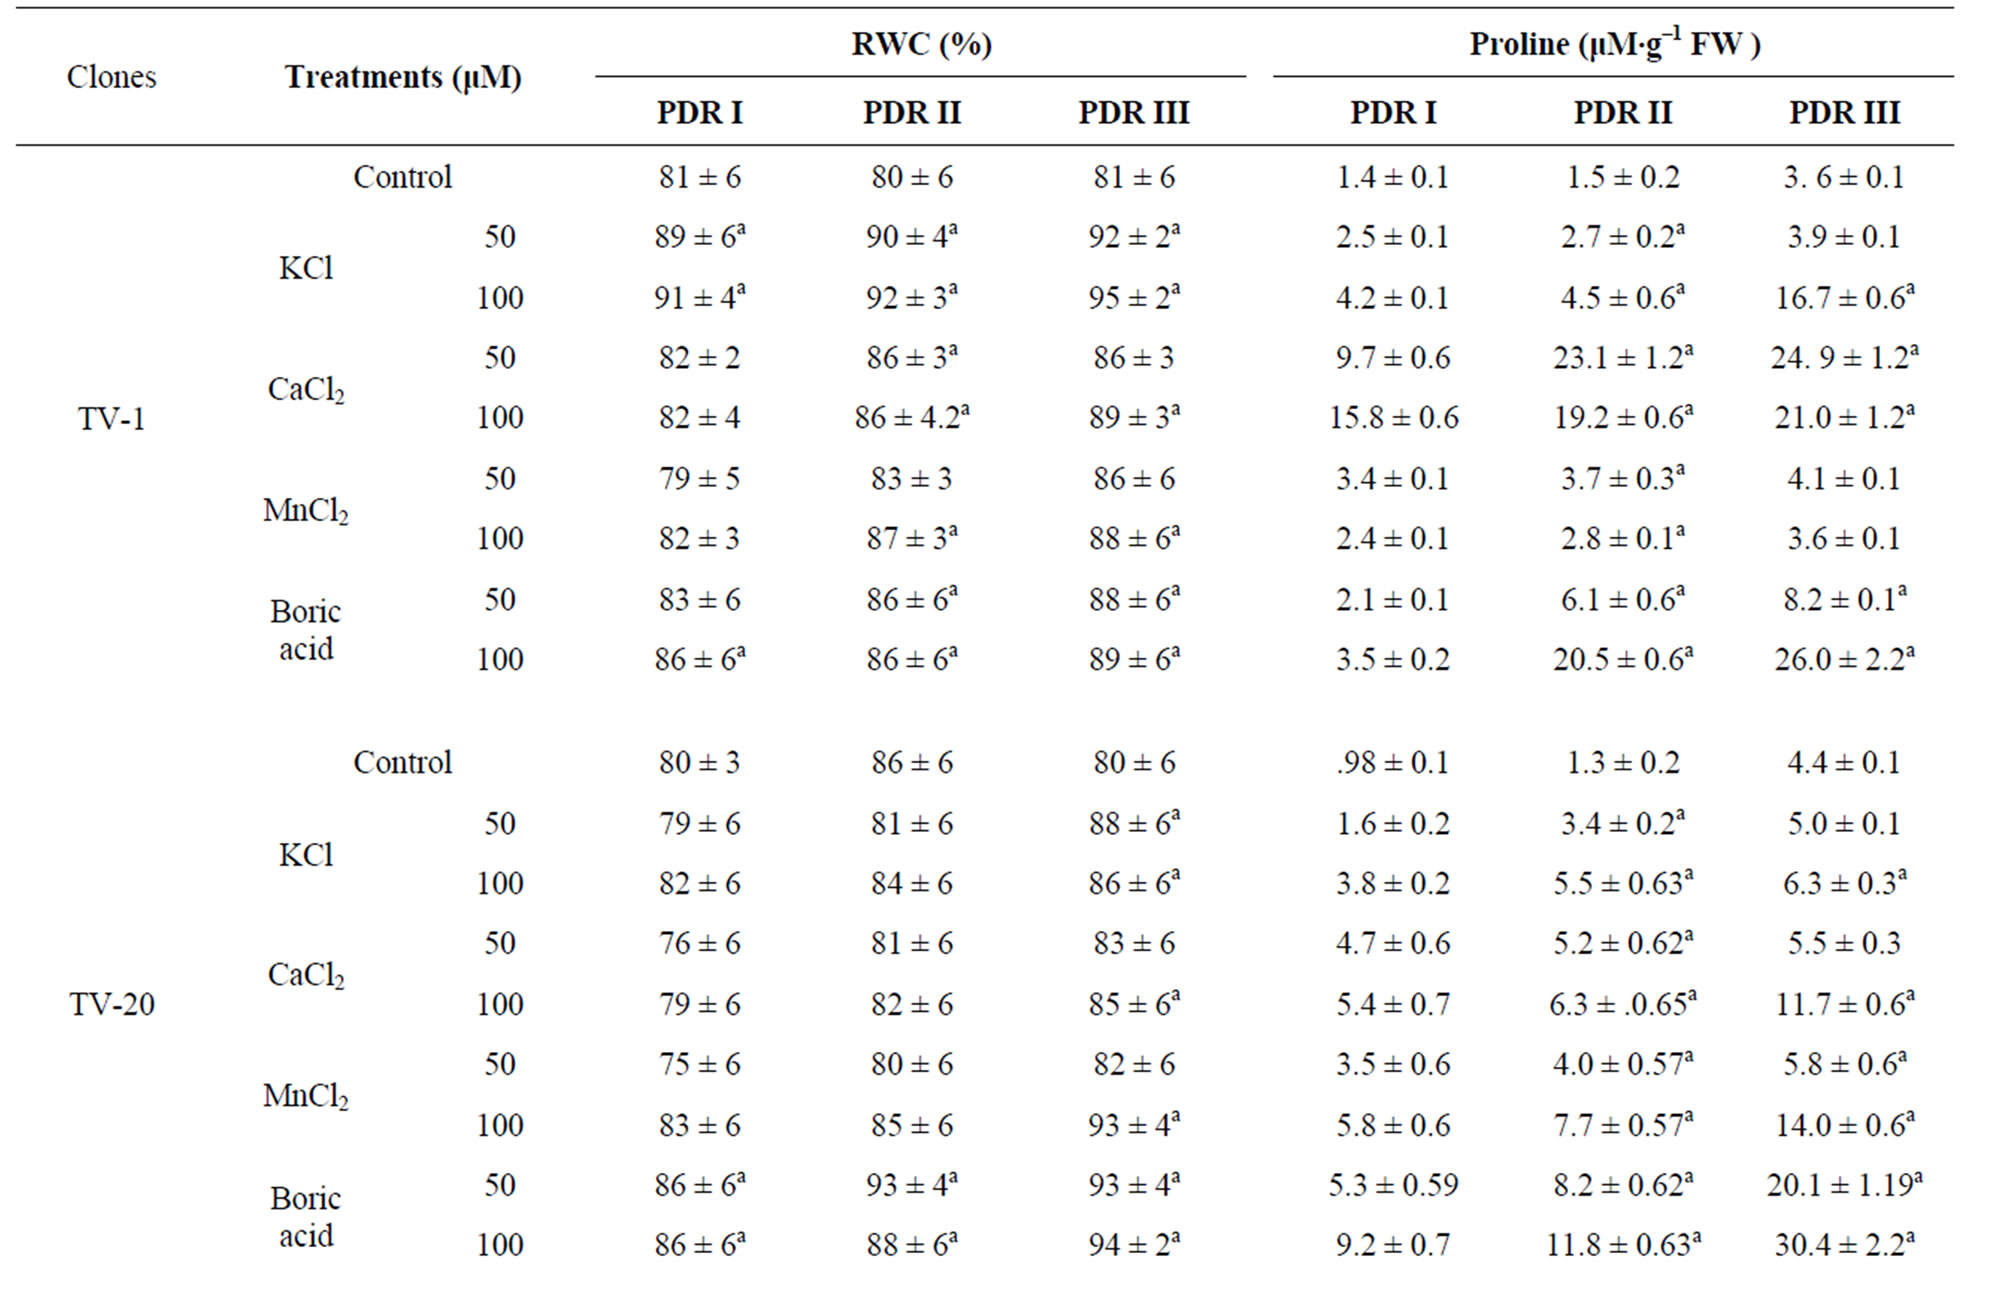
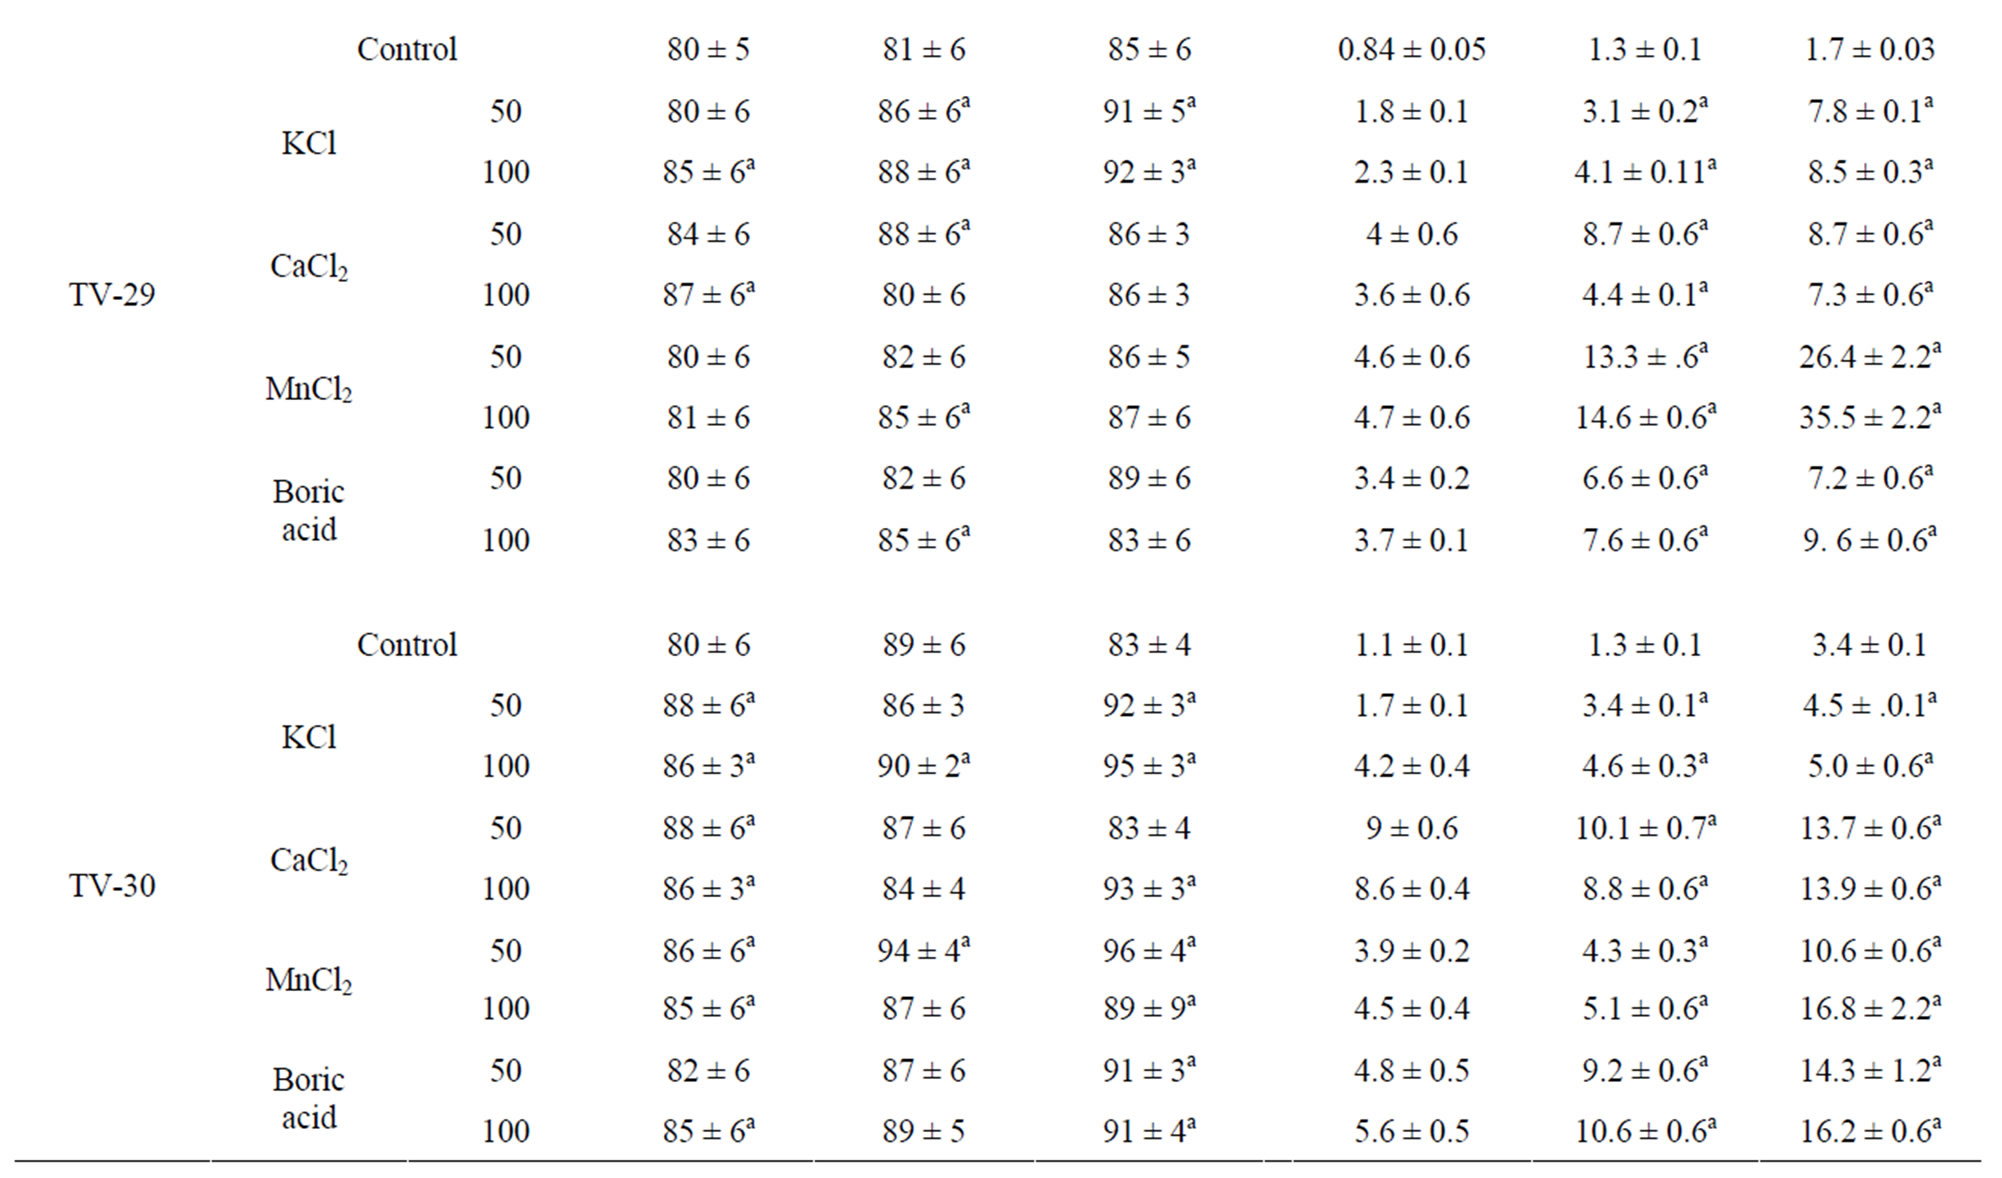
Table 2. Changes in relative water content (RWC%) and proline content in four clonal varieties of Camellia sinensis subjected to post drought recovery after rehydration and nutrient treatments. Control was sprayed with distilled water. PDR I, PDR II and PDR III indicates sampling after 10 d, 20 d and 30 d of nutrients treatments following rehydration. Mean value superscript with “a” indicates significant mean difference from control at p = 0.05 in multiple comparision by Tukey test.
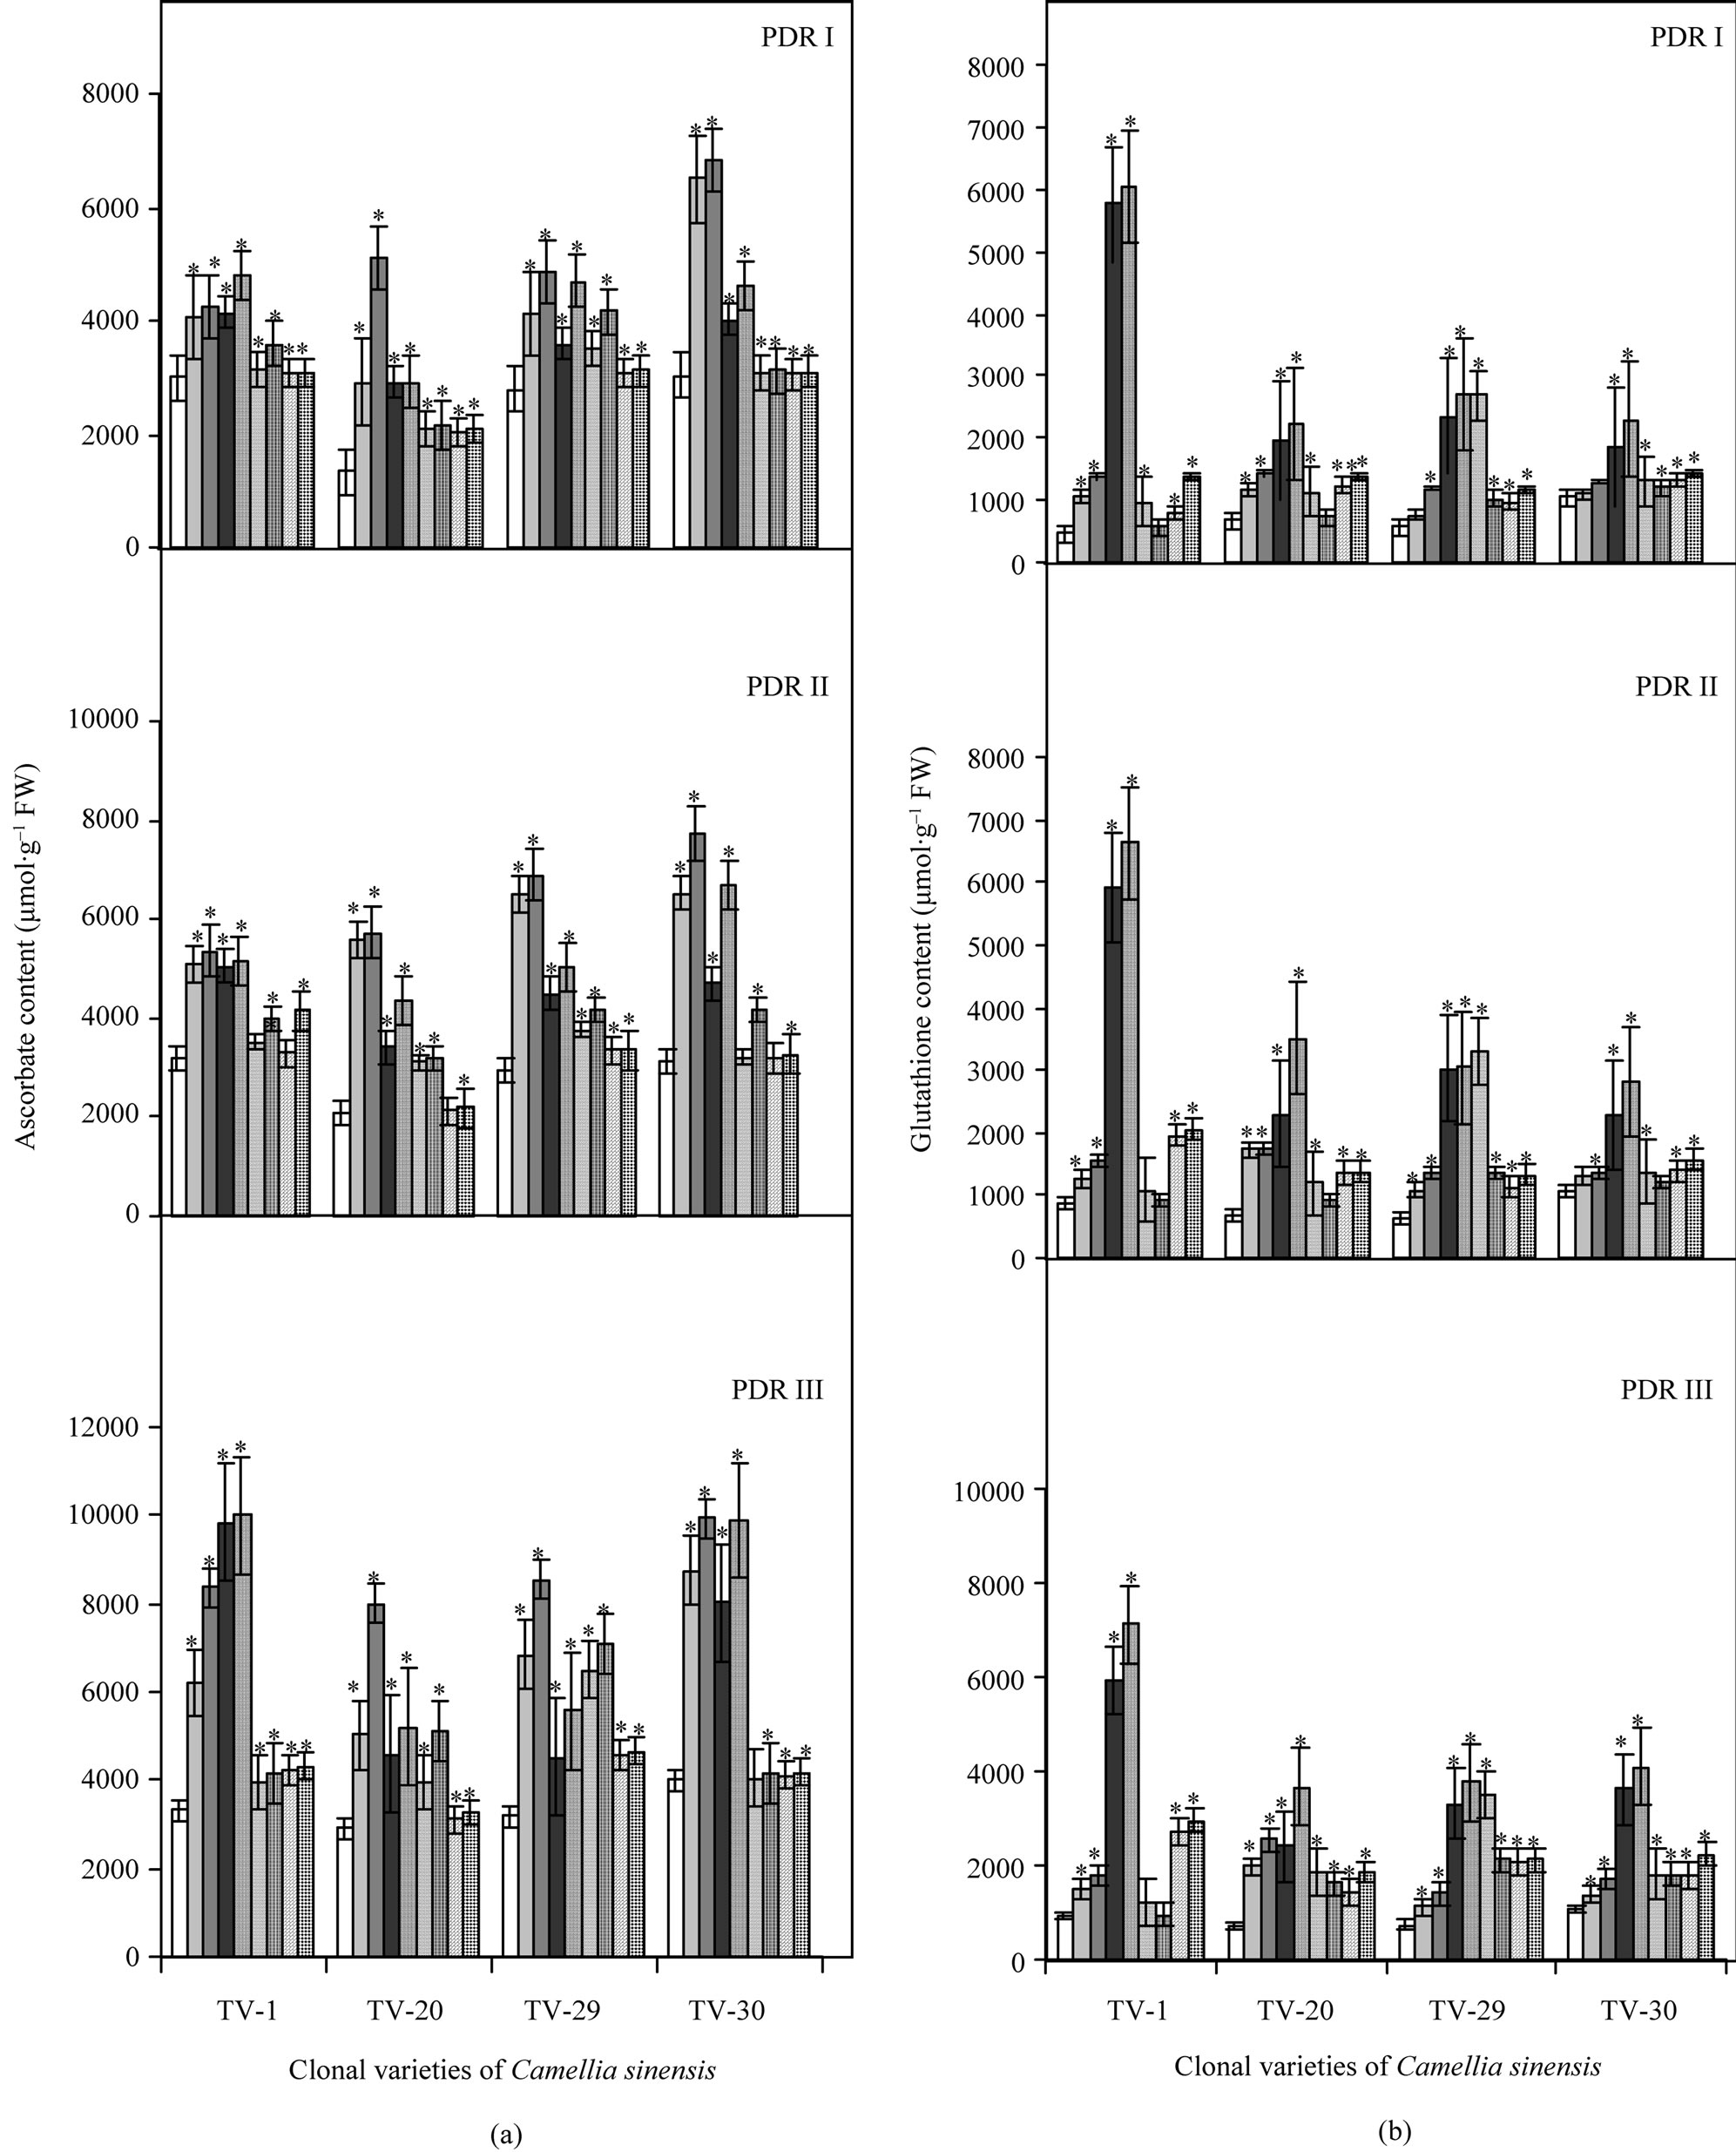
Figure 1. Changes in ascorbate (a) and glutathione (b) content in four clonal varieties of Camellia sinensis (L.) O Kuntze after 10 d (PDR I), 20 d (PDR II) and 30 d (PDR III) of micronutrient treatments on the plants under post-drought recovery process after rehydration. Control ( ); 50 µM KCl (
 ), 100 µM KCl (
 ); 50 µM CaCl2 (
 ), 100 µM CaCl2 (
 ); 50 µM MnCl2 (
 ), 100 µM MnCl2 (
 ); 50 µM boric acid (
 ), 100 µM boric acid (
 ). Data presented are mean ± SE (n = 3). *Significant mean difference from control at p = 0.05 in multiple comparision by Tukey test.
effective at 50 mM concentration (Figure 1(b)).
3.3. CAT, SOD and GR Activity
With increasing drought stress, CAT activity increased in various clones of Camellia sinensis (see Figure 6). After rehydration, during recovery process the effect of B on CAT activity was highest in TV-30 and TV-29, followed by TV-20 and TV-1. Calcium and potassium treatment showed increased CAT activity in TV-1 and TV-30 followed by TV-20 and TV-29 (Figure 2(a)). SOD activity decreased with the increasing water stress but after rehydration and micronutrient treatment, a great variation in SOD activity was observed. A non-uniform increase in SOD activity was observed in all the nutrient treated plants. TV-1 showed highest response with Ca and K treatment followed by B and Mn, while TV-20 showed highest SOD activity with B treatments (50 mM), which maintained highest SOD activity even in PDR II plants. Though Ktreated TV-20 plants in PDRII showed maximum SOD activity, with increasing days of treatment TV1 maintained highest activity with the influence of K and Ca. TV-29 showed highest SOD activity in PDR II with K (100 mM) and B (50 mM) treatment. However with increasing days of rehydration followed by micronutrient spray, SOD activity decreased. The effect of Mn in changing SOD activity was highest in TV-30 and TV-29 followed by TV-1 and TV-30 (Figure 2(b)).
There was a significant increase in GR activity in all the tested clones as a consequent of imposition of dehydration stress as reported elsewhere. On rewatering, GR activity decreased due to micronutrient treatment. TV-1 showed the highest GR activity with Mn treatment followed by K, Ca, and B. TV-20 showed highest response with boron followed by Ca and K treatment. Similar results were also shown by TV-29 with various micronutrient treatments whereas TV-30 showed increased GR activity with maximum in K and B treated plant, followed by Ca and Mn (Figure 3(a)).
3.4. , H2O2 Concentrationt and Lipid Peroxidation
Superoxide anion ( ) generation in plant increased with the increased drought stress imposition as indicated in Figure 6. But on rewatering,
  content decreased with maximum decrease in TV-1 followed by TV-30, TV-29 and TV-20 as compared to the stressed plants. However, micronutrient treatment with rehydration showed various responses in tested clones. In TV-1, lowest
  level was maintained by K (100 mM) treatment with 428%, 475% and 552% decrease in
  level in PDR I, PDR II and PDR III, respectively as compared to control. The decrease in
  content was 353%, 263% and 206% with Mn; 197%, 186% and 420% with boron and 51%, 32%, 116% with Ca in PDR I, PDR II and PDR III plants, respectively. In TV-20 lowest
  was maintained with Mn & boron (442% decrease) in PDR III as compared to control. TV-29 also showed lowest
  content with Mn (587%) and B (442% decrease) treatments in PDR III. The response of TV-30 was the best with Mn and Ca, followed by K and B. Treatment with Mn, Ca, K and B showed 1849%, 759%, 500% & 500% decrease in
  content over control in PDR III, respectively (Figure 3(b)).
Lipid perxoidation measured in terms of MDA was higher in all the stressed plants after 10 d, 20 d of drought imposition (data not shown; see Figure 6). Lipid peroxidation was decreased after rehydration and with the different micronutrient treatments. Decrease in MDA content was maximum in almost all the clones with Ca treatment, except TV-29, which showed minimum lipid peroxidation with K (66%) and Mn (64%) in PDR III as compared to control. Decrease in lipid peroxidation was minimum with B in TV-1 & TV-29. TV-20 and TV-30 showed the lowest lipid peroxidation in response to B treatment as compared to other clones (Figure 4(a)).
Dehydration stress results in increased H2O2 content in plants as conceptualized in Figure 6. On rehydration H2O2 content decreased in different recovery phases (PDR I, PDR II & PDR III), which again reduced with various micronutrient application in different clones. TV-1 showed maximum decrease in H2O2 with B (274%) and K (268%) followed by Mn (198%) & Ca (141%) treatment over control. TV-20 showed maximum decrease with Ca (262%) and Mn (145%), followed by K (91%) and B (152%) treatment in PDR III. TV-29 maintained the lowest H2O2 content with Ca (256%) and K (159% decrease). In TV-30, maximum decrease with 267%, 247% over control was observed in PDR III plants due to Ca and B treatment, respectively (Figure 4(b)).
3.5. POX and PPO Activity
POX activity was found to have increased in the stressed plants as compared to control after 10 and 20 days of dehydration but after rehydration, recovering plants showed increased POX activity, which is enhanced by the micronutrient spray. TV-1 and TV-20 showed maximum POX activity in response to K and Ca treatment followed by Mn and B, whereas TV-29 showed maximum POX activity in response to Mn and B, followed by Ca and K treatment. However, TV-30 showed highest POX activity in response to K and Ca, at the initial stage followed by B and Mn, but with increasing days of rehydration and micronutrient spray TV-30 maintained the high POX activity with B and K followed by Mn and Ca (Figure 5(a)).
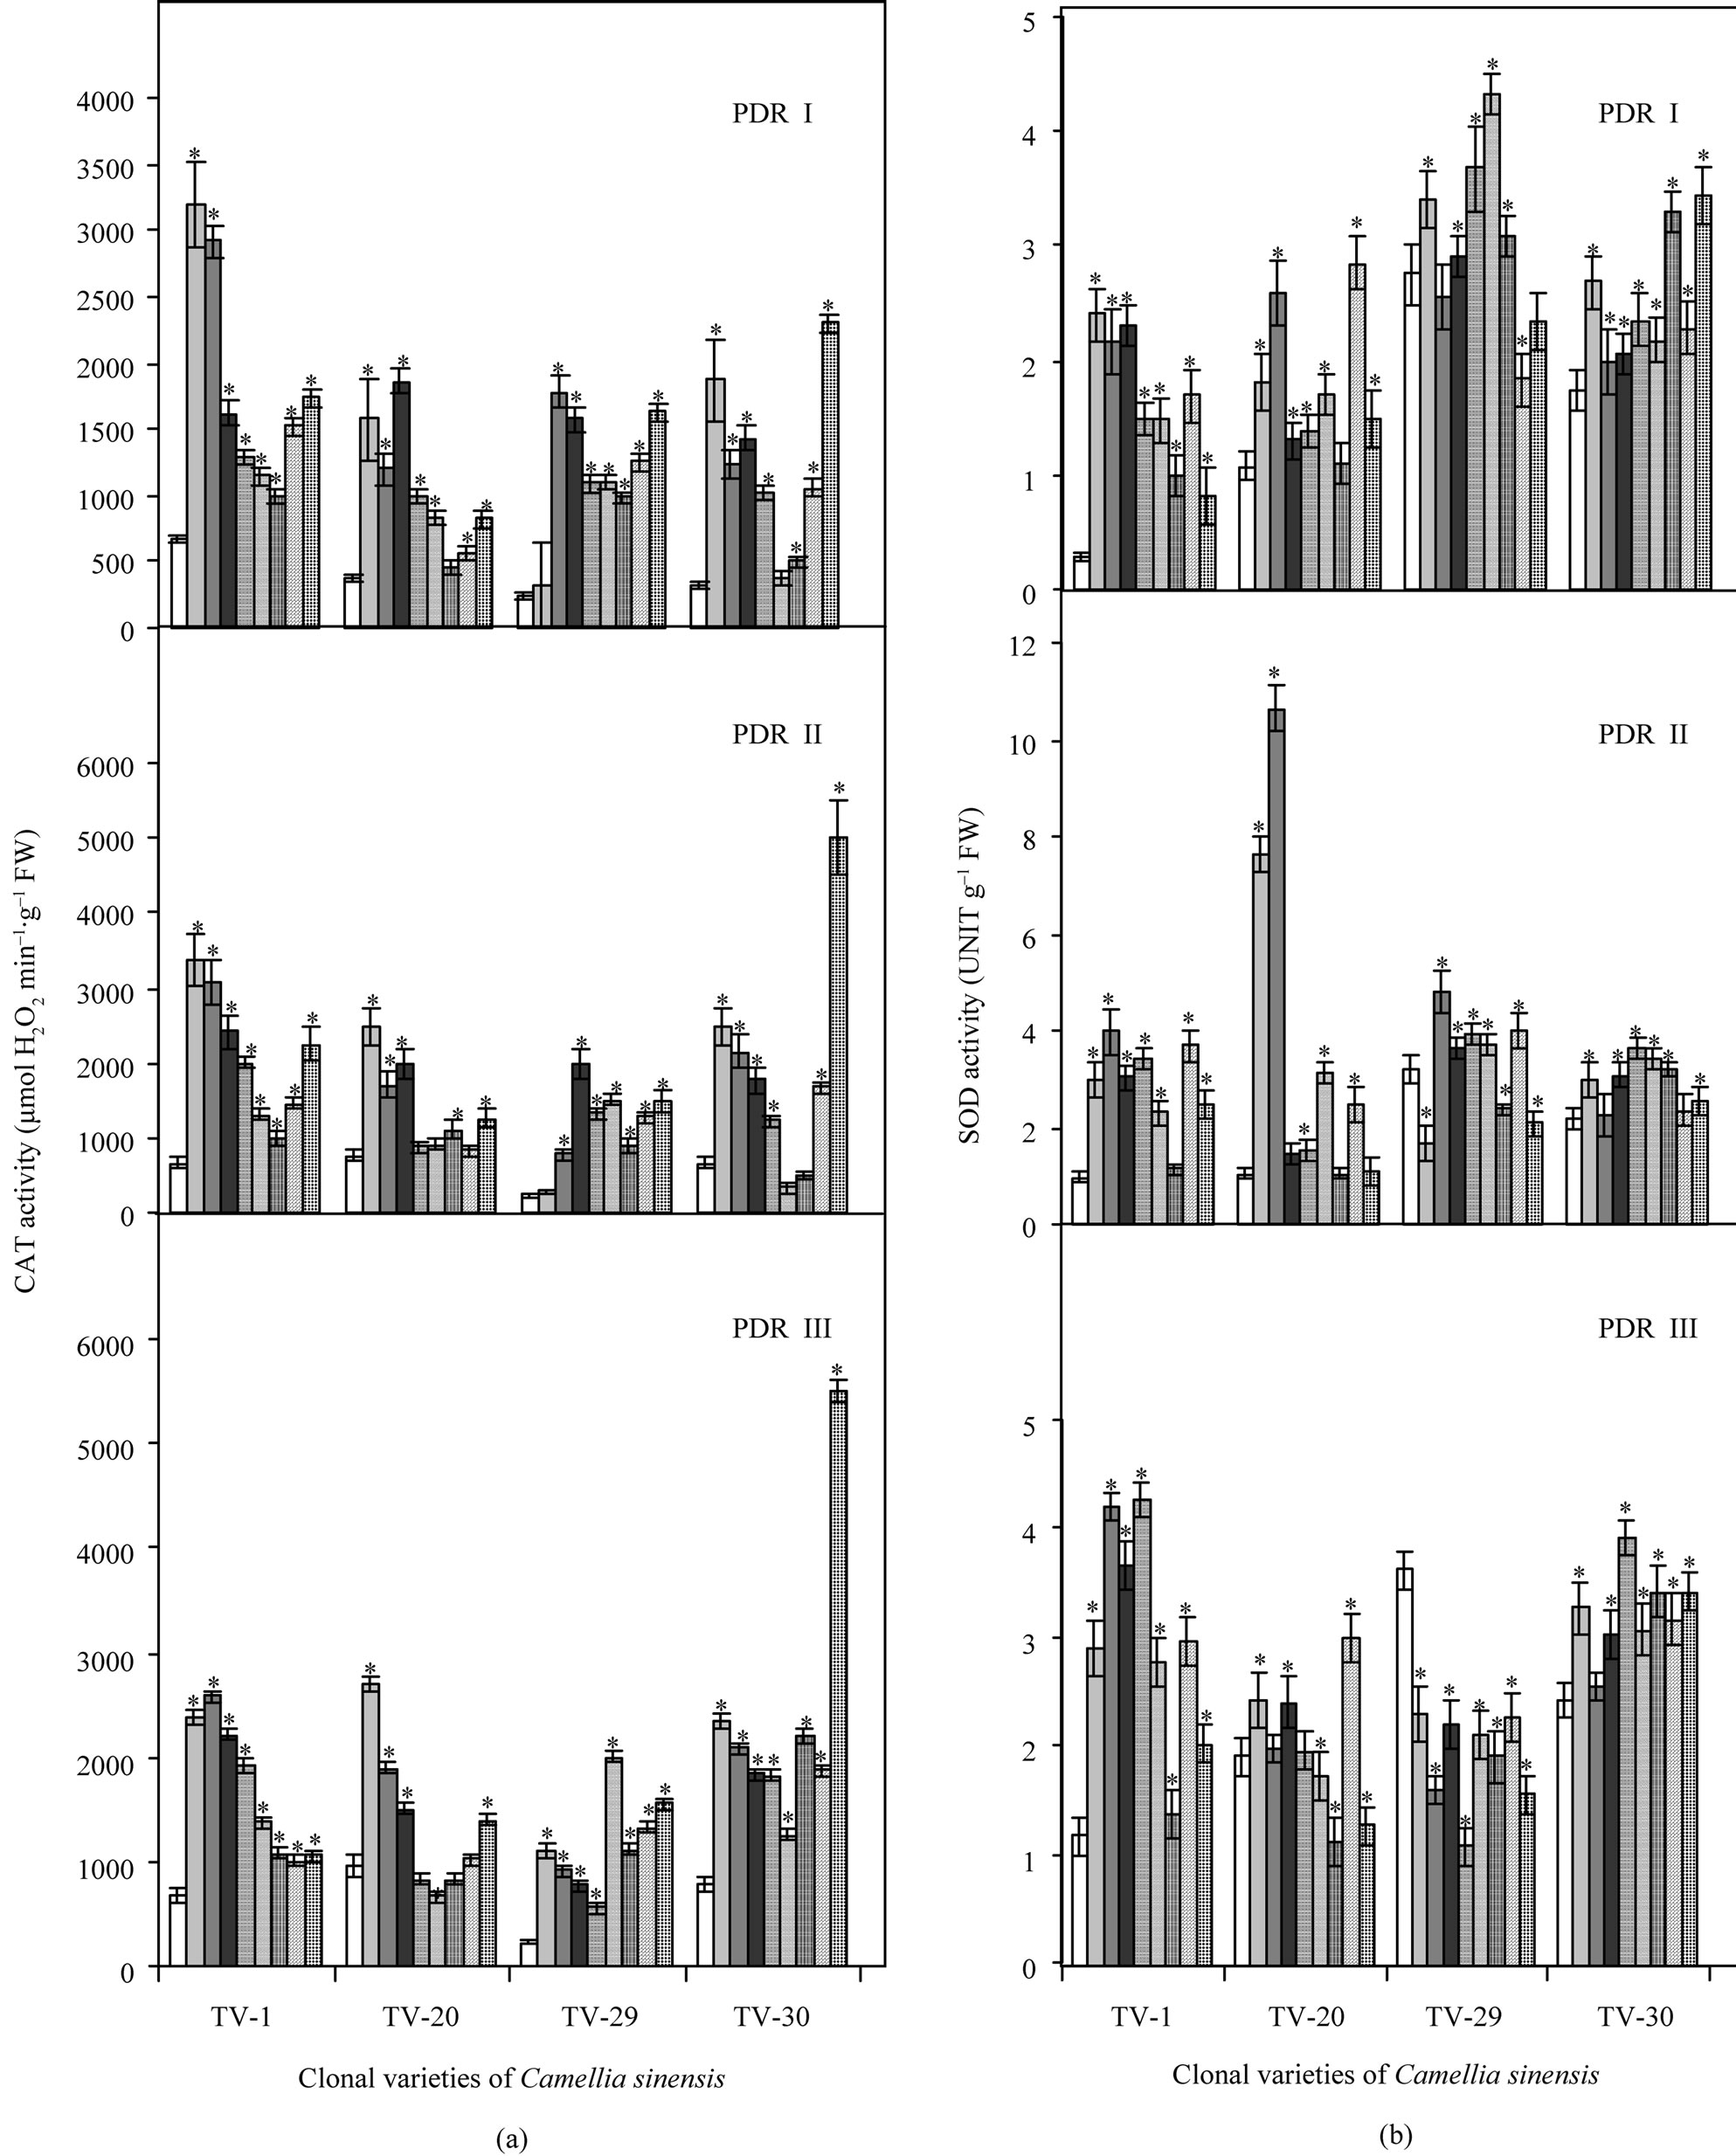
Figure 2. Changes in activities of catalase (CAT) (a) and superoxidase dismutase (SOD) (b) in four clonal varieties of Camellia sinensis (L.) O Kuntze after 10 d (PDR I), 20 d (PDR II) and 30 d (PDR III) of micronutrient treatments on the plants under post-drought recovery process after rehydration. Control ( ); 50 µM KCl (
 ), 100 µM KCl (
 ); 50 µM CaCl2 (
 ), 100 µM CaCl2 (
 ); 50 µM MnCl2 (
 ), 100 µM MnCl2 (
 ); 50 µM boric acid (
 ), 100 µM boric acid (
 ). Data presented are mean ± SE (n = 3). *Significant mean difference from control at p = 0.05 in multiple comparision by Tukey test.
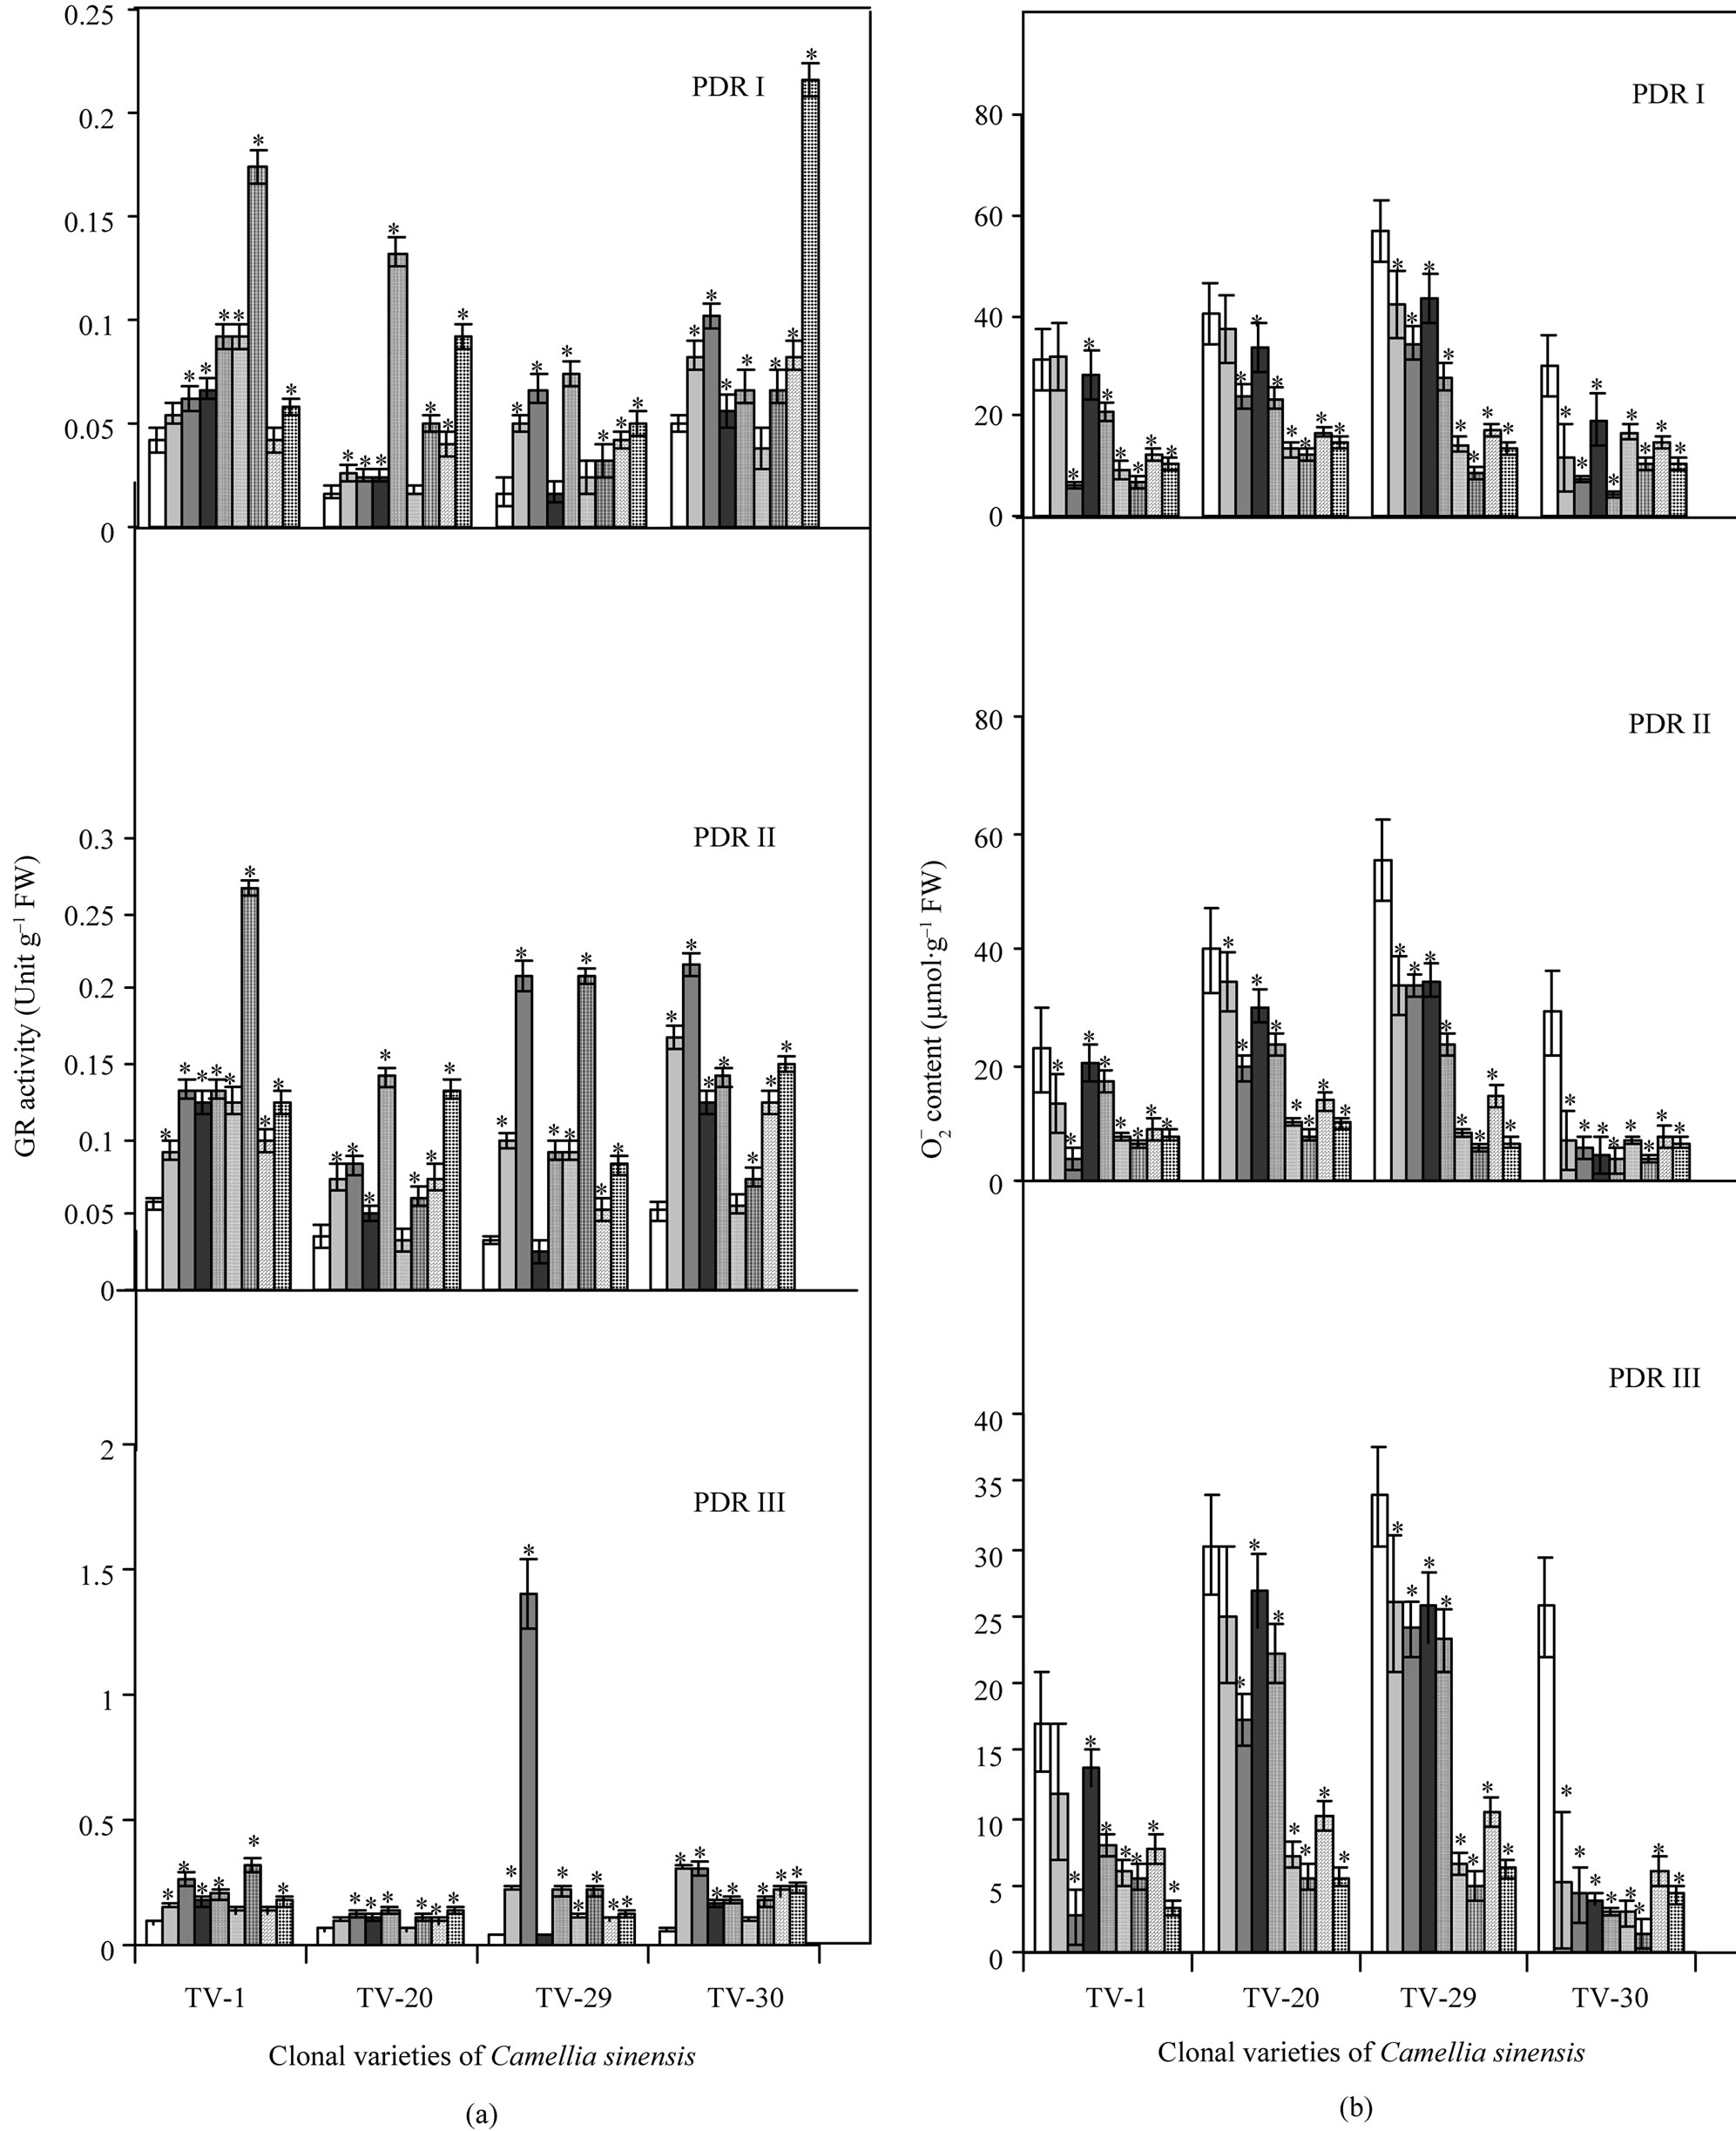
Figure 3. Changes in activities of glutathione reductase (GR) (a) and superoxide anion content ( ) (b) in four clonal varieties of Camellia sinensis (L.) O Kuntze after 10 d (PDR I), 20 d (PDR II) and 30 d (PDR III) of micronutrient treatments on the plants under post-drought recovery process after rehydration. Control (
 ); 50 µM KCl (
 ), 100 µM KCl (
 ); 50 µM CaCl2 (
 ), 100 µM CaCl2 (
 ); 50 µM MnCl2 (
 ), 100 µM MnCl2 (
 ); 50 µM boric acid (
 ), 100 µM boric acid (
 ). Data presented are mean ± SE (n = 3). *Significant mean difference from control at p = 0.05 in multiple comparision by Tukey test.
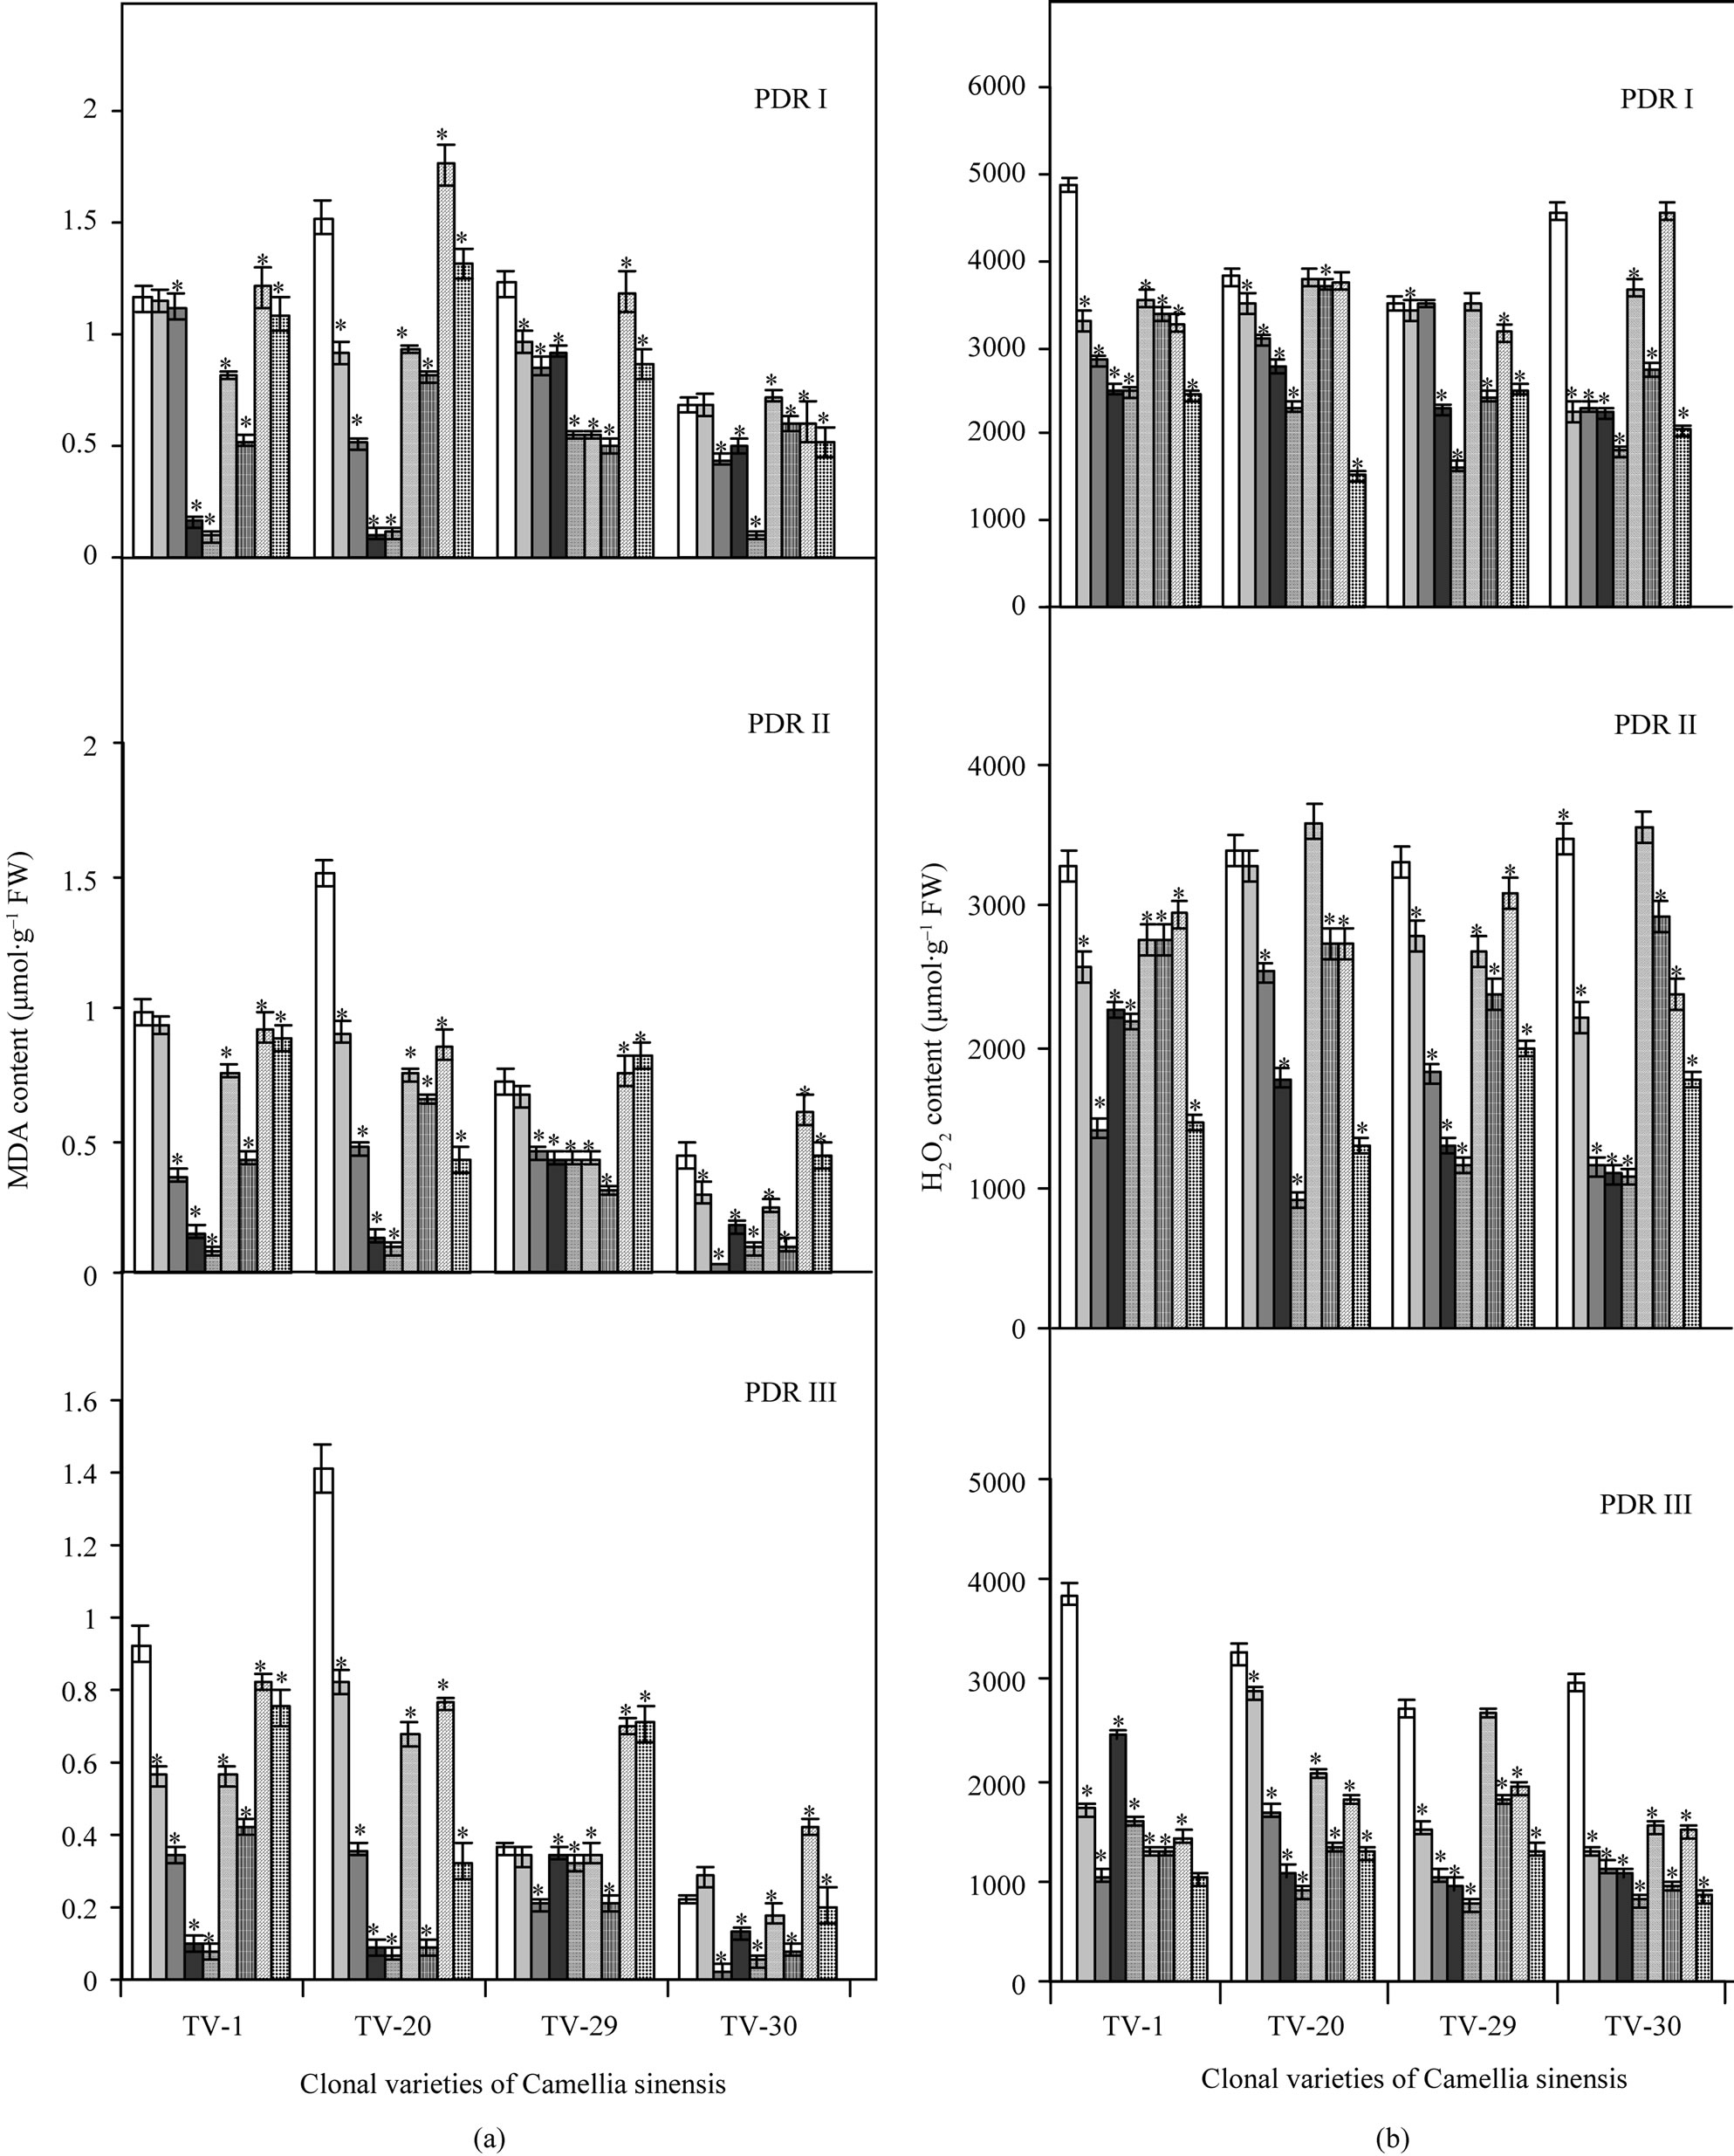
Figure 4. Changes in MDA (a) and total peroxide (H2O2) (b) contents in four clonal varieties of Camellia sinensis (L.) O Kuntze after 10 d (PDR I), 20 d (PDR II) and 30 d (PDR III) of micronutrient treatments on the plants under post-drought recovery process after rehydration. Control ( ); 50 µM KCl (
 ), 100 µM KCl (
 ); 50 µM CaCl2 (
 ), 100 µM CaCl2 (
 ); 50 µM MnCl2 (
 ), 100 µM MnCl2 (
 ); 50 µM boric acid (
 ), 100 µM boric acid (
 ). Data presented are mean ± SE (n = 3). *Significant mean difference from control at p = 0.05 in multiple comparision by Tukey test.
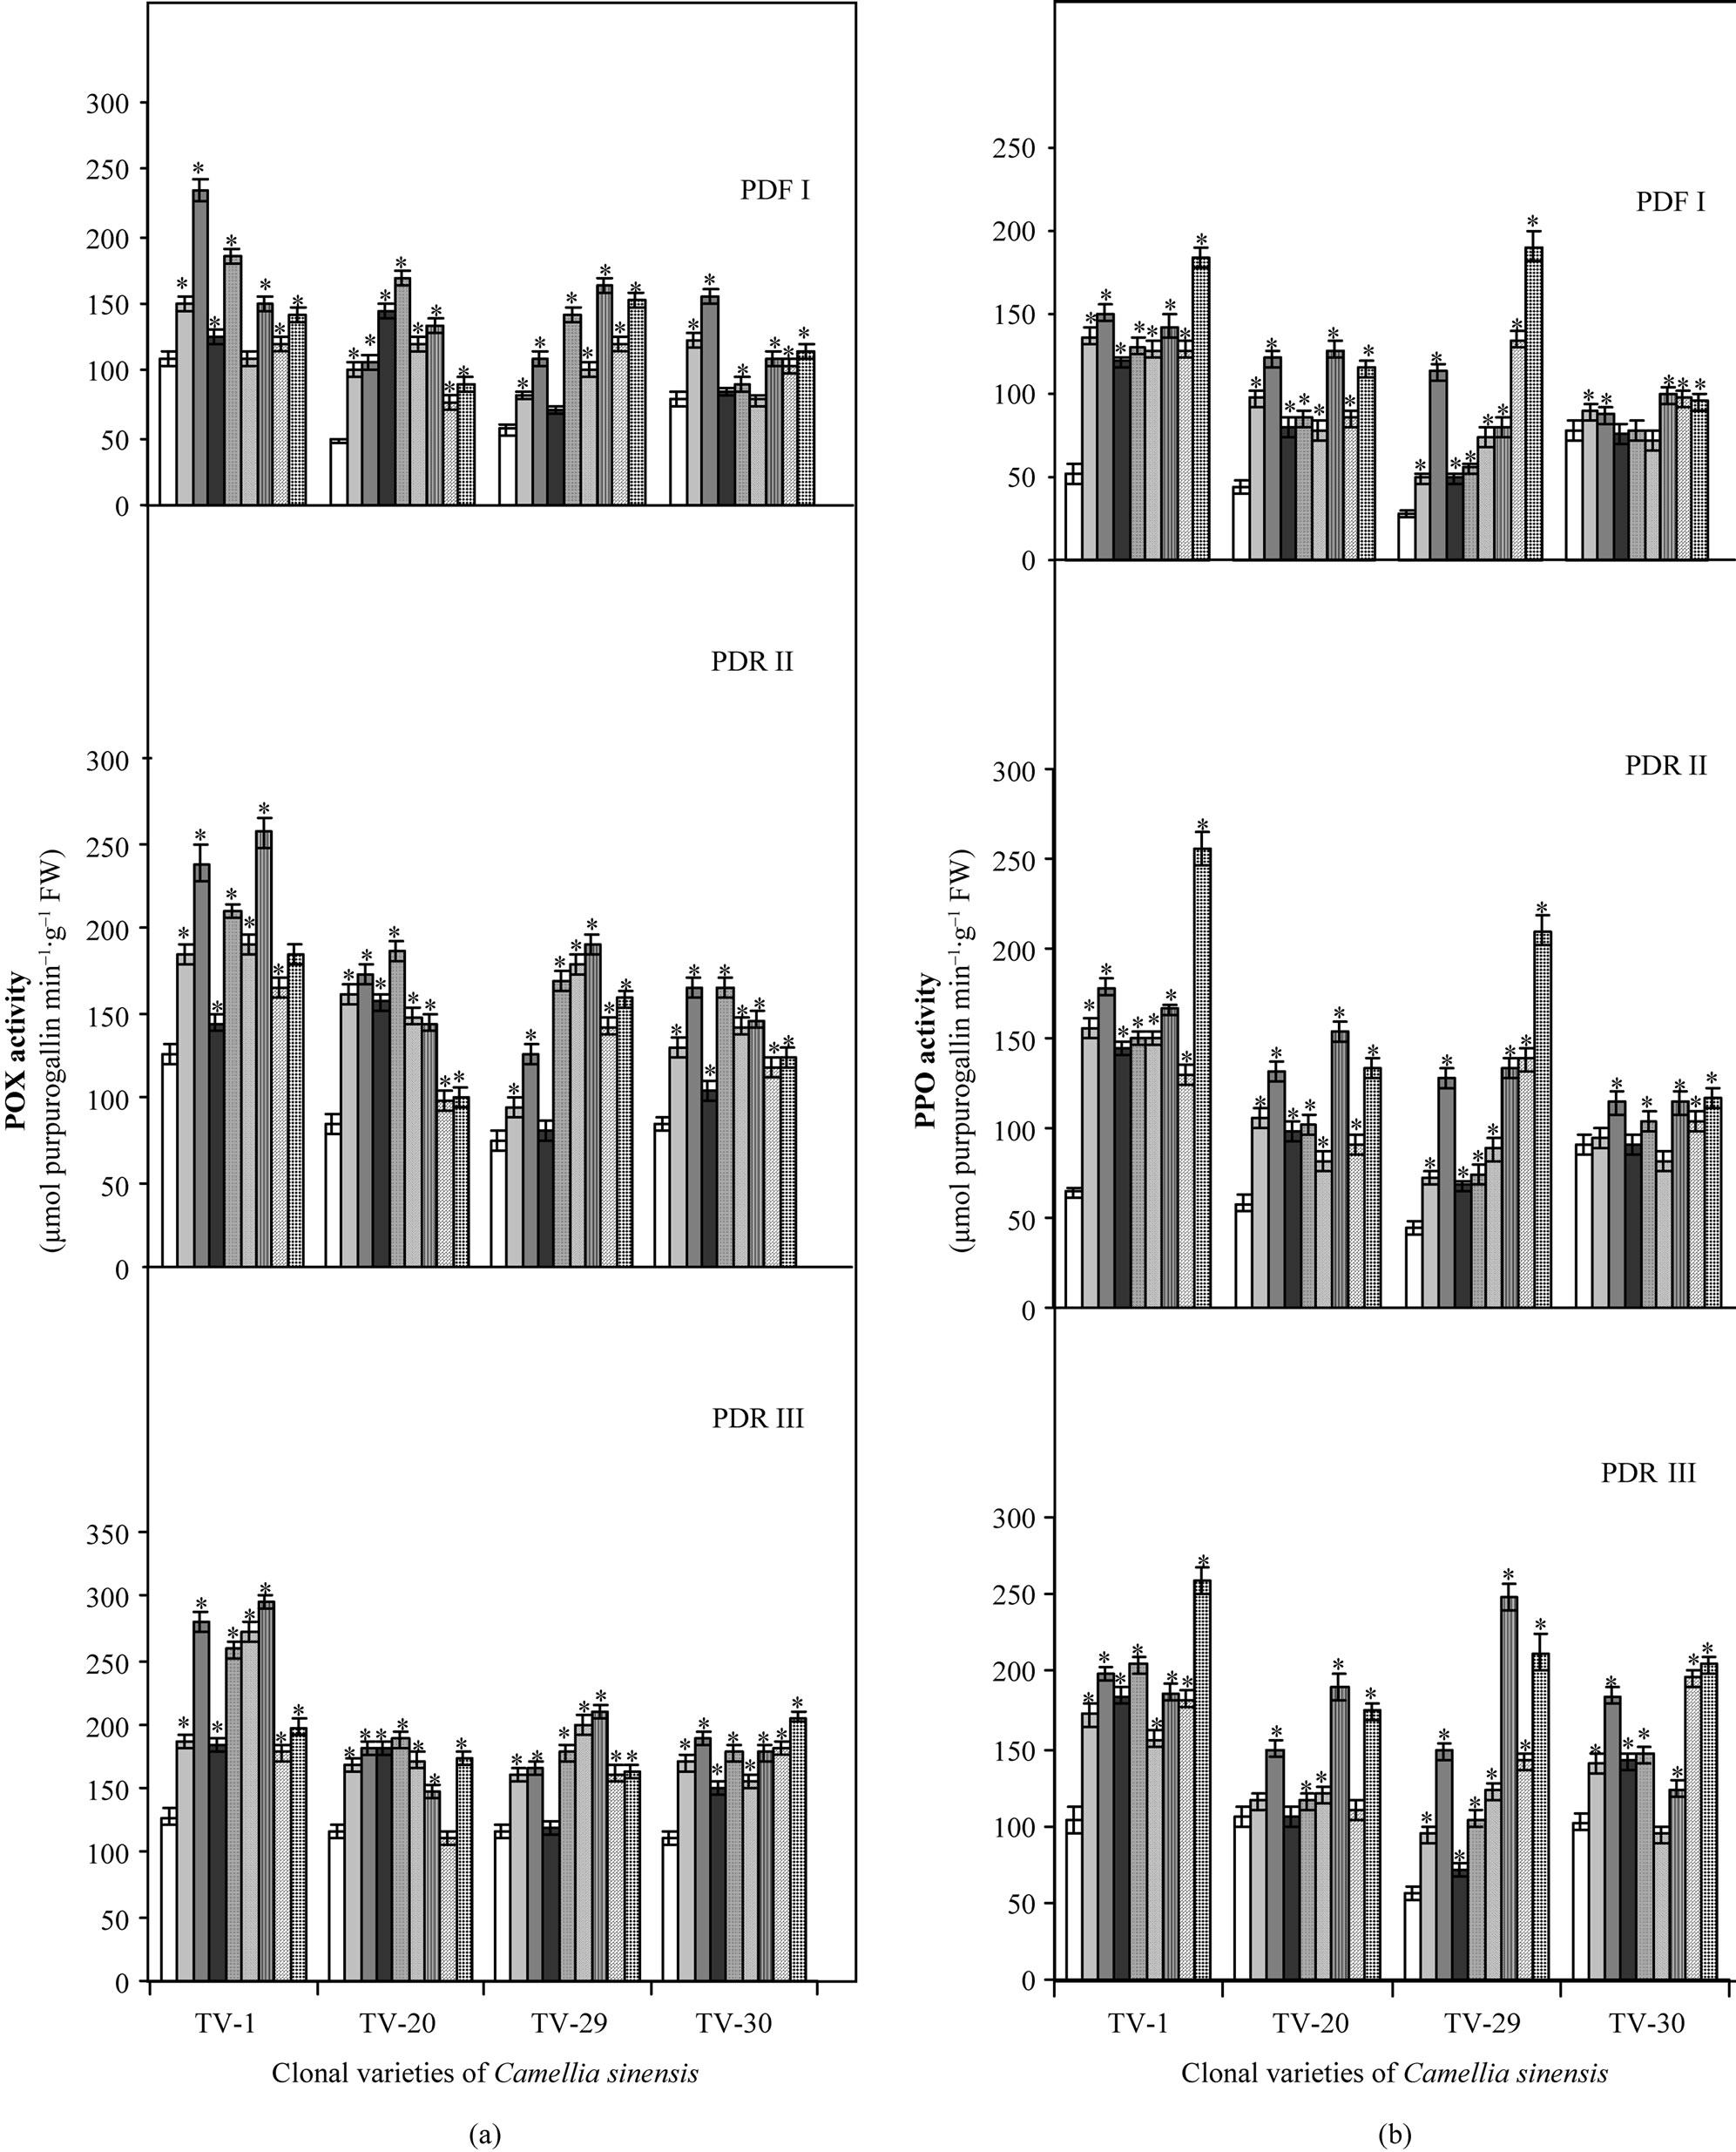
Figure 5. Changes in POX (a) and PPO (b) contents in four clonal varieties of Camellia sinensis (L.) O Kuntze after 10 d (PDR I), 20 d (PDR II) and 30 d (PDR III) of micronutrient treatments on the plants under post-drought recovery process after rehydration. Control ( ); 50 µM KCl (
 ), 100 µM KCl (
 ); 50 µM CaCl2 (
 ), 100 µM CaCl2 (
 ); 50 µM MnCl2 (
 ), 100 µM MnCl2 (
 ); 50 µM boric acid (
 ), 100 µM boric acid (
 ). Data presented are mean ± SE (n = 3). *Significant mean difference from control at p = 0.05 in multiple comparision by Tukey test.
PPO is also one of the important enzymes, which have potent role in the metabolism of tea. The activity of this enzyme has been reported to be increased with increasing dehydration stress in various clonal varieties of tea. After rehydration, the recovering plant showed increased PPO activity, which was enhanced by the foliar spray of various micronutrients. In TV-1, enhancement of PPO activity was higher in response to B and K followed by Ca and Mn treatments as compared to control with rehydration only. TV-20 showed higher initial PPO activity with Mn and K, followed by B and Ca treatments (PDR I and PDR II). TV-20 maintained higher PPO activity with B and K followed by Ca and Mn after 30 days of treatment (PDR III). While TV-29 showed highest PPO activity with B and Mn followed by K and Ca treatment, with increasing nutrient. Initial (PDR I) and final recovery (PDR III) study showed that TV-30, although show little increase PPO activity with Mn treatment (100 mM), but with increasing days of rehydration and micronutrient treatment higher PPO was maintained with B and K followed by Ca and Mn treatment (Figure 5(b)).
4. Discussion
Post stress recovery studies involving both only rehydration and rehydration with foliar spray of selected nutriaents were significant as summarized in Figure 6. RWC of leaves decreased in all the cultivars due to drought but after rehydration RWC gradually increased to pre-stress level. Maintenance of high RWC in drought resistant cultivars has also been reported to be an adaptation to water stress in several crop species [35]. In the present study the recovery of water stress was markedly and consistently improved by micronutrient application, particularly K and Ca. The osmotic effect of K and Ca was better in TV-1 and TV-30, which suggested the maintenance of water status better by these nutrients.
H2O2 and other active oxygen species OH, 1O2 and  may be responsible for lipid peroxidation and oxidative damage leading to disruption of metabolic function and loss of cellular integrity at sites where it accumulates [36]. In our study,
  , H2O2 and lipid peroxidation were found to be increased in all the stressed plants indicating loss of membrane function and induction of oxidative damage, where TV-1 and TV-30 showed comparatively least damage due to stress (data not shown). Better stress tolerance and recovery of TV-1 was also supported by comparatively minimum ROS level and lipid peroxidetion after rehydration. Among the tested nutrients, the significant role in reducing the ROS and oxidative damage was shown by K and Ca (see Figure 6) in all the tested clones. However, boron and Mn also showed significant role in few clones (for eg., TV-1, TV-30, etc). The role of K in alleviating detrimental effects of abiotic stresses in plants was observed by Cakmak [21]. Ca showed alleviations of negative effect of water stress in plants [15,37]. Calcium is known to be involved in oxidative stress signaling participating in linking H2O2 perception and induction of antioxidant genes in plants [16]. Calcium is a player in most cellular signalling processes [17] and interacts strongly with ROS [18]. Dry mass of leaves was found to have decreased with increasing stress, suggesting photosynthetic arrest in almost all the tested clones, but it was not able to induce permanent damage to the photosynthetic system. After rehydration, growth resumed in the affected plants and photosynthetic activity started. Maximum dry matter accumulation was observed in TV-1 treated with Mn and K. Manganese participates in the photolysis of water in pigment system II during photosynthesis and thus it helps in the electron transport from water to chlorophyll [38]. Proline accumulation in response to water deficit stress was reported in wheat [39,40] and in tea [41]. Proline acts as an osmoprotectant and greater accumulation of proline in TV- 1 suggested genotypic tolerance of tea to water deficit stress as proline accumulation helps in maintaining water relations, prevents membrane distortion and acts as a hydroxyl radical scavenger [42,43]. Proline content in the recovering plants was found to have increased with the nutrient treatment in all the clones being maximum in Ca treated plants except, TV-20, which show highest proline content with boron treatment. It indicates that boron might play some role in proline and other osmolyte biosynthesis in plants, which needs to be analyzed. However, the effect of boron on water use efficiency in plants has been reported [12]. Calcium is known to ameliorate the water stress by maintaining higher level of calcium-protein calmodulin complex which modulates the enzyme proline oxidase and osmotically active compounds like proline in plants during their early growth [44].
Decrease in total phenolic contents in tea cultivars in response to water stress with simultaneous decrease in glutathione and ascorbate content suggested the inability of tea seedlings to overcome a drought induced oxidative damage as reported in other plants [45]. In the present study, after rehydration, the recovering plants showed increase in phenolic content with the tested micronutrient, K and Ca being most effective in almost all the cultivars. K increased the contents of free amino acid and caffeine of various tea types. The contents of polyphenols, theaflvins and thearubigins in black tea were found to have increased and there are reports of improved quality components of different types of tea with K application [46]. The effects of potassium on drought resistance of plants have also been reported earliar [47]. Controversial studies on the role of calcium in relation to phenolic compound metabolism and related enzymes have been reported. Some suggesting Ca augmented the soluble POD
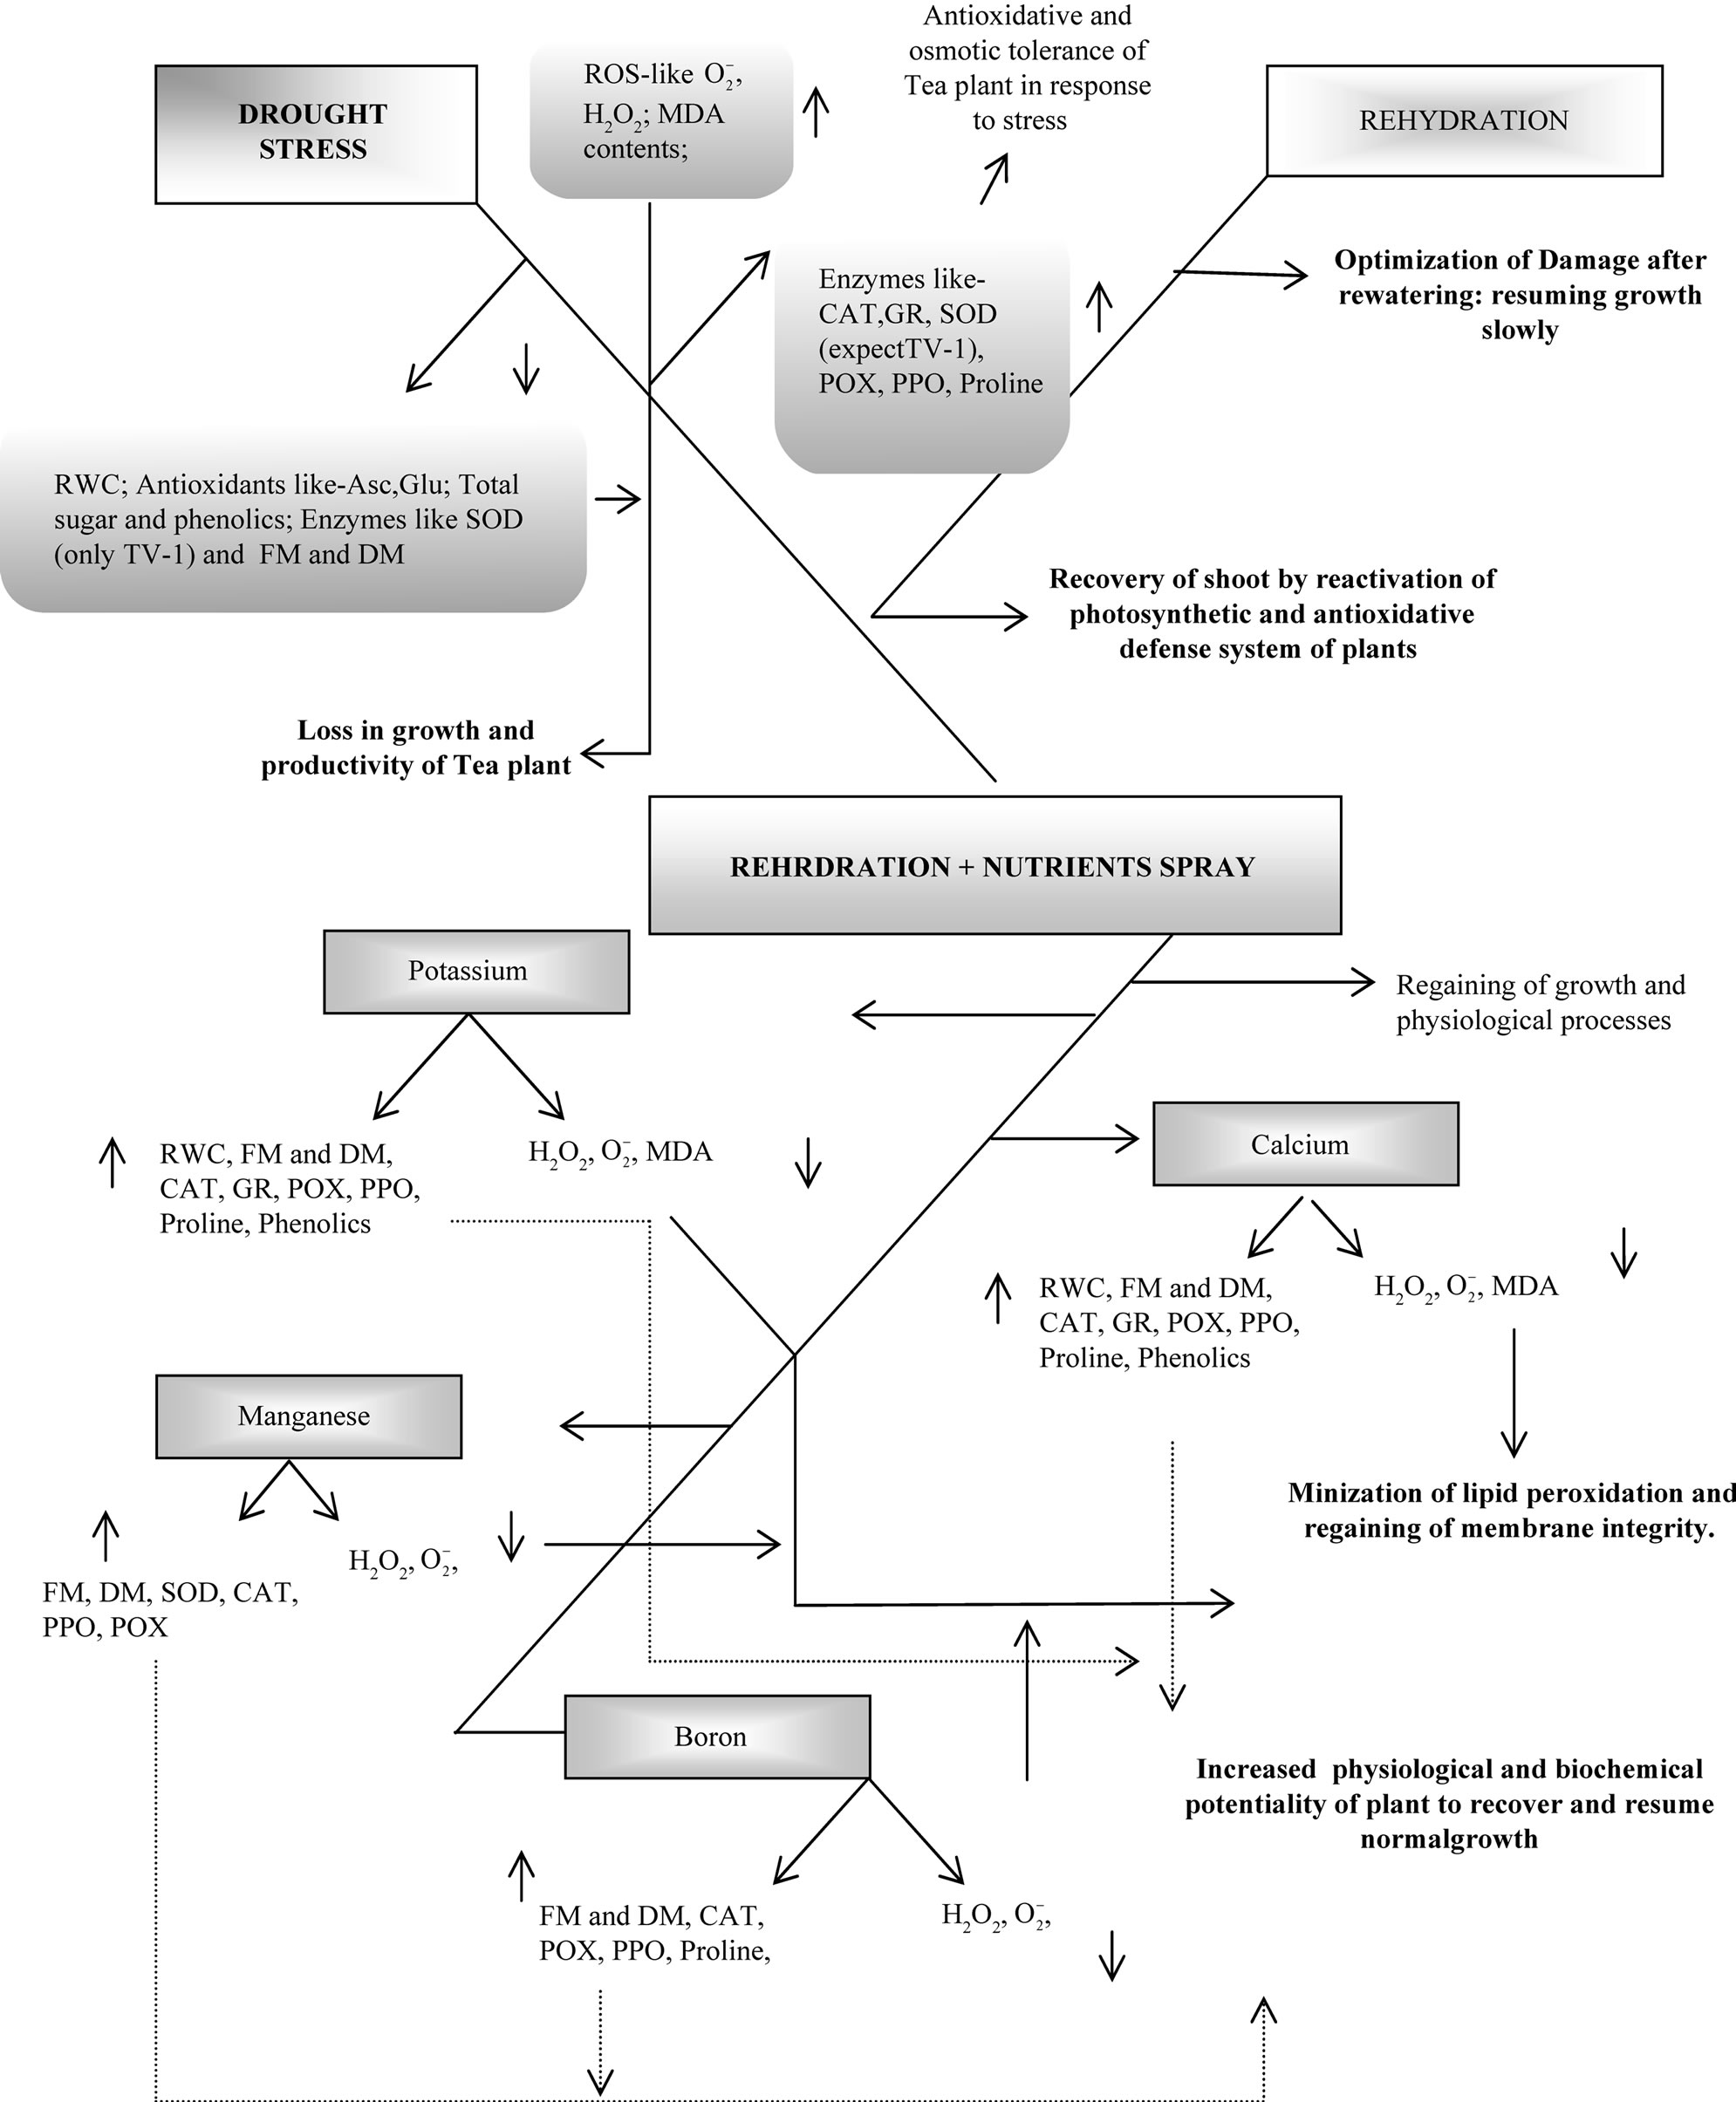
Figure 6. Model summarizing the effects of drought stress and subsequent rehydration on various physiological and biochemical parameters affecting the growth and productivity of Camellia sinensis. The effects of potassium, calcium, manganese and boron on biochemical processes of plant during rehydration recovery process is indicated above. Up-headed and down-headed arrow indicates increase and decrease respectively. RWC: relative water contents; FM: leaf fresh mass; DM: leaf dry mass; : superoxide anion; H2O2: total peroxide; MDA: malonyaldehyde; CAT: catalase; SOD: superoxide dismutase; POX: peroxidase; PPO: polyphenol oxidase.
and PAL activities accumulating [48] or reducing the phenolic compounds [49,50]. Increased total phenolic content during the stress recovery in tea plant as a result of calcium treatment improved not only the antioxidant potential by influencing biosynthesis of phenolics but also helped in maintaining the health quality of tea, as the most abundant phenolics present in tea are catechins which are potent contributors of many beneficial health properties of tea [51]. The effect of boron treatment showed a minimum increase in phenolic contents at low concentration. This is in agreement with the fact that, boron deficit plant accumulates phenolic compounds like, cafeic acid chlorogenic acid etc, suggesting the regulation of pentose shunt catabolic pathway by complexing phenolic compounds [52]. Such regulation of phenolic metabolism is essential as the high level of the total phenolic contents in plant is a critical stage in the initiation of impairment in several cellular functions. Since these phenolics can be oxidized to derivatives such as quinones, they have a higher potential to produce toxic oxygen species [53]. However, recently plants phenolic metabolites are also reported to function as free radical scavengers and mutagenesis inhibitors [54]. In case of tea, different catechins are the important phenolic compounds contributing to free radical protection and anti mutagenesis property of the plants.
Water stress disrupts the non-enzymic antioxidant system in plants and consequently a decrease in ascorbate content was reported with a maximum in TV-1 and minimum in TV-30. But, the post drought recovery (PDR) study with micronutrient treatment showed a rapid recovery in TV-1 owing to highest ascorbate content. Ascorbate is an abundant small molecule in plants which is a key substance in the network of antioxidants that include ascorbate, glutathione, a-tocopherol, and a series of antioxidant enzymes. Ascorbate has also been shown to play multiple roles in plant growth, such as in cell division, cell wall expansion, and other developmental processes. However, minimum decrease in glutathione content in response to water stress was also reported earlier in TV-1, but it maintained highest glutathione content during the recovery process. Glutathione is widely used as a marker of oxidative stress to plants, although its role in plant metabolism is a multifaceted one. As it is a nonprotein sulphur-containing tripeptide, glutathione acts as a storage and transport form of reduced sulphur. Glutathione is related to the sequestration of xenobiotics and heavy metal and is also an essential component of the cellular antioxidative defence system, which keeps reactive oxygen species (ROS) under control. Antioxidative defence and redox reactions play a central role in the acclimatization of plants to their environment, which made glutathione a suitable candidate as a stress marker. The role of calcium and potassium in enhancing the nonenzymic antioxidant function may be attributed to their water stress amelioration effect. Thus these nutrients not only help in drought tolerance in woody plants [47] but also improve post stress recovery potential of woody plants by altering the non-enzymic antioxidants in plants.
Increase in SOD activities in stressed plants were the indicative of enhanced  production [55] but increase in SOD activities after rehydration during recovery period could be an adaptation to improve growth after rehydration. However, decrease in SOD activities after rehydration in tea clones have been reported earlier [1]. Decrease in SOD with increasing days of rehydration and micronutrient spray in few tested clones could be due to the decrease in
  generations. In this study, CAT appeared to be an important enzyme in overcoming drought stress imposed oxidative stress as there was an increase in CAT activities in stressed plants (data not shown). The ability of tea clones to enhance CAT activities with increasing stress indicates that this enzyme could be the first line of defense during the drought adaptation process. After rehydration and micronutrient treatment maximum CAT activities was observed with K and Ca treatments suggesting improved photosynthetic rate induced by these nutrients. As tea is a C3 plant, higher CAT activity could scavenge the hydrogen peroxide formed in the photorespiratory pathway and thereby can reduced photorespiration rate [56].
Increased GR activity in stressed plant facilitates improved stress tolerance and it has the ability to alter the redox poise of important component of the electron transport chain. Glutathione is maintained in a reduced state by GR. Increase in GR activities do not influence the glutathione content, so that it seems likely that GSH content may be mere dependent on the relations of their synthesis, export and degradation of glutathione itself then by recycling of GSSG via GR activity [57]. However, lower GR activity after dehydration could be due to tendency of the plants to acclimatize [58]. The enhancement of GR activity by various micronutrient with differential responses to various clones may be to offer better antioxidative protection to recovering plant. Boron induced reduction in phytotoxicity during stress by stimulating leaf biosynthesis of glutathione and increase in its concentration in the roots has been reported very recently [14]. In this study, similar observations were made where boron treatment during the recovery, induced maximum increase in glutathione content in some clones (for eg., TV-1, etc.), which could not be merely due to stimulation of its biosynthesis but might be due to regulation of GR activities in leaf maintaining regeneration of glutathione through active ascorbate-glutathione cycle.
Increase in POX and PPO activities in almost all the stressed clones could be an acclimatization step against the stress. The role of POX in oxidation of tea catechins to form theaflavin type compounds in presence of H2O2 has also been reported earliar [59]. PPO plays important role in the production of theaflavins in tea. On rehydration increase in POX and PPO activities were enhanced by micronutrient spray, with differential response pertaining to different micronutrients used. Maximum POX and PPO activities were observed in response to K and Ca treatment. Increased content of polyphenols, thearubigins and theaflavins in black tea by potassium application has also been reported. K is also known to improve flavour compounds in tea [46]. Calcium is known to regulate different metabolism in plant mediating signalling pathways that modulate gene expression in response to stress and its adaptation. However, adequate information relating to the mechanism involving role of POX and PPO during post stress recovery in plant is lacking.
5. Conclusion
In conclusion, decrease in non-enzymic antioxidant with differential response of enzymic antioxidant due to drought stress in various clones of Camellia sinensis could not induce permanent oxidative damage. But rehydration recovery with various micro and macro nutrient treatment, showed differential response in activating and enhancing the coordinated antioxidant defense system in plant to recover and resume growth after rehydration. Comparatively lower ROS level, higher recovery of antioxidant property in response to nutrient treatments in TV-1 and TV-30 suggested their better recovery potential. Increase in SOD activity due to foliar spray of nutrient was also comparatively higher in both these clones. Moreover, higher increase in ascorbate content due to nutrients spray in TV-1 and TV-30 might help to lower lipid peroxidation improving their stress recovery potential. The present study reveals that the tested nutrients (K, Ca, Mn & B) showed some positive response in influencing growth and antioxidative responses during post drought recovery process, where K and Ca showed comparatively better effect in improving post drought recovery potential in tea plant. However, the interactive effect of nutrients among various clones needs to be tested.
6. Acknowledgements
The authors thank Mr. S. M. Bhati, General Manager, Tocklai Tea Estate, Silcoorie, Silchar for providing Tea seedlings throughout the experimental work.
REFERENCES
- H. Upadhyaya and S. K. Panda, “Responses of Camellia sinensis to Drought and Rehydration,” Biologia Plantarum, Vol. 48, No. 4, 2004, pp. 597-600. doi:10.1023/B:BIOP.0000047158.53482.37
- C. A. Jaleel, P. Manivannan, A. Kishorekumar, B. Sankar, R. Gopi, R. Somasundaram and R. Panneerselvam, “Alterations in Osmoregulation, Antioxidant Enzymes and Indole Alkaloid Levels in Catharanthus roseus Exposed to Water Deficit,” Colloids Surface. B: Biointerfaces, Vol. 59, No. 2, 2007, pp. 150-157. doi:10.1016/j.colsurfb.2007.05.001
- L. Vomacka and J. Pospisilava, “Rehydration of Sugar Beet Plants after Water Stress: Effect of Cytokinins,” Biologia Plantarum, Vol. 46, No. 1, 2003, pp. 57-62. doi:10.1023/A:1022306032416
- C. D. Foy, B. J. Scott and J. A. Fisher, “Genetic Differences in Plant Tolerance to Manganese Toxicity,” In: R. D. Graham, R. J. Hannam and N. C. Uren, Eds., Manganese in Soils and Plant, Kluwer Academic Publishers, Dordrecht, 1988, pp. 293-307. doi:10.1007/978-94-009-2817-6_20
- F. C. Lidon and F. S. Henriques, “Effects of Excess Copper on Photosynthetic Pigments in Rice Plants,” Botanical Bulletin of Academic Sinica, Vol. 33, 1992, pp. 141- 149.
- C. F. Lidon, G. M. Barreiroc and C. J. Ramalho, “Manganese Accumulation in Rice: Implications for Photosynthetic Functioning,” Journal of Plant Physiology, Vol. 161, No. 11, 2004, pp. 1235-1244. doi:10.1016/j.jplph.2004.02.003
- P. E. Pfeffer, S. I. Tu, W. V. Gerasimowicz and J. R. Cavanaughk, “In Vivo 31PNMR Studies of Corn Root Tissue and Its Uptake of Toxic Metals,” Plant Physiology, Vol. 80, 1986, pp. 77-84. doi:10.1104/pp.80.1.77
- R. L. Houtz, R. O. Nable and G. M. Cheniae, “Evidence for Effects on the in Vivo Activity of Ribulose-Bisphosphate Carboxylase/Oxygenase during Development of Mn Toxicity in Tobacco,” Plant Physiology, Vol. 86, No. 4, 1988, pp. 1143-1149. doi:10.1104/pp.86.4.1143
- P. J. Ness and H. W. Woolhouse, “RNA Synthesis in Phaseolus Chloroplasts. Ribonucleic Acid Synthesis and Senescing Leaves,” Journal Experimental Botany, Vol. 31, No. 1, 1980, pp. 223-233. doi:10.1093/jxb/31.1.223
- M. Shenker, E. Plessner Ora and E. Tel-Or, “Manganese Nutrition Effects on Tomato Growth, Chlorophyll Concentration, and Superoxide Dismutase Activity,” Journal of Plant Physiology, Vol. 161, No. 2, 2004, pp. 197-202. doi:10.1078/0176-1617-00931
- J. J. Camacho-Cristobal, L. Lunarb, F. Lafontc, A. Baumertd and A. Gonz!alez-Fontesa, “Boron Deficiency Causes Accumulation of Chlorogenic Acid and Caffeoyl Polyamine Conjugates in Tobacco Leaves,” Journal of Plant Physiology, Vol. 161, No. 7, 2004, pp. 879-881. doi:10.1016/j.jplph.2003.12.003
- A. Ben-Gal and U. Shani, “Water Use and Yield of Tomatoes under Limited Water and Excess Boron,” Plant and Soil, Vol. 256, No. 1, 2003, pp. 179-186. doi:10.1023/A:1026229612263
- C. J. Li, H. Pfeffer, F. Dannel, V. Romheld and F. Bangerth, “Effects of Boron Starvation on Boron Compartmentation, and Possibly Hormone-Mediated Elongation Growth and Apical Dominance of Pea (Pisum sativum) Plants,” Physiologia Plantarum, Vol. 111, No. 2, 2001, pp. 212-219. doi:10.1034/j.1399-3054.2001.1110212.x
- J. M. Ruiz, R. M. Rivero and L. Romero, “Boron Increases Synthesis of Glutathione in Sunflower Plants Subjected to Aluminum Stress,” Plant and Soil, Vol. 279, No. 1-2, 2006, pp. 25-30. doi:10.1007/s11104-005-7931-4
- H. Nayyar and S. K. Kaushal, “Alleviation of Negative Effects of Water Stress in Two Contrasting Wheat Genotypes by Calcium and Absicic Acid,” Biologia Plantarum, Vol. 45, No. 1, 2002, pp. 65-70. doi:10.1023/A:1015132019686
- M. C. Rentel, and M. R. Knight, “Oxidative Stress-Induced Calcium Signaling in Arabidopsis,” Plant Physiology, Vol. 135, No. 3, 2004, pp. 1471-1479. doi:10.1104/pp.104.042663
- D. Sanders, J. Pelloux, C. Brownlee and J. F. Harper, “Calcium at the Crossroads of Signaling,” Plant Cell, Vol. 14, 2002, pp. S401-S417.
- N. H. Evans, M. R. McAinsh, A. M. Hetherington and M. R. Knight, “ROS Perception in Arabidopsis thaliana: The Ozoneinduced Calcium Response,” Plant Journal, Vol. 41, No. 4, 2005, pp. 615-626. doi:10.1111/j.1365-313X.2004.02325.x
- G. Noctor, “Metabolic Signalling in Defence and Stress: The Central Roles of Soluble Redox Couples,” Plant Cell and Environment, Vol. 29, No. 3, 2006, pp. 409-425. doi:10.1111/j.1365-3040.2005.01476.x
- N. Bouché, A. Yellin, W. A. Snedden and H. Fromm, “Plant Specific Calmodulin-Binding Proteins,” Annual Review of Plant Biology, Vol. 56, 2005,pp. 435-466. doi:10.1146/annurev.arplant.56.032604.144224
- I. Cakmak, “The Role of Potassium in Alleviating Detrimental Effects of Abiotic Stresses in Plants,” Proceedings of the IPI Golden Jubilee Congress, 8-10 October 2002, Basel, 2003, pp. 325-343.
- M. K. Ashley, M. Grant and A. Grabov, “Plant Responses to Potassium Deficiencies: A Role for Potassium Transport Proteins,” Journal of Experimental Botany, Vol. 57, No. 2, 2006, pp. 425-436. doi:10.1093/jxb/erj034
- H. D. Bars and P. E. Weatherly, “Are Examination of the Relative Turgidity Technique for Estimating Water Deficit in Leaves?” Australian Journal of Biological Science, Vol. 15, 1962, pp. 413-428.
- A. Mahadevan and R. Sridhar, “Methods in Physiological Plant Pathology,” 2nd Edition, Sivakami Publications, Madras, 1982.
- L .S. Bates, R. P. Waldern and I. K. Teare, “Rapid Determination of Free Proline for Water Stress Studies,” Plant and Soil. Vol. 39, No. 1, 1973, pp. 205-208. doi:10.1007/BF00018060
- O. W. Griffth, “Determination of Glutathione and Glutathione Disulfide Using Glutathione Reductase and 2- Vinylpyridine,” Annalytical Biochemistry, Vol. 106, 1980, pp. 207-211.
- B. L. Oser, “Hawks Physiological Chemistry,” McGraw Hill, New York, 1979, pp. 702-705.
- S. Sagisaka, “The Occurrence Of Peroxide in a Perennial Plant Populas gelrica,” Plant Physiology, Vol. 57, No. 2, 1976, pp. 308-309. doi:10.1104/pp.57.2.308
- R. L. Heath and L. Packer, “Photoperoxidation in Isolated Chlorplasts: I. Kinetics and Stoichiometry of Fatty Acid Peroxidation,” Archives Biochemistry Biophysics, Vol. 125, No. 1, 1968, pp. 189-198. doi:10.1016/0003-9861(68)90654-1
- E. F. Elstner and A. Heupal, “Inhibition of Nitrite Formation from Hydroxyl Ammonium Chloride: A Simple Assay for Superoxide Dismutase,” Analytical Biochemistry, Vol. 70, 1976, pp. 616-620. doi:10.1016/0003-2697(76)90488-7
- B. A. Chance and C. Maehly, “Assay of Catalase and Peroxidase,” Methods Enzymology, Vol. 2, 1995, pp. 764- 775. doi:10.1016/S0076-6879(55)02300-8
- M. Kar and D. Mishra, “Catalase, Peroxidase and Polyphenol Oxidase Activities during Rice Leaf Senescence,” Plant Physiology, Vol. 57, 1976, pp. 315-319. doi:10.1104/pp.57.2.315
- C. N. Giannopolitis and S. K. Ries, “Superoxide Dismutase I. Occurrence in Higher Plants,” Plant Physiology, Vol. 59, No. 2, 1977, pp. 309-314. doi:10.1104/pp.59.2.309
- I. K. Smith, T. L. Vierheller and C. A. Thorne, “Assay of Glutathione Reductase in Crude Tissue Homogenates Using 5,51-Dithiobis(2-Nitrobenzoic Acid),” Analytical Biochemistry, Vol. 175, No. 2, 1988, pp. 408-413. doi:10.1016/0003-2697(88)90564-7
- A. H. A. Farooqui, R. Kumar, S. Fatima and S. Sharma, “Responses of Different Genotypes of Lemon Grass (Cymbopogon flexuousus and C. pendulus) to Water Stress,” Journal of Plant Biology, Vol. 27, 2000, pp. 277- 282.
- C. H. Foyer, H. Lopez-Delgado, J. F. Dat and I. M. Scott, “Hydrogen Peroxide and Glutathione-Associated Mechanisms of Acclimatory Stress Tolerance and Signaling,” Physiologia Plantarum, Vol. 100, No. 2, 1997, pp. 241- 254. doi:10.1111/j.1399-3054.1997.tb04780.x
- C. A. Jaleel, P. Manivannan, A. Kishorekumar, B. Sankar, R. Gopi, R. Somasundaram and R. Panneerselvam, “Water Deficit Stress Mitigation by Calcium Chloride in Catharanthus roseus: Effects on Oxidative Stress, Praline Metabolism and Indole Alkaloid Accumulation,” Colloids Surface. B: Biointerfaces, Vol. 60, No. 1, 2007, pp. 110- 116. doi:10.1016/j.colsurfb.2007.06.006
- G. M. Cheniae and J. F. Martin, “Site of Function of Manganese within Photosystem II. Roles in O2 Evolution and System II,” Biochemistry and Biophysics Acta, Vol. 197, No. 2, 1970, pp. 219-239. doi:10.1016/0005-2728(70)90033-2
- S. Kathju, S. P. Vyas, B. K. Garg and A. N. Lahiri, “Fertility Induced Improvements in Performance and Metabolism of Wheat under Different Intensities of Water Stress,” Proceedings of the International Congress of Plant Physiology, New Delhi, 1988, pp. 854-858.
- J. Levitt, “Responses of Plants to Environmental Stress,” Vol. I, Academic Press, London, 1980.
- A. C. Handique and L. Manivel, “Selection Criteria for Drought Tolerance in Tea,” Assam Review of Tea News, Vol. 79, 1990, pp. 18-21.
- Y. Yoshiba, T. Kiyosue, K. Nakashima, K. Yamaguchi Shirozaki and K. Shinozaki, “Regulation of Level of Proline as an Osmolyte in Plant under Water Stress,” Plant Cell Physiology, Vol. 18, 1997, p. 1095.
- J. Matysik, B. B. Ali and P. Mohanty, “Molecular Mechanism of Quenching of Reactive Oxygen Species by Proline under Water Stress in Plants,” Current Science, Vol. 82, No. 5, 2002, pp. 525-532.
- Ch. Sulochana and N. Sanithramma, “Effect of Calcium in Amelioration of PEG (600) Induced Water Stress in Ground Nut (Araclus hypogaea L.) Cultivars during Seedling Growth,” Journal of Plant Biology, Vol. 28, 2001, pp. 257-263.
- L. A. Battle and S. Munne-Bosch, “Regulation of Plant Response to Drought. Function of Plant Hormones and Antioxidants,” In: A. Hemantaranjan, Ed., Advances in Plant Physiology, Scientific Publishers (India), Jodhpur, Vol. 5, 2003, pp. 267-285.
- R. Jianyun, W. Xun and R. Hardter, “Effect of Potassium and Magnesium Nutrition on the Quality Components of Different Types of Tea,” Journal of Science Food and Agriculture, Vol. 79, No. 1, 1999, pp. 47-52. doi:10.1002/(SICI)1097-0010(199901)79:1<47::AID-JSFA172>3.0.CO;2-A
- J. N. Egilla, F. T. Davies, M. C. Drew Jr., “Effect of Potassium on Drought Resistance of Hibiscus rosa-sinensis cv. Leprechaun: Plant Growth, Leaf Macroand Micronutrient Cont and Root Longevity,” Plant and Soil, Vol. 229, No. 2, 2001, pp. 213-224. doi:10.1023/A:1004883032383
- Y. E. Kolupaev, G. E. Akinina and A. V. Mokrousov, “Induction of Heat Tolerance in Wheat Coleoptiles by Calcium Ions and Its Relation to Oxidative Stress,” Russian Journal of Plant Physiology, Vol. 52, No. 2, 2005, pp. 199-204. doi:10.1007/s11183-005-0030-9
- J. M. Ruiz, R. M. Rivero, I. Lo´pez-Cantarero and L. Romero, “Role of Ca2+ in the Metabolism of Phenolic Compounds in Tobacco Leaves (Nicotiana tabaccum L.),” Plant Growth Regulation, Vol. 41, No. 2, 2003, pp. 73- 177. doi:10.1023/A:1027358423187
- A. F. Teixeira, A. de Bastos Andrade, O. Ferrarese-Filho and M. L. Lucio Ferrarese, “Role of Calcium on Phenolic Compounds and Enzymes Related to Lignification in Soybean (Glycine max L.) Root Growth,” Plant Growth Regulation, Vol. 49, No. 1, 2006, pp. 69-76.
- C. Cabrera, R. Artacho and R. Gimenez, “Beneficial Effect of Green Tea—A Review,” Journal of American College of Nutrition, Vol. 25, No. 2, 2006, pp. 79-99.
- W. M. Dugger, “Boron in Plant Metabolism,” In: A. Lauchli and K. L. Bieleski, Eds., Inorganic Plant Nutrition (Encyclopedia of Plant Physiology, New Series), Springer Verleg, Berlin, Vol. 15B, 1983, pp. 625-650.
- I. Cakmak and V. Romheld, “Boron Deficiency-Induced Impairments of Cellular Functions in Plants,” Plant and Soil, Vol. 193, No. 1-2, 1997, pp. 71-83. doi:10.1023/A:1004259808322
- A. Matkowski and D. Wolniak, “Plant Phenolic Metabolites as the Free Radical Scavenger and Mutagenesis Inhibitors,” BMC Plant Biology, Vol. 5, 2005, p. S23. doi:10.1186/1471-2229-5-23
- K. Asada and M. Takahashi, “Production and Scavenging of Active Oxygen in Photosynthesis,” In: D. J. Kyle, C. B. Osmond and C. J. Arntzen, Eds., Photoinhibition, Elsevier, Amsterdam, 1987, pp. 227-287.
- P. R. Jeyaramraya, R. K. Roy, P. K. Pius and J. Thomas, “Photoassimilatory and Photorespiratory Behaviour of Certain Drought Tolerant and Susceptible Tea Clones,” Photosynthetica, Vol. 41, No. 4, 2003, pp. 579-582. doi:10.1023/B:PHOT.0000027523.51145.a0
- C. Foyer, M. Lelandais, C. Galap and K. J. Kunert, “Effects of Elevated Cytosolic Glutathione Reductase Activity on the Cellular Glutathione Pool and Photosynthesis in Leaves under Normal and Stress Conditions,” Plant Physiology, Vol. 97, No. 3, 1991, pp. 863-872. doi:10.1104/pp.97.3.863
- B. Loggini, A. Scartazza, E. Brugusli and F. Navari-Izzo, “Antioxidant Defence System, Pigment Composition, and Photosynthetic Efficiency in Two Wheat Cultivars Subjected to Drought,” Plant Physiology, Vol. 119, No. 3, 1999, pp. 1091-1099. doi:10.1104/pp.119.3.1091
- S. Sang, S. C. Yang and C.-T. Ho, “Peroxidase Mediated Oxidation of Catechins,” Phytochemistry Review, Vol. 3, No. 1-2, 2004, pp. 229-241. doi:10.1023/B:PHYT.0000047794.45076.7c
NOTES
*Corresponding author.