Pharmacology & Pharmacy
Vol.4 No.3(2013), Article ID:32330,8 pages DOI:10.4236/pp.2013.43042
Effect of Cyclooxygenase-2 Blockade on Renal Hypertrophy Development during Early Diabetes Mellitus
![]()
1Laboratorio de Farmacología, Unidad de Investigación Interdisciplinaria en Ciencias de la Salud y la Educación, Facultad de Estudios Superiores Iztacala (FESI), Universidad Nacional Autónoma de México (UNAM), Tlalnepantla, México; 2Sección de Estudios de Posgrado e Investigación, Escuela Superior de Medicina, Instituto Politécnico Nacional, México DF, México; 3Unidad de Biomedicina, Facultad de Estudios Superiores Iztacala (FESI), Universidad Nacional Autónoma de México (UNAM), Tlalnepantla, México.
Email: *bvcruz@unam.mx
Copyright © 2013 Beatriz Vázquez-Cruz et al. This is an open access article distributed under the Creative Commons Attribution License, which permits unrestricted use, distribution, and reproduction in any medium, provided the original work is properly cited.
Received April 20th, 2013; revised May 18th, 2013; accepted May 26th, 2013
Keywords: COX-2; Prostaglandins; TGF-β; Diabetic Nephropathy; Renal Hypertrophy; Angiotensin II
ABSTRACT
Diabetes mellitus is the leading cause of diabetic nephropathy; the early phase of diabetes is associated with kidney growth and hyperfiltration; several factors modulate these changes, among them, prostaglandins and angiotensin II. Previous studies have shown that cyclooxygenase-2 is implicated in experimental models of diabetes. The aim of this work was to study the effect of celecoxib treatment on renal hypertrophy development in early diabetes mellitus. In our rats with early streptozotocin-induced diabetes there was renal hypertrophy, and increased renal expression of cyclooxygenase-2, AT1 receptor, and transforming growth factor-β1. Treatment with the selective cyclooxygenase-2 inhibitor celecoxib reduced the urinary excretion of prostaglandins such as prostaglandin E2, 6-keto prostaglandin F1α, and thromboxane B2. Kidney hypertrophy was reversed by the treatment, and the renal expression of cyclooxygenase-2, AT1 receptor, and transforming growth factor-β1 decreased. The renoprotective effects of celecoxib were independent of the changes in plasma glucose levels. These results confirm that cyclooxygenase-2 inhibition in rats with streptozotocin-induced diabetes decrease renal hypertrophy; this effect in turn, may be mediated by reduction of the expression of AT1 receptors and transforming growth factor-b1 in the kidney.
1. Introduction
Diabetes mellitus (DM) is a chronic disease caused by an absolute or relative deficiency in insulin production by the pancreas and with or without resistance to insulin [1, 2]. The insulin deficiency increases the blood concentration of glucose and other metabolites, which in turn produce macrovascular complications, including coronary artery disease, atherosclerosis and peripheral vascular disease; and microvascular complications as retinopathy, nephropathy, and neuropathy. Severity and duration of hyperglycemia are the main risks responsible of these vascular complications [3]. Specifically, vascular and parenchymal damage of the kidneys lead to diabetic nephropathy, which is the first cause of end-stage renal disease requiring dialysis. Several morphologic, metabolic and hemodynamic changes have been involved in the development of this pathologic condition, and among them, increased kidney size and elevated glomerular filtration rate (GFR) seem to be some of the most relevant [4]. These alterations start before any measurable clinical changes, and are characterized by tubular and glomerular hypertrophy, thickening of glomerular basement membrane and progressive glomerular accumulation of extracellular matrix components. The increase in GFR results in glomerular hyperfiltration and is the central tenant for eventual glomerular damage and later down stream complications [4,5].
Relationships between these glomerular hemodynamic alterations and growth processes are intimately interwoven; the resultant increase in the filtration coefficient conduces to enhanced glomerular filtration [6,7]. It has been shown [7] that after diabetes induction in animals, the proximal tubules develop hypertrophy, and as a resultsolutes absorption is increased, generating the hemodynamic changes, i.e., increase of renal plasmatic flow and increase of capillary pressure, in turn caused by a relative reduction of the preglomerular resistance versus the postglomerular resistance, generating renal hyperfiltration [7,8], facilitating albumin leakage from the glomerular capillaries and overproduction of mesangial cell matrix, as well as thickening of the glomerular basement membrane, and injury to podocytes [9]. The cause of the hypertrophy is, however, not well understood. Many factors associated with early diabetes have been reported to be involved, including prostanoids, nitric oxide, vascular endothelial growth factor A (VEGF-A), transforming growth factor-beta 1 (TGF-β1), and the renin-angiotensin system (RAAS), specifically angiotensin II (Ang II). In addition, increased mechanical strain resulting from these hemodynamic changes can induce localized release of certain cytokines and growth factors [10-12].
In the normal mammalian kidney, prostaglandins (PGs) are important mediators of vascular tone, hemodynamic regulation, and salt and water homeostasis [13]. However, an increase in PGs has been observed in experimental diabetes [14,15]. PGs participation in some of the hemodynamic changes caused by DM has been well documented, especially for those PGs produced by the inducible isoform cyclooxygenase-2 (COX-2). COX-2 expression is enhanced by hyperglycemia [16,17], and it has been linked to hyperfiltration and the renal structural changes preceding the development of diabetic nephropathy. Increased secretion of prostacyclin (PGI2) and prostaglandin E2 (PGE2) at the initial DM stage followed by augmented production of prostaglandin F2α (PGF2α) and thromboxane A2 (TXA2) in end-stage renal disease, have been demonstrated [18,19]. Studies in isolated perfused kidneys from diabetic rats have shown that the administration of inhibitors that prevent the upregulation of renal COX-2 reduces the exaggerated renal release of PGs in response to arachidonic acid, suggesting that increased COX-2 expression/activity contributes to the enhanced PGs production [19,20]. COX-2 is considered an inducible enzyme and it is upregulated in inflammatory conditions; however, it is also constitutively expressed at specific sites in the kidney and vasculature and there is evidence that COX-2 is the enzyme responsible for vascular prostacyclin synthesis [17]. COX-2 inhibition has been shown to attenuate the development of glomerulosclerosis in uninephrectomized diabetic rats and to reduce the appearance of renal damage markers in a hypertensive rat model. Thus the inhibition of COX-2 as a protective strategy against the development of nephropathy has been studied in models of diabetes without superimposed hypertension.
On the other hand, the renin-angiotensin-aldosterone system (RAAS) has been related not only to blood volume or hydro-electrolytic managing changes during DM, but also to hypertrophic changes in diverse organs. Evidence suggested that Ang II is synthesized within the kidney and is a mediator of progressive injury in diabetic nephropathy. The beneficial effect produced by AT1 receptor blockers and angiotensin converting enzyme (ACE) inhibitors in the hypertrophic changes of cardiovascular remodeling induced by hypertension and DM is widely recognized [21-23].
There may be other intrarenal interactions of PGs and the RAAS. By instance, in the macula densa region, COX-2 expression is increased in high renin states produced by salt restriction, ACE inhibition, and renovascular hypertension. Selective COX-2 inhibitors decrease plasma renin levels, renal renin activity and mRNA expression [24,25], suggesting that COX-2 may participate in the regulation of the RAAS.
The effect of COX-2 inhibition on DM-induced renal hypertrophy has not been completely understood; therefore, the aim of this work is to study the effect of celecoxib treatment on renal hypertrophy development in early DM, and to evaluate the effect of COX-2 blockade on the renal expression of the AT1 receptor and TGF-β1 in this model.
2. Materials and Methods
2.1. Animals and Treatment
Male Wistar rats with initial body weights of 250 ± 20 g were used in this study. The animals had free access to standard rat chow (Rodent Laboratory Chow 5001, Ralston Purina Richmond Indiana, USA) and tap water, and were exposed to a 12:12 h light-dark cycle throughout the experiment. DM was induced by a single intraperitoneal injection of streptozotocin (STZ), 65 mg/Kg, in 10 mM sodium citrate buffer, pH 4.5. Only animals with documented hyperglycemia and glucosuria 48 h after injection were classified as diabetic and were included in further experiments. Control rats were injected with vehicle (10 mM sodium citrate buffer, pH 4.5) alone. Blood glucose concentration was determined in tail blood samples using a reflectance meter (One Touch; LifeScan, Milpitas, CA, USA). Only animals with blood glucose levels > 300 mg/dL were utilized in the study.
Rats were randomized into three groups: Non-diabetic, control group (C); Diabetic rats (D); a group of diabetic rats was treated with celecoxib (a specific COX-2 inhibitor), 10 mg/Kg, po, in drinking water (DCe), control rats received vehicle. Each group consisted of six rats. Treatment with celecoxib was started two days after STZ administration, when hyperglycemia was confirmed and it was given during the 7 days of the experiment.
Two days before STZ injection and two days before the end of the experiment, animals were placed in metabolic cages to measure water consumption, urinary volume, and to obtain urine samples to determine proteins and PGs.
At the end of the study, the rats were anesthetized with sodium pentobarbital (60 mg/Kg, ip), blood samples were drawn to determine blood glucose, and the kidneys were quickly removed. Left kidney was decapsulated and weighted. Afterwards, it was dissected into cortex and medulla for immunoblot and total DNA extraction. Right kidney was cannulated, and fixed with 4% formaldehyde.
All procedures and protocols were in accordance with the Mexican Federal Regulations for Animals Investigation and Care (NOM-062 ZOO-1969, Ministry of Agriculture, Mexico) on the care and the use of laboratory animals, and approved by the institutional ethics review board.
2.2. Measurement of Renal Hypertrophy
Right kidneys were cannulated, and kept in phosphatebuffered 4% formaldehyde. Fixed kidneys were dehydrated through ethanol graded series, embedded in paraffin, sectioned in 4 μm thickness, mounted on glass slides and stained with hematoxylin-eosin. Proximal tubule cells were visualized using an optic microscope (Motic) and the cell area was measured using a computer program (Motic Images); 100 cells per field were counted and 10 fields per slide were analyzed and averaged (Figure 1). A kidney hypertrophy index, (kidney weight/rat body weight ratio expressed in g/100g) was used. Finally, we extracted and quantified total DNA from cortex tissue by Trizol reagent method (Invitrogen), and obtained the protein/DNA ratio as an index of relative hypertrophy.
2.3. Analytical Methods
Urine was collected from metabolic cages in volumetric tubes for 24 h. Samples were immediately frozen and stored at –80˚C for measurement of proteins and PGs. Protein concentration measurement in urine was assayed using the Bradford method. PGE2, TXB2 and 6-keto-
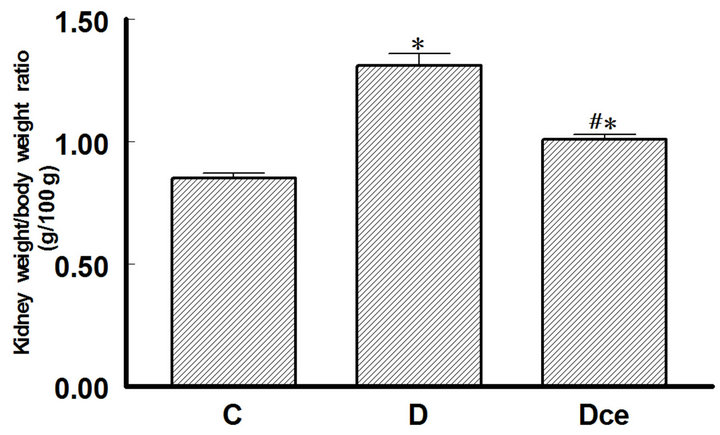
Figure 1. Kidney weight/body weight ratio (g/100g) from diabetic rats 7 days after streptozotocin administration. Control rats (C), diabetic rats (D), and diabetic rats treated with celecoxib (DCe). Values are expressed as mean ± SEM. *p < 0.05 vs control rats; #p < 0.05 vs diabetic rats.
PGF1a were analyzed from two different urine dilutions using enzyme immunoassay (EIA, Cayman Chemical, Ann Arbor, MO, USA) following the manufacturer’s instructions, concentrations were normalized to 24 h excretion.
2.4. Immunobloting
Renal tissue was homogenized in 100 mM Tris (hydroxymethyl-aminomethane-tris-hydrochloride, Sigma, St Louis, MO, USA), pH 7.4, added with a protease- inhibitor cocktail (Mini Complete EDTA-free protease inhibitor cocktail, Roche, Germany), followed by centrifugation at 10,000 g for ten min to remove insoluble debris. The protein concentration of the supernatant was quantified using the Bradford method. 50 μg of protein were loaded into a 10% SDS-PAGE mini-gel under reducing conditions and transferred to PVDF membranes (Amersham Hybond-ECL, GE Health Care, Buckinghamshire, UK). The membranes were blocked with 5% non-fat milk in tris buffered saline (pH 7.6) containing 0.05% Tween 20 (TBST) for two hours at room temperature. Membranes were incubated overnight at 4˚C with a 1:400 dilution of a rabbit polyclonal antibody to COX-2, AT1 receptor and TGF-β1 respectively (Santa Cruz Biotechnology Inc., Santa Cruz, California, USA). After incubation with the primary antibody, the membranes were washed with TBST buffer and incubated with a 1:10,000 dilution of horseradish-peroxidase-labeled goat anti rabbit IgG secondary antibody (Zymed, Invitrogen, USA) at room temperature for two hours. Visualization was performed with an enhanced chemiluminiscence (ECL) western blotting kit (Luminol, Santa Cruz Biotechnology Inc., Santa Cruz, California, USA). Films obtained were scanned and digitalized using a flatbed scanner. Band intensity was measured by computer analysis using Quantity One 1-D Image Analysis Software (Bio-Rad, Hercules, CA, USA). All membranes were stripped, re-blocked and incubated with goat β-actin antibody (Santa Cruz Biotechnology Inc., Santa Cruz, California, USA) used as housekeeping protein with the same protocol.
2.5. Statistical Analyses
All values are presented as mean ± SEM., and compared using an unpaired t-test or ANOVA followed by Newman-Keuls test. A p < 0.05 was considered statistically significant.
3. Results
3.1. Glycemia
Glycemia levels were measured before STZ injection and at the end of the experiment (seven days). Blood glucose levels were in the ranges expected for each group during the study, the control group was (C) 91.0 ± 8 mg/dL and the groups with STZ injection (D) and treatment with celecoxib (DCe) were 332 ± 25 mg/dL, 325 ± 30 mg/dL respectively as shown in Table 1. In the diabetic group body weight was smaller than in the control group, the others parameters as food and water consumption and urinary volume were increased in the diabetic groups. Treatment with celecoxib did not modify significantly these parameters (Table 1).
3.2. Renal Hypertrophy
Kidney weight in diabetic rats increased significantly as compared to the control group (1.31 ± 0.05 g vs 0.85 ± 0.02 g), treatment with celecoxib reverted this increment in the diabetic group (1.01 ± 0.02 g). The kidney weight/body weight ratio is shown in Figure 1. In kidneys sections stained with hematoxilin-eosin, the proximal tubules were visualized and their cell areas measured.
Cellular area for control group (C) was 88.46 ± 11.32 μ2, for the diabetic group (D) 116.98 ± 8.08 μ2 and or the diabetic + celecoxib group (DCe) 90.99 ± 11.23 μ2 (Figure 2). Protein/DNA ratio for control group (C) was 0.65 ± 0.3, for diabetic group (D) 2.08 ± 0.45 and for DCe group 0.7 ± 0.3 (Figure 3).
3.3. Proteinuria
Urine protein excretion increased in the diabetic rats group (42.5 ± 5.3 mg/24h vs 14.6 ± 2.6 mg/24h from control group), celecoxib administration did not reverse this change (Figure 4).
3.4. Urinary Excretion of Prostanoids
The excretion rates for PGE2, 6-ketoPGF1α and TXB2 increased in the diabetic rats group as compared with control rats. Thus, urinary PGE2 excretion was increased more than five fold (C group 60 ± 10 ng/24h vs 301 ± 68
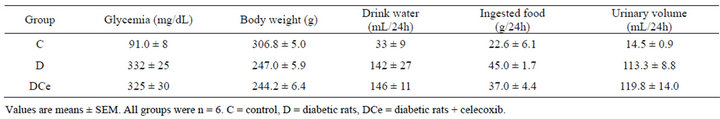
Table 1. Changes in plasma glucose, body weight, drink water volume, ingested food, and urinary volume of rats seven days after streptozotocin (STZ) injection or vehicle for control group.
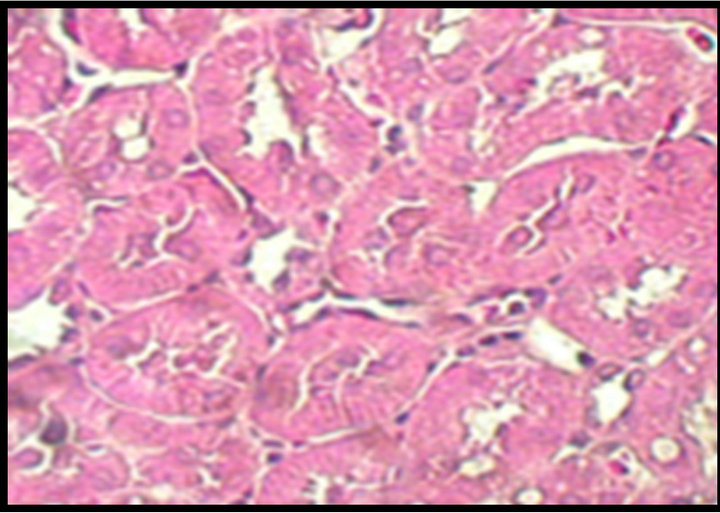
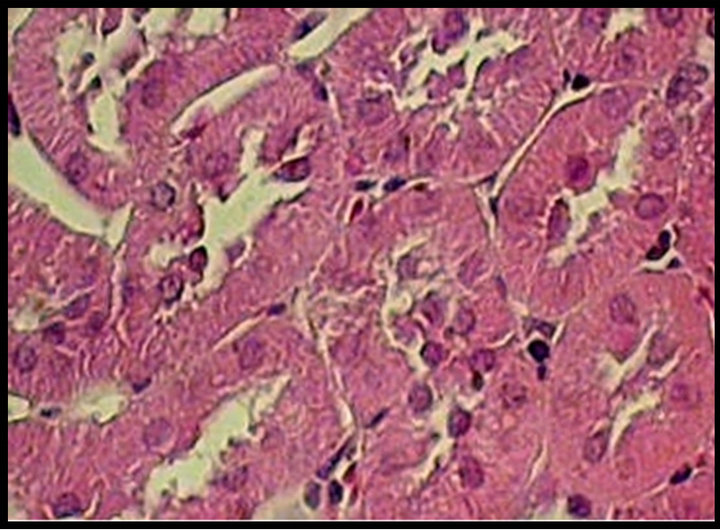
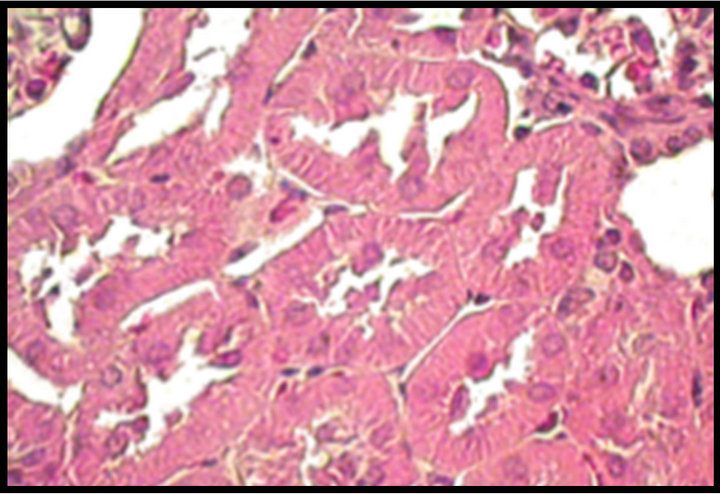
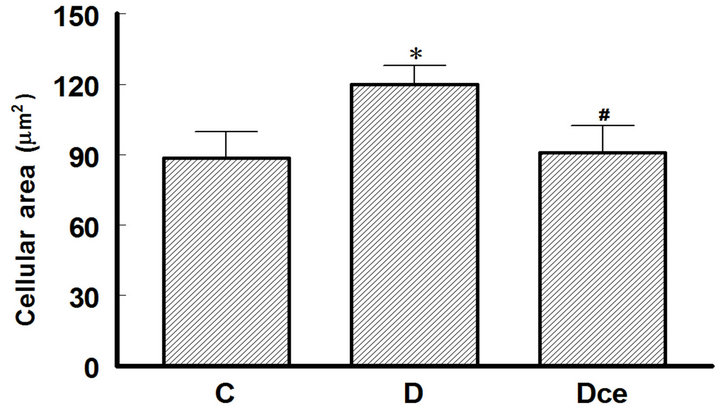
Figure 2. Upper panel: hematoxylin-eosin-stained kidney sections, original magnification 40×. Normal tubules from a control (C) rat. Hypertrophied tubular cells from a diabetic (D) rat. Kidney section from a diabetic rat treated with celecoxib (DCe); the tubular cells showed less hypertrophy but did not reach normal size. Lower panel: area of proximal tubular cells from kidneys of diabetic rats 7 days after streptozotocin administration. Control rats (C), diabetic rats (D), and diabetic rats treated with celecoxib (DCe). Values are expressed as mean ± SEM. *p < 0.05 vs control rats; #p < 0.05 vs diabetic rats.
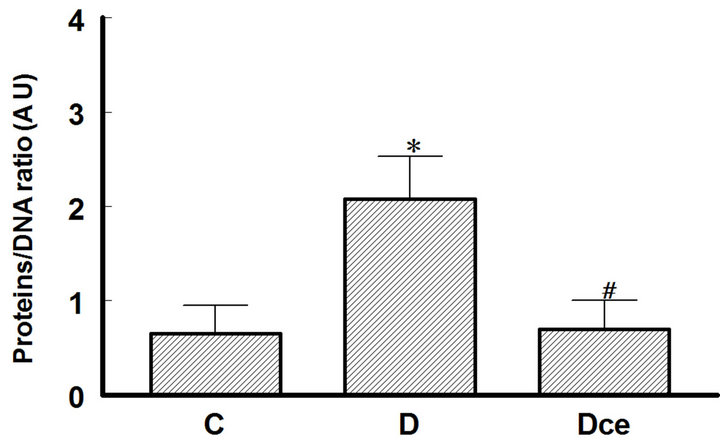
Figure 3. Proteins/DNA ratio from kidneys of diabetic rats as an index of renal hypertrophy, 7 days after streptozotocin administration. Control rats (C), diabetic rats (D), and diabetic rats treated with celecoxib (DCe). Values are expressed as mean ± SEM. *p < 0.05 vs control rats; #p < 0.05 vs diabetic rats.
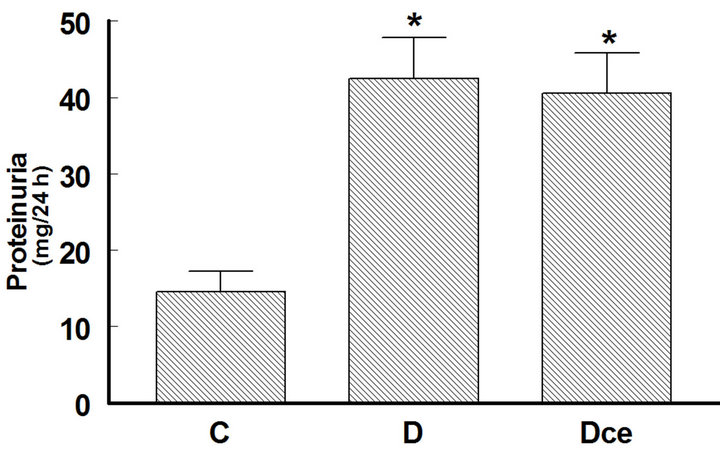
Figure 4. Changes in proteinuria from diabetic rats 7 days after streptozotocin administration. Control rats (C), diabetic rats (D), and diabetic rats treated with celecoxib (DCe). Values are expressed as mean ± SEM. *p < 0.05 vs control rats; #p < 0.05 vs diabetic rats.
ng/24h in the D group), PGI2 was quantified as its stable metabolite 6-ketoPGF1α, which increased in D group (60 ± 8.33 ng/24h) as compared to C group (35 ± 4.16 ng/24h), and TXB2 more than tenfold (1.59 ± 0.59 ng/24h in C group vs 15.9 ± 2.27 ng/24h in the D group). In rats treated with the COX-2 inhibitor celecoxib, PGE2 excretion was not different from that of the control group, whereas 6-ketoPGF1α excretion was reduced to 33.3 ± 1.66 ng/24h, similar to controls (Figure 5).
3.5. Immunoblot
We also determined COX-2 protein expression in cortex homogenates. The results of western blot analysis for the expression of COX-2, AT1 receptor and TGF-β1 were standardized against the expression of β-actin, in control, diabetic, and celecoxib-treated diabetic rat kidneys. In the DM group, renal COX-2 expression increased by more than five-fold, the AT1 receptor expression also increased by two-fold and the renal TGF-β1 expression increased by more than fifty-fold. Celecoxib treatment of the diabetic rats group for 7 days diminished the expression of COX-2, AT1 receptor and TGF-β1 in the kidney
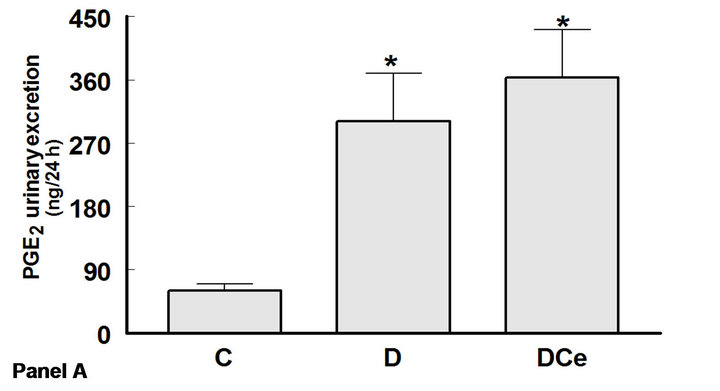
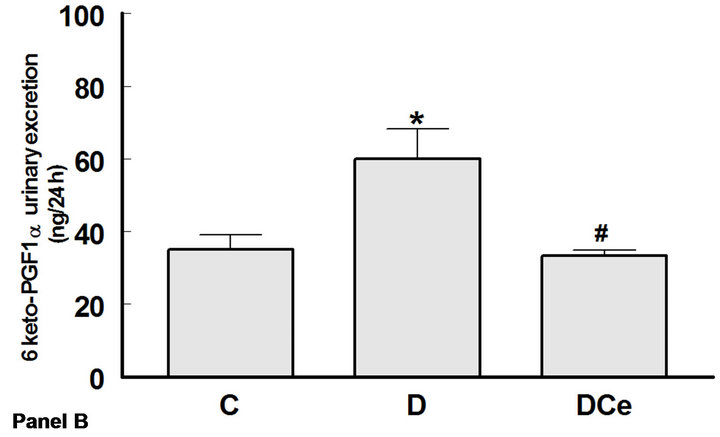
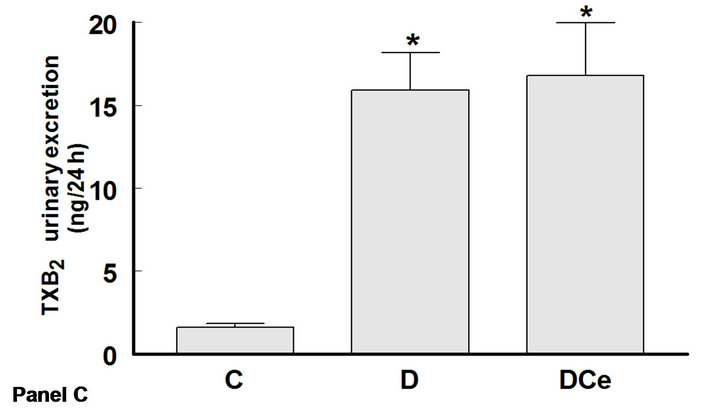
Figure 5. Changes in urinary excretion of PGE2 (panel A), 6-Keto-PGF1α (panel B) and TXB2 (panel C) from diabetic rats 7 days after streptozotocin administration. Control rats (C), diabetic rats (D) and diabetic rats treated with, celecoxib (DCe). Values are expressed as mean ± SEM. *p < 0.05 vs control rats; #p < 0.05 vs diabetic rats.
(Figures 6-8).
4. Discussion
Our results show that STZ-induced DM is associated with increased COX-2 renal expression and increased PGs urinary excretion. These changes are possible contributors to the observed renal hypertrophy. On the other hand, renal hypertrophy may also be related to the increased renal expression of the AT1 receptor and TGF-β1. Treatment of diabetic rats with a highly selective COX-2 inhibitor such as celecoxib for 7 days, beginning 48 hours after STZ administration, reduced the renal expression of COX-2 and urinary excretion of PGs. A nephroprotective effect was also observed, characterized by reduction of the renal hypertrophy and a significant drop of TGF-β1 expression. Celecoxib treatment was also associated with a non-statistically significant reduction of AT1 receptor expression.
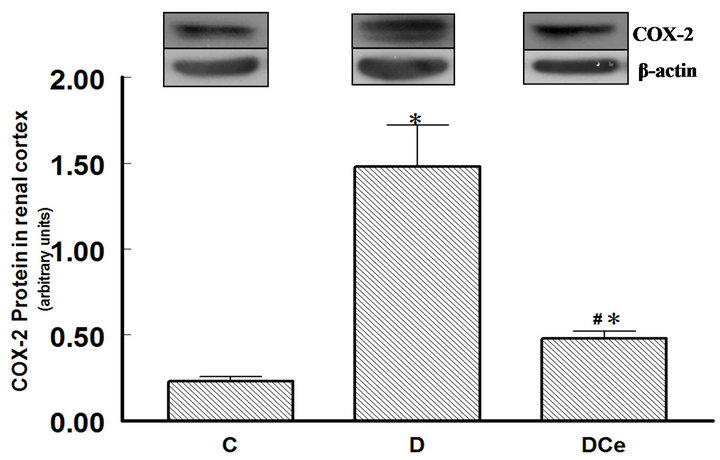
Figure 6. Relative intensity of COX-2 receptor/β-actin, from renal cortex of diabetic rats 7 days after streptozotocin administration. Control rats (C), diabetic rats (D), and diabetic rats treated with celecoxib (DCe). Values are expressed as mean ± SEM. *p < 0.05 vs control rats; #p < 0.05 vs diabetic rats.
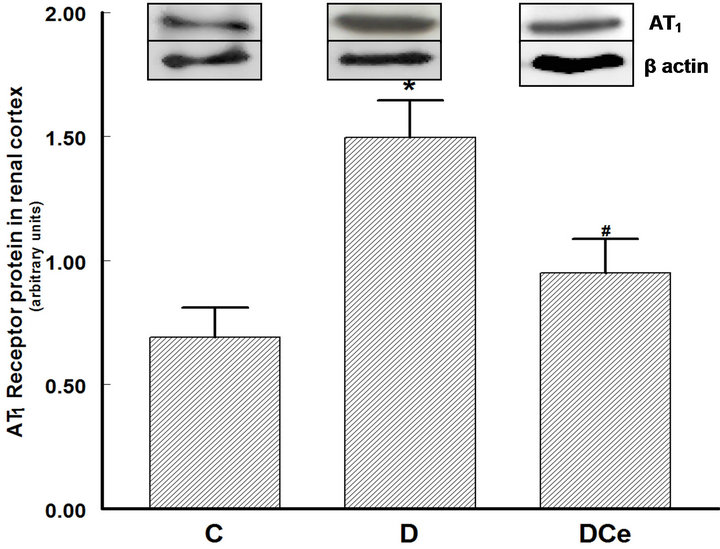
Figure 7. Relative intensity of AT1 receptor/β-actin from renal cortex of diabetic rats 7 days after streptozotocin administration. Control rats (C), diabetic rats (D), and diabetic rats treated with celecoxib (DCe). Values are expressed as mean ± SEM. *p < 0.05 vs control rats; #p < 0.05 vs diabetic rats.
There are many studies on diabetes, in humans and experimental models, which have shown derangements in arachidonic acid metabolism, and in PGs and TXB2 production. The most typical finding in diabetic rats is increased COX activity and increased urinary excretion of PGs, associated with hyperfiltration and renal damage [26].
Prior to the discovery of the COX isoforms, it was considered that the constitutive enzyme COX-1 was the one involved in the synthesis of renal damage-producing PGs. Later, the inducible isoform COX-2 was discovered. COX-2 is present in lower amounts in the healthy kidney and shows increased expression in DM and in inflammatory processes [16,17].
In the present study, changes in proteinuria induced by celecoxib treatment were not observed, maybe because
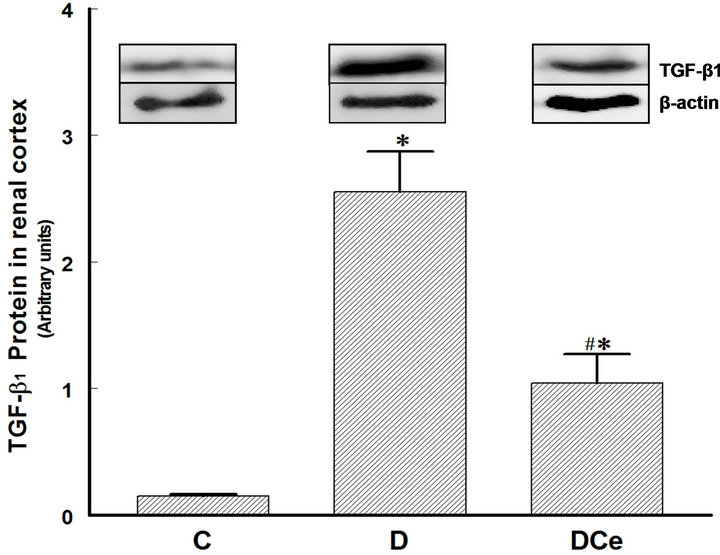
Figure 8. Relative intensity of TGF-β receptor/β-actin from renal cortex of diabetic rats 7 days after streptozotocin administration. Control rats (C), diabetic rats (D), and diabetic rats treated with celecoxib (DCe). Values are expressed as mean ± SEM. *p < 0.05 vs control rats; #p < 0.05 vs diabetic rats.
the duration of the treatment was of only one week, a period that probably was not enough to allow the reversal of proteinuria. This model of early DM is characterized mainly by renal hypertrophy, measured in this study by kidney weight, cellular area in histological preparations of the kidneys, and by the protein/DNA ratio in kidney tissue samples. All of these three parameters were higher in the group of diabetic rats than in the control group. Treatment of the diabetic rats with the selective COX-2 inhibitor celecoxib reduced kidney hypertrophy; however, the values did not return to those seen in the control group. It has been reported that renal hypertrophy in diabetic rats is correlated to increased expression of TGF-β1. Reportedly, TGF-b1 has a role in the development of structural changes of diabetic patients’ kidneys and experimental models of diabetic nephropathy. In a model of diabetic nephropathy, treatment with an antibody against TGF-b1 was able to prevent kidney damage [27]. There are many mechanisms for TGF-b1 activation, among them, hyperglycemia itself [28,29]. Hyperglycemia stimulates alternative pathways for glucose metabolism, facilitating non-enzymatic glycation of proteins, enhancement of the polyols and diacylglycerol pathways, and activation of protein kinase C [30]. One of the proposed mechanisms points out that TGF-b1 induces renal hypertrophy by stopping the cell cycle in the G1 late phase, in which the cells synthesize proteins without replicating DNA, eventually resulting in cell hypertrophy [31]. In the model described in the present study, we observed the development of renal hypertrophy as early as the first week after the induction of DM. The activation of the intra-renal renin-angiotensin system (RAS) is another important mechanism that may explain the increased TGF-b1 renal production and secretion. In vivo and in vitro studies have demonstrated that chronic hyperglycemia can activate the RAS [32,33]. Ang II is an effector molecule that besides stimulating TGF-b1 expression can also directly participate in the development of diabetic nephropathy. In the present study we observed increased expression of the AT1 receptor in the diabetic rats’ kidneys. In other studies, it has been observed that AT1 receptors stimulation by Ang II can induce the renal pathological changes of diabetic nephropathy. Treatment of DM with AT1 receptor inhibitors reduces TGF-b1 and AT1 receptor expression both in humans and in rat models [34]. In the present study, the expression of the AT1 receptor was increased in the group of diabetic rats. Treatment with celecoxib reduced COX-2, AT1 receptor, and TGF-b1 renal expression.
These results suggest that in early DM, kidney hypertrophy is mediated by activation of the RAS. High Ang II levels can act by stimulating the AT1 receptors, and by increasing TGF-b1 expression. In turn, COX-2 may play an important role regulating both AT1 receptors and TGF-b1 expression.
The RAS, and specifically Ang II, have a role in the production of the kidney damage in diabetic nephropathy, since the treatment of diabetic patients with ACE inhibitors and/or AT1 receptor antagonists improves renal function and reduces proteinuria. However, the exact mechanisms explaining why Ang II stimulates the development of kidney hypertrophy are not known.
In conclusion, we have shown that COX-2 participates in the renal hypertrophy developed by rats with STZinduced DM. COX-2 may modulate the activity of Ang II and TGF-b1. Treatment with the selective COX-2 inhibitor celecoxib was effective in reducing renal hypertrophy, suggesting that this kind of drugs may have a renoprotective effect, in turn, mediated by reduction of the expression of AT1 receptors and TGF-b1.
5. Acknowledgments
This study was supported by PAPCA 2010, CONACyT 52565, SIP IPN 20100012, 20110124 and DGAPAPAPIIT IN210307 grants.
REFERENCES
- N. D. Evcimen and G. L. King, “The Role of Protein Kinase C and the Vascular Complications of Diabetes,” Pharmacological Research, Vol.55, No. 6, 2007, pp. 498- 510. doi:10.1016/j.phrs.2007.04.016
- H. King, R. E. Aubert and W. H. Herman, “Global Burden of Diabetes, 1995-2025: Prevalence, Numerical Estimates, and Projections,” Diabetes Care, Vol. 21, No. 9, 1998, pp. 1414-1431. doi:10.2337/diacare.21.9.1414
- The Diabetes Control and Complications Trial Research Group, “The Effect of Intensive Treatment of Diabetes on the Development and Progression of Long-Term Complications in Insulin-Dependent Diabetes Mellitus,” The New England Journal of Medicine, Vol. 329, No. 14, 1993, pp. 977-986. doi:10.1056/NEJM199309303291401
- J. T. Shumway and S. R. Gambert, “Diabetic Nephropathy—Pathophysiology and Management,” International Urology and Nephrology, Vol. 34, No. 2, 2002, pp. 257- 264. doi:10.1023/A:1023244829975
- F. N. Ziyadehy, “The Extracellular Matrix in Diabetic Nephropathy,” American Journal of Kidney Diseases, Vol. 22, No. 5, 1993, pp. 736-744.
- G. T. O’Bryan and T. H. Hostetter, “The Renal Hemodynamic Basis of Diabetic Nephropathy,” Seminars in Nephrology, Vol. 17, No. 2, 1997, pp. 93-100.
- S. C. Thomson, V. Vallon and R. C. Blantz, “Kidney Function in Early Diabetes: The Tubular Hypothesis of Glomerular Filtration,” American Journal of Physiology Renal Physiology, Vol. 286, No. 1, 2004, pp. F8-F15.
- M. Bak, K. Thomsen, T. Christiansen and A. Flyvbjerg, “Renal Enlargement Precedes Renal Hyperfiltration in Early Experimental Diabetes in Rats,” Journal of the American Society of Nephrology, Vol. 11, No. 7, 2000, pp. 1287-1292.
- F. N. Ziyadeh and G. Wolf, “Pathogenesis of the Podocytopathy and Proteinuria in Diabetic Glomerulopathy,” Current Diabetes Reviews, Vol. 4, No. 1, 2008, pp. 39-45. doi:10.2174/157339908783502370
- F. N. Ziyadeh, “Mediators of Diabetic Renal Disease: The case for TGF-β as the Major Mediator,” Journal of the American Society of Nephrology, Vol. 15, No. 15, 2004, pp. S55-S57.
- V. Vallon, R. C. Blantz and S. C. Thomson, “Glomerular Hyperfiltration and the Salt Paradox in Early Type 1 Diabetes Mellitus: A Tubulo-Centric View,” Journal of the American Society of Nephrology, Vol. 14, No. 2, 2003, pp. 530-537. doi:10.1097/01.ASN.0000051700.07403.27
- G. Wolf and F. N. Ziyadeh, “Molecular Mechanism of Diabetic Renal Hypertrophy,” Kidney International, Vol. 56, No. 2, 1999, pp. 393-405. doi:10.1046/j.1523-1755.1999.00590.x
- J. P. Bonvalet, P. Pradelles and N. Farman, “Segmental Synthesis and Actions of Prostaglandins along the Nephron,” American Journal of Physiology, Vol. 523, No. 3, 1987, pp. F377-F387.
- M. Schambelan, S. Blake, J. Sraer, M. Bens, M. P. Nivez and F. Wahbe, “Increased Prostaglandin Production by Glomeruli Isolated from Rats with Streptozotocin-Induced Diabetes Mellitus,” The Journal of Clinical Investigation, Vol. 75, No. 2, 1985, pp. 404-412. doi:10.1172/JCI111714
- M. Okumura, M. Imanishi, M. Okamura, M. Hosoi, N. Okada, Y. Konishi, T. Morikawa, K. Miura, T. Nakatani and S. Fujii, “Role for Thromboxane A2 from Glomerular Thrombi in Nephropathy with Type 2 Diabetic Rats,” Life Sciences, Vol. 72, No. 24, 2003, pp. 2695-2705. doi:10.1016/S0024-3205(03)00180-2
- A. Yabuki, K. Taniguchi and O. Yamato, “Immunohistochemical Examination of Cyclooxygenase-2 and Renin in a KK-A(y) Mouse Model of Diabetic Nephropathy,” Experimental Animals, Vol. 59, No. 4, 2010, pp. 479-486. doi:10.1538/expanim.59.479
- R. Komers, J. N. Lindsley, T. T. Oyama, W. E. Schutz, J. F. Reed, S. L. Mader and S. Anderson, “Immunohistochemical and Functional Correlations of Renal Cyclooxygenase-2 in Experimental Diabetes,” The Journal of Clinical Investigation, Vol. 107, No. 7, 2001, pp. 889-898. doi:10.1172/JCI10228
- H. F. Cheng, C. J. Wang, G. W. Moeckel, M. Z. Zhang, J. A. Mckanna and R. C. Harris, “Cyclooxygenase-2 Inhibitor Blocks Expression of Mediators of Renal Injury in a Model of Diabetes and Hypertension,” Kidney International, Vol. 62, No. 3, 2002, pp. 929-939. doi:10.1046/j.1523-1755.2002.00520.x
- J. Quilley, M. Santos and P. Pedraza, “Renal Protective Effect of Chronic Inhibition of COX-2 with SC-58236 in Streptozotocin-Diabetic Rats,” American Journal of Physiology Heart Circulation Physiology, Vol. 300, No. 6, 2011, pp. H2316-H2322. doi:10.1152/ajpheart.01259.2010
- J. Li, Y. J. Chen and J. Quilley, “Effect of Tempol on Renal Cycloolxygenase Expression and Activity in Experimental Diabetes in the Rat,” Journal of Pharmacology and Experimental Therapeutics, Vol. 314, No. 2, 2005, pp. 818-824. doi:10.1124/jpet.104.076927
- C. E. Mogensen, “The Reno-Protective Role of AT1- Receptor Blockers,” Journal of Human Hypertension, Vol. 16, Supplement 3, 2002, pp. S52-S58. doi:10.1038/sj.jhh.1001440
- M. W. Taal and B. M. Brenner, “Renoprotective Benefits of RAS Inhibition: From ACEI to Angiotensin II Antagonists,” Kidney International, Vol. 57, No. 5, 2000, pp. 1803-1817. doi:10.1046/j.1523-1755.2000.00031.x
- E. Villa, A. Rábano, L. M. Ruilope and R. García-Robles, “Effects of Cicaprost and Fosinopril on the Progression of Rat Diabetic Nephropathy,” American Journal of Hypertension, Vol. 10, No. 2, 1997, pp. 202-208. doi:10.1016/S0895-7061(96)00319-6
- R. C. Harris, “Interactions between COX-2 and the Renin-Angiotensin System in the Kidney,” Acta Physiologica Scandinavica, Vol. 177, No. 4, 2003, pp. 423- 427. doi:10.1046/j.1365-201X.2003.01101.x
- R. C. Harris, M. Z. Zhang and H. F. Cheng, “Cyclooxygenase-2 and the Renal Renin-Angiotensin System,” Acta Physiologica Scandinavica, Vol. 181, No. 4, 2004, pp. 543-547. doi:10.1111/j.1365-201X.2004.01329.x
- P. A. Craven, M. A. Caines and F. R. DeRubertis, “Sequential Alterations in Glomerular Prostaglandins and Thromboxane Synthesis in Diabetics Rats: Relationship to the Hyperfiltration of Early Diabetes,” Metabolism, Vol. 36, No. 1, 1987, pp. 95-103. doi:10.1016/0026-0495(87)90070-9
- K. Sharma, Y. Jin, J. Guo and F. N. Ziyadeh, “Neutralization of TGF-β by Anti-TGF-β Antibody Attenuates Kidney Hypertrophy and the Enhanced Extracellular Matrix Gene Expression in STZ-Induced Diabetic Mice,” Diabetes, Vol. 45, No. 4, 1996, pp. 522-530.
- M. V. Rocco, Y. Chen, S. Goldfarb and F. N. Ziyadeh, “Elevated Glucose Stimulates TGF-β Gene Expression and Bioactivity in Proximal Tubule,” Kidney International, Vol. 41, No. 1, 1992, pp. 107-114. doi:10.1038/ki.1992.14
- F. N. Ziyadeh, K. Sharma, M. Ericksen and G. Wolf, “Stimulation of Collagen Gene Expression and Protein Synthesis in Murine Mesangial Cells by High Glucose is Mediated by Autocrine Activation of Transforming Growth Factor-β,” The Journal of Clinical Investigation, Vol. 93, No. 2, 1994, pp. 536-542. doi:10.1172/JCI117004
- J. Satriano, “Kidney Growth, Hypertrophy and the Unifying Mechanism of Diabetic Complications,” Amino Acids, Vol. 33, No. 2, 2007, pp. 331-339. doi:10.1007/s00726-007-0529-9
- S. Chen, B. Jim and F. N. Ziyadeh, “Diabetic Nephropathy and Transforming Growth Factor-β: Transforming Our View of Glomerulosclerosis and Fibrosis Build-Up,” Seminars in Nephrology, Vol. 23, No. 6, 2003, pp. 532- 543. doi:10.1053/S0270-9295(03)00132-3
- J. M. Campistol, P. Iñigo, S. Larios, M. Bescos and F. Oppenheimer, “Role of Transforming Growth Factor-β1 in the Progression of Chronic Allograft Nephropathy,” Nephrology Dialysis Transplantation, Vol. 16, Supplement 1, 2001, pp. 114-116. doi:10.1093/ndt/16.suppl_1.114
- K. D. Burns, “Angiotensin II and Its Receptors in the Diabetic Kidney,” American Journal of Kidney Diseases, Vol. 36, No. 3, 2000, pp. 449-469.
- D. J. Leehey, A. K. Singh, N. Alavi and R. Singh, “Role of Angiotensin II in Diabetic Nephropathy,” Kidney International Supplement, Vol. 58, Supplement 77, 2000, pp. S93-S98. doi:10.1046/j.1523-1755.2000.07715.x
NOTES
*Corresponding author.