Open Journal of Air Pollution
Vol.1 No.3(2012), Article ID:25826,15 pages DOI:10.4236/ojap.2012.13011
Dynamic Modeling of Air Pollution and Acid Rain from Energy System and Transport in Kosovo
1Faculty of Mathematical and Natural Sciences, University of Prishtina, Prishtina, Kosovo 2Jožef Stefan Institute, Ljubljana, Slovenia 3Jožef Stefan International Postgraduate School, Ljubljana, Slovenia
4Faculty of Natural Sciences and Mathematics, University of Maribor, Maribor, Slovenia
Email: skenderkabashi@yahoo.com, sadik.bekteshi@uni-pr.edu, a_jonuzaj01@hotmail.com, Aleksander.Zidansek@ijs.si
Received August 23, 2012; revised September 25, 2012; accepted October 10, 2012
Keywords: Modeling; Air Pollution Transport; Acid Rain; Chemical Smog; Kosovo
ABSTRACT
Sulfur dioxide (SO2) and nitrogen dioxide (NO2) emissions generated at coal burning power plants and from transport are a leading cause of acid deposition and chemical smog in many parts of the world. Sulfur dioxide emitted by thermal power plants and from transport in Kosovo is transported via prevailing winds to other locations. Through its journey, this SO2 gas undergoes a series of chemical reactions that ultimately transform it into sulfuric acid (H2SO4) which is deposited as acid rain. As a consequence of NO2 emissions from electricity production and transport in Kosovo the ozone (O3) is formed as photochemical smog due to sunlight, which triggers the breakdown of NO2. We modeled the impact of SO2 and NO2 emissions from energy system and transport in Kosovo on acid deposition and chemical smog locally. In model we consider the role of SO2 and NO2 pollution control technologies on mitigating these impacts.
1. Introduction
Air pollution found in a geographic area is often not generated in that area rather it has been transported from other places. The location that generates the pollution is called the pollution source the location that receives the pollution is called the pollution receptor. In the atmosphere in which pollution forms it is transported with the wind and the weather dynamic meteorological conditions, such as temperature, humidity, wind direction, and wind speed affect the way pollutants are mixed, dispersed and transported across geographic boundaries [1].
The examples of this phenomenon are the problem of acid deposition and chemical smog. The largest contributor of acid deposition in many parts of the world is sulfur dioxide (SO2). Sulfur dioxide is formed from many sources, but its predominant anthropogenic source is coal burning power plants. The major source of SO2 in the Kosovo is Electricity Generation and Transport systems. SO2 emitted into the atmosphere, is transported via prevailing winds to other locations, through its journey, this SO2 gas undergoes a series of chemical reactions that ultimately transform it into sulfuric acid (H2SO4) or sulfurous acid (H2SO3) which is deposited as acid rain [2].
Also the trace amounts of ozone that does form in the troposphere as a component of urban smog damage plants and respiratory system of people. Thus, our good health depends on having enough ozone in stratosphere and as little as possible ozone in the troposphere. Human activities increase concentrations of ozone in the troposphere and decrease ozone concentrations in the stratosphere. Tropospheric ozone (O3) as a photochemical oxidant is created by the breakdown of the anthropogenic pollutant nitrogen dioxide (NO2). Sunlight causes nitrogen dioxide NO2 to break down into nitrogen oxide NO and monatomic oxygen O. This O atom combines then with O2 to form O3. In this paper we will explore the dynamic nature of atmospheric chemistry focusing on the acid deposition problem and chemical smog locally in Kosovo as e consequence of emissions of SO2 and NO2 from TPP units A, B and C near Obiliq and from Transport in Kosovo.
2. Modeling the Kosovo Energy-Emissions Systems
Kosovo as a country rich with lignite, is one of the most polluted countries in Europe, because its production and energy exploitation is based on fossil fuels up to 95% [3]. The key pollutants associated with the energy and transport sectors among them are sulfur dioxide (SO2) and nitrogen oxides (NOx) (the sum of NO and NO2 is termed nitric oxides, NOx). Fossil fuels are subject to resource depletion and there is a consensus among scientists that the burning of fossil fuels is causing an enhanced greenhouse effect, acid deposition and chemical smog. In this paper we have presented two of the sectors that appear as the greatest generators of the air pollution (SO2 and NOx) i.e. transportation and electricity generation. As a conesquence of NO2 emissions from electricity production and transport in Kosovo the ozone (O3) is formed as photochemical smog due to sunlight, which triggers the breakdown of NO2. We modeled the impact of SO2 and NO2 emissions from energy system and transport in Kosovo on acid deposition and chemical smog locally. In model we consider the role of SO2 and NO2 pollution control technologies on mitigating these impacts. Models presented here for the transportation and electricity generation sectors, incorporate environment policies and new technologies that achieve EU standards which would be compatible with SO2 and NO2 reduction requirements.
2.1. Electricity Generation SO2 and NOx Emitting
We developed Integrated Energy Demand-Supply and Emission Model for Kosovo in Stella software. The model integrating the Transport and the electricity generation emission systems in Kosovo is presented in Figure 1. The most important source we use for demand forecast are data from KOSTT (TSO of Kosovo) and KEK. For the yearly demand forecast a distinction is made between:
• Residential demand
• Heavy industrial and light industrial demand, and
• Service demand Most important factors for electricity demand forecast for Kosovo taken in consideration are:
• Economic growth forecast
• Population growth forecast
• Energy price forecast, and
• Billing forecast
2.1.1. Model Configuration
We have considered the year 2000 as the initial condition for electricity demand-supply forecast and emission model for Kosovo. Figure 1 shows the configuration model of electricity demand—supply forecast and emissions of air pollutions (SO2 and NO2) in Kosovo using STELLA software.
2.1.2. Simulation Results
In Figure 1 we can see the simulation results:
Residential demand. The main factor for the increase of residential will be the population growth and economic development. But, in the course of population growth and economic development, the consumption per residential unit will decrease, and according to the model, an annual decrease of 1.5% is forecast. This will make possible an affordable and normal increase of residential demand. The factors that affect the reduction of consumption per residential unit are: regular and steady billing of the electric power consumption, billing prices, construction of building with proper and qualitative insulation, etc.
Industrial demand. The most impact on the increase of general demand for energy will have the industrial, light and heavy sectors. Capital investments from the foreign investors will be the crucial factors in the development of the industrial sector. Until the year 2015 three major units of heavy industry is expected to operate in Kosovo: Ferronickel Foundry, Mine and Foundry Complex of Trepcha and the Cement Factory Sharr-Cem. A significant increase of demand for electric power in the heavy industry sector is expected in the mine and oredressing sector (metals, coal, etc.). A significant increase is expected also in the light industry sector which will evolve in parallel with the development of heavy industry. In this development the foreign investments in the nutrition industry, metal processing industry, etc., will influence as well.
Service demand. In the service sector an increase in demand is expected for electric power, which in percentage is expected to be less than in the industrial sector, but greater than in the residential sector. In this model for electricity energy production (from TPP and renewable sources) and consumption (from Transport-mobile sources) we developed two scenarios, also and for emissions of air pollutants (SO2 and NOx).
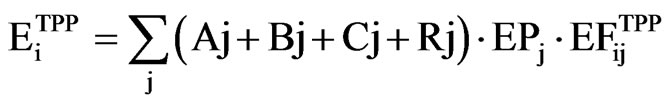
Scenario 1. In Kosovo the electric power is produced 95% from the lignite power plants: Units Aj = {A1, A2, A3, A4, A5} and Bj = {B1, B2}. Commencement of construction of the unit Cj = {C1, C2, C3} is planned for the year 2012. The rest of only 3% - 5% of electric power is produced from the renewable sources which we will denote by Rj. Total annual energy production (EP) from the all production units Uj is calculated by Equation (1)
 (1)
(1)
In Figure 2, the scenario of the total annual energy production from renewable sources and fossil fuels is shown. According to this scenario, the electric power production predominates with 95% of the energy produced from lignite. As a result of the energy production from lignite we have the emission of gases that cause the acid rain and photochemical smog due increasing the level of ozone on Troposphere, such as SO2 and NOx respectively. Emission is calculated by the formula [4]
 (2)
(2)
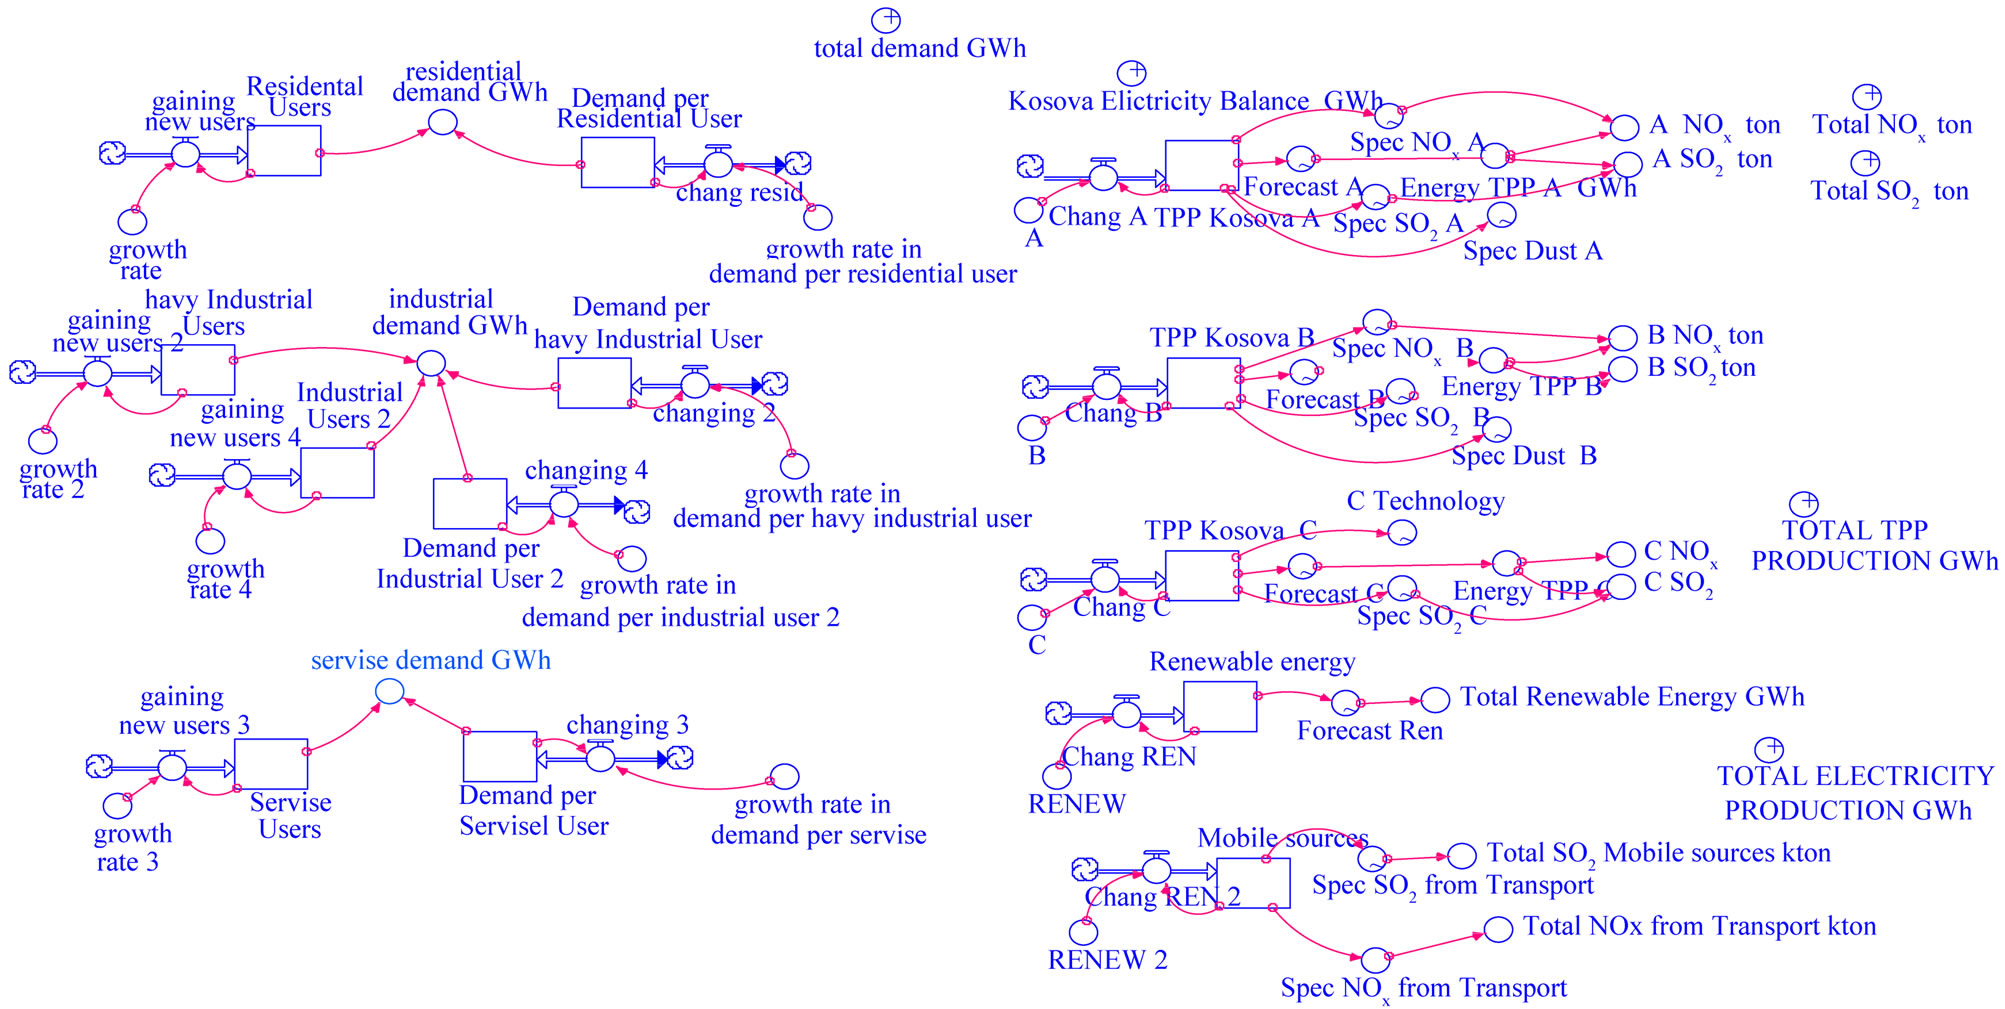
Figure 1. Energy-emission model in Kosovo.
where  is the total annual emission of I = SO2 and NOx,
  is the emission factor for SO2 and NOx from production unit j (t/MWh) and
  is the energy production from unit j. For the initial values of the emission factors we have taken the values presented in Table 1. These values will change with the establishment of the EU standards for emission [5] as well as with the advance in new technologies for reductions of SO2 and NOx. Using these initial values for emission and the values that are expected in the future, from the Equation (2) of air pollution per year, we obtain the results shown in Figure 2. From Figure 2 we see that according to the scenario 1, we will have an increase in emission of NOx and SO2 until the year 2012, and thereafter a decrease in emission through the year 2012. In course of this period, the units A as the greatest pollutants will fall out of use. In the year 2017 the TPP C1, C2 and C3 will start with production, with a power capacity of 2100 MW and as a result we will have an increase of the SO2 and NOx, output.
Scenario 2. According to this scenario (see Figure 3) the renewable energy from the year 2012 through the year 2025 will consist in 12% - 15% of the total energy production in Kosovo. The total power from renewable sources in the year 2025 will be 503.32 MW, which is 12.3% of the overall energy produced in 2025.
According to the Scenario 2, the reduction of NOx and SO2, output will be achieved gradually starting from the year 2017, when the solar energy production with all its modes (HPP, wind, solar, thermal, photovoltaic, etc.) will be 892 GWh, which is 12.79% of the overall annual production of the year 2017.
In the year 2017 the TPP A and B1 as the greatest emitters of SO2 and NOx will be closed, and investments in new technologies in TPP B2 will make possible the reduction of SO2 and NOx output up to 30% per MWh of energy. The same year, the TPP C2 and C3 will start with production, with a new technology of burning of lignite and the reduction of emission for 40% - 50% less than the TPP B emits. Continual application of new technologies until the year 2025, the emissions of NOx and SO2, will be significantly reduced due to imposed standards of emissions.
2.2. Emissions Trends and Projections of SO2 and NOx from Transport in Kosovo
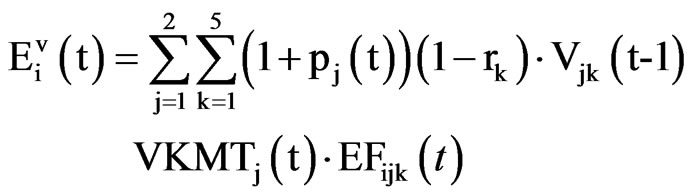
The annual total emission for NOx, and SO2, from transport from the year 2000 up to 2025, is calculated [5-7]. The base year for emission is taken the year 2000. Initial data values for vehicle population is taken from MEM and from the World Bank Project for Kosovo, and projection for total number of vehicles in Kosovo is calculated with WB Atlas Method (Global Report on Human Settlements, 2001), while the projection for emission factors and total annual NOx, and SO2 are calculated with US EPA Methodology. The model presented here for total emission is a cohort model. We develop a model in which we identify technology and policy options for reducing mobile source SO2 and NOx emission and explain how these options might affect the different variables of a mobile source emission model to reduce total annual emission. According to US EPA methodology for mobile sources, we establish [7] equation for the total emission for pollutant i emitted from the total number of vehicles
 (3)
(3)
where  is the total emission for pollutant i emitted from the total number of vehicles (v), j = 1, 2 indicates two types of vehicles: light vehicles and heavy vehicles, i indicates NOx, SO2, t = 2001, 2002
 2025 year; t = 2000 is the initial year, Vjk is the total number of vehicles of type j and cohort type k on the road during a certain year (vehicles), VKMTj is the average annual kilometres travelled for vehicles of type j and cohort type k (km/vehicle/ year), EFijk is the average emission of pollutant i for vehicle type j and cohort type k (gr/km). Each cohort has its own individual scrappage rate (rk). These rates represent the fraction of vehicles scrapped over the transit time for each conveyor. The factor (1 +
 ) is increasing rate per year factor (imported vehicles type j while in the cohort). The Emission factors Emission factors for SO2 and NOx (gr/km)of Ligh (LV) and Heavy Vehicles (HV) initial values in year 2000 are presented on Table 2.
The output of the model for total NOx and SO2, (kt/
year) emissions trends and projections from transport in Kosovo (scenario 1 and scenario 2) is presented in Figure 4.
2.3. Total SO2 and NOx Emission Trends and Reduction in Kosovo
The total SO2 and NOx emissions ( ) both from transport (
 ) and electricity generation (
 ) from Equations (2) and (3) is
 (4)
(4)
Policy and Technology Options for Reducing SO2 and NOx from Transport and Electricity Generation in Kosovo
There is a variety of policy and technology options that may be employed to reduce SO2 and NOx emissions from transport and electricity generation. The possible options for reducing SO2 and NOx emissions from TPP and Transport include the following [8,9]:
• Increasing the efficiency of coal (lignite) burning power plants in the 45% - 50% range (Coal gasification combined-cycle power plants have that thermal efficiency).
• Shift to no-fossil energy sources. Shifting to hydroelectricity, solar, biomass [10] wind and geothermal. High-efficiency vehicles with alternative transportation fuels (e.g., natural gas, ethanol, methanol, propane, hydrogen, electric vehicles).
• Implementing the emission reduction policies and introducing new technologies in electrical power production and in transportation Kosovo for the total emissionwe will have a significant reduction for NOx (48%) and SO2 (52%) (Scenario 2), in the year 2025 in comparison with the year 2006. See Figures 5 and 6.
3. Modeling the Dynamic Acid Deposition System in Kosovo
The largest contributor of acid deposition in many parts of the world is sulfur dioxide (SO2). Sulfur dioxide is formed from many sources, but its predominant anthropogenic source is coal burning power plants. Once SO2 is emitted into the atmosphere, it undergoes a series of chemical reactions that transform it to either sulfurous acid (H2SO3) or sulfuric acid (H2SO4). The air pollution source in Kosovo TPP Units Aj = {A1, A2, A3, A4, A5}, Bj = {B1, B2} and commencement of construction of the unit Cj = {C1, C2, C3} is planned for the year 2012 with emit significant amounts of SO2. Figures 5 and 6 show trends and projections of SO2 total emission rate in the Kosovo. We will modeled the impact of those emissions will have on acid deposition locally and the role of SO2 pollution control technologies which may have on mitigating these impacts.
3.1. Reactions Involving SO2
Anthropogenic SO2 emissions in Kosovo are released during combustion of coal on TPP units A, B and C and oil from transport sector that have high sulfur concentrations. This gaseous SO2 is normally released into the atmosphere. There are several reactions that can transform gaseous SO2 to either sulfuric acid (H2SO4) or sul-
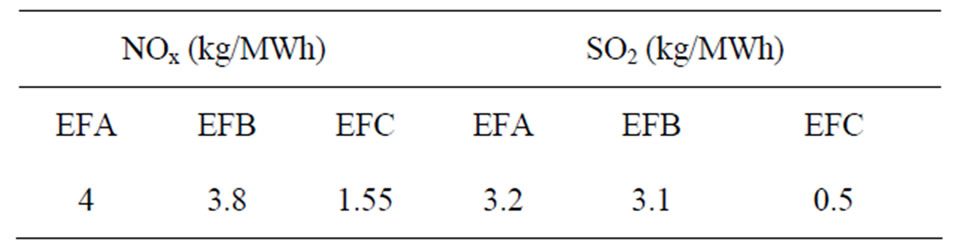
Table 1. Emission factors for TPP.
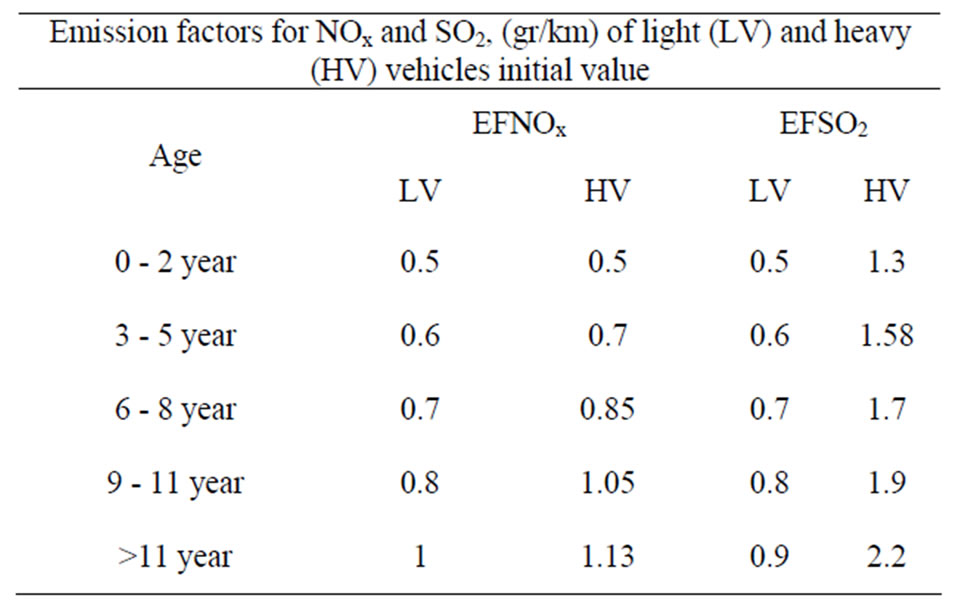
Table 2. Emission factors for SO2 and NOx (gr/km) of Light (LV) and Heavy Vehicles (HV) Initial values in year 2000.
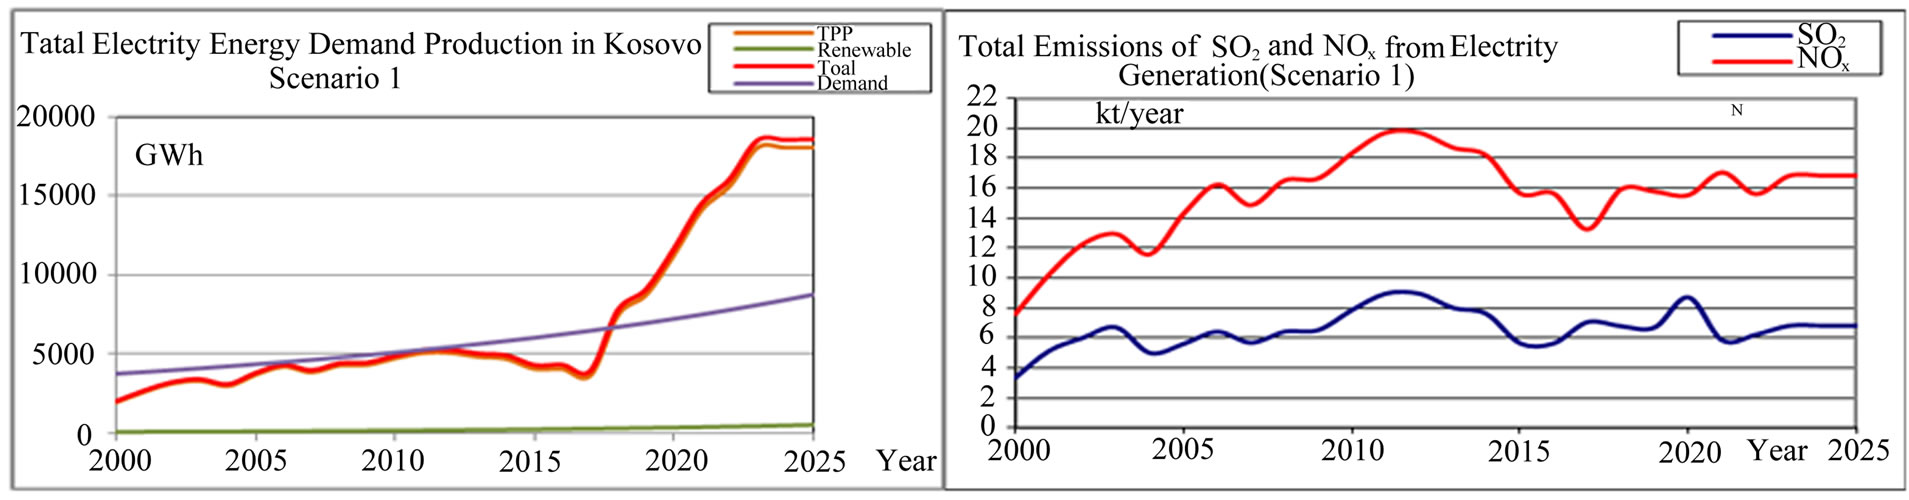
Figure 2. Total electricity energy demand-production (GWh) and total SO2 and NOx emission trends and projections from TPP Kosovo (kton) (scenario 1).
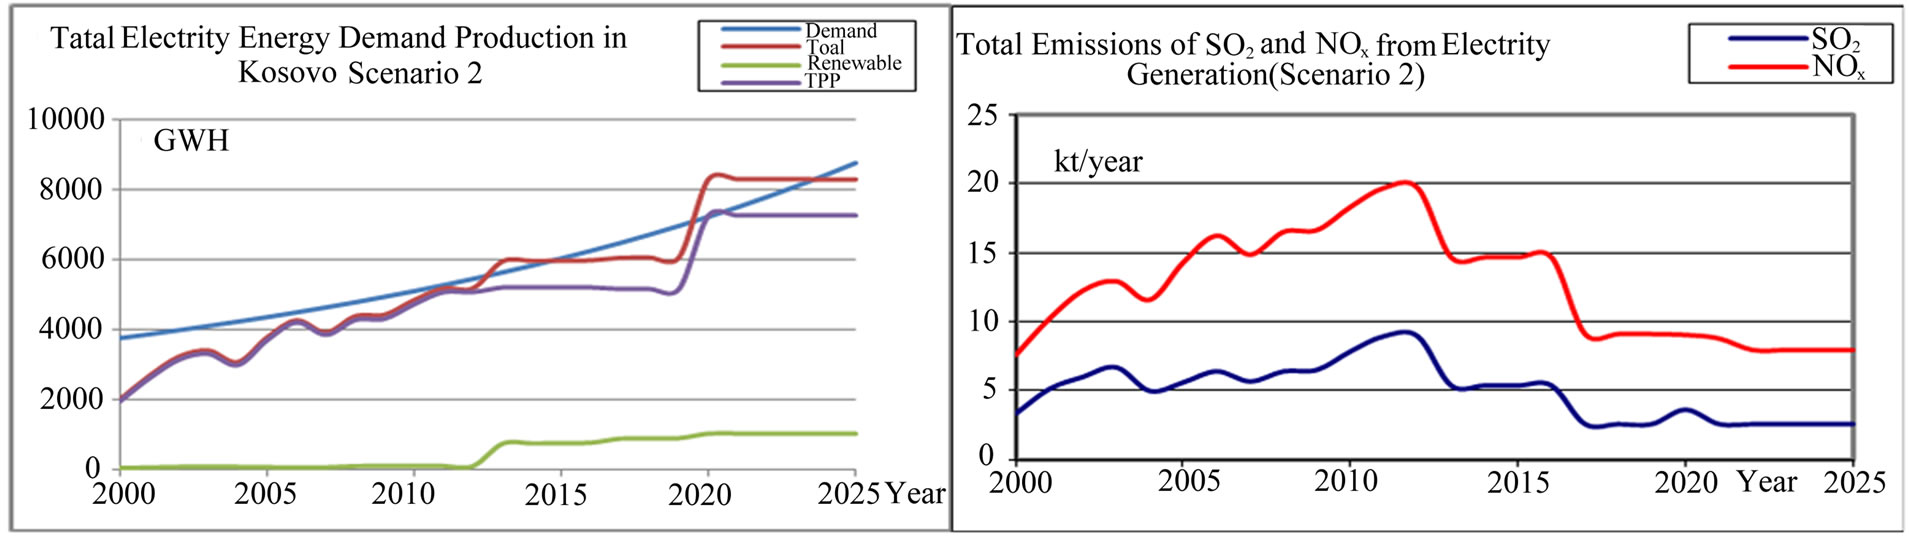
Figure 3. Total electricity demand-production (GWh) and total SO2 and NOx emission trends and projections from TPP Kosovo (kton) (scenario 2).

Figure 4. Total NOx and SO2, (kt/year) emissions trends and projections from transport in Kosovo (scenario 1 and scenario).
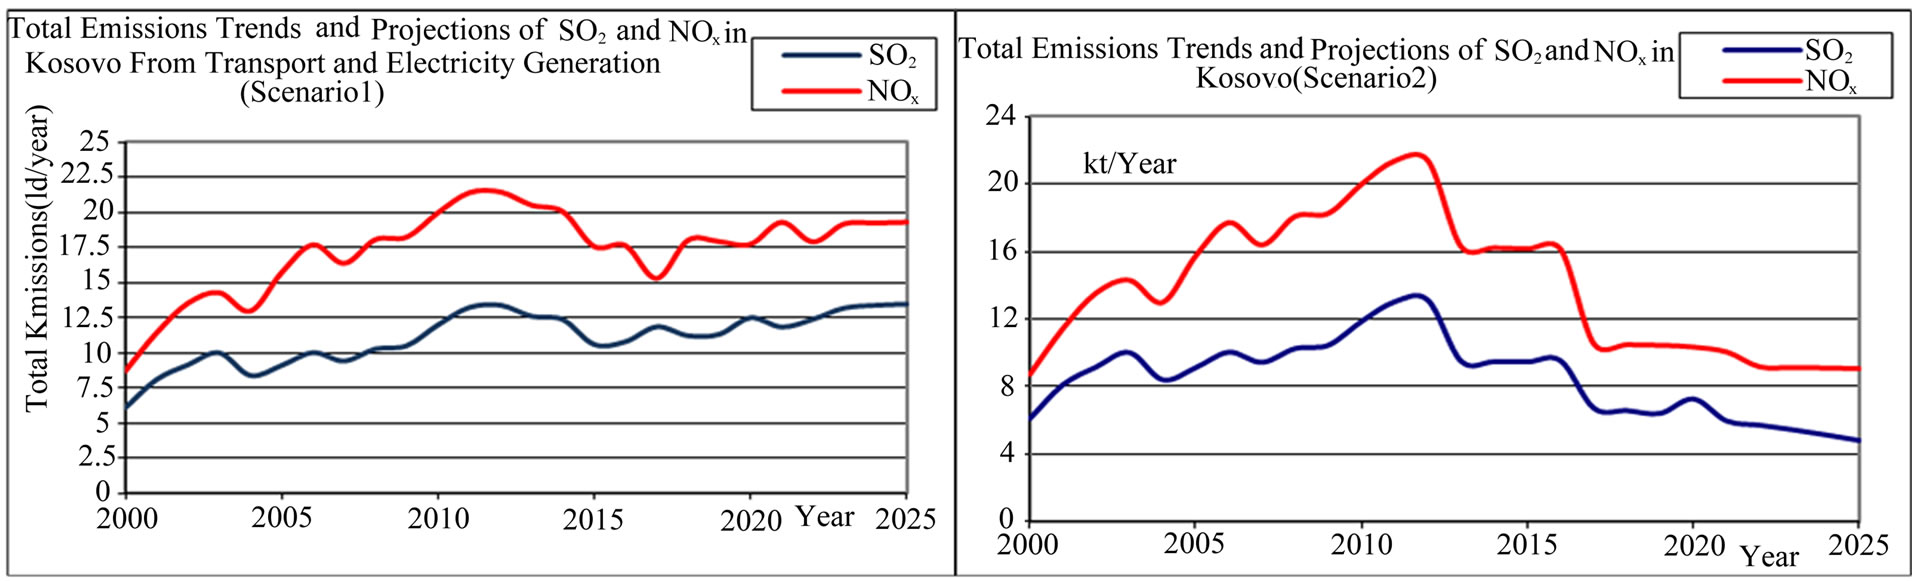
Figure 5. Total NOx and SO2, (in kt/year) emissions trends and reduction in Kosovo (scenario 1 and scenario 2).
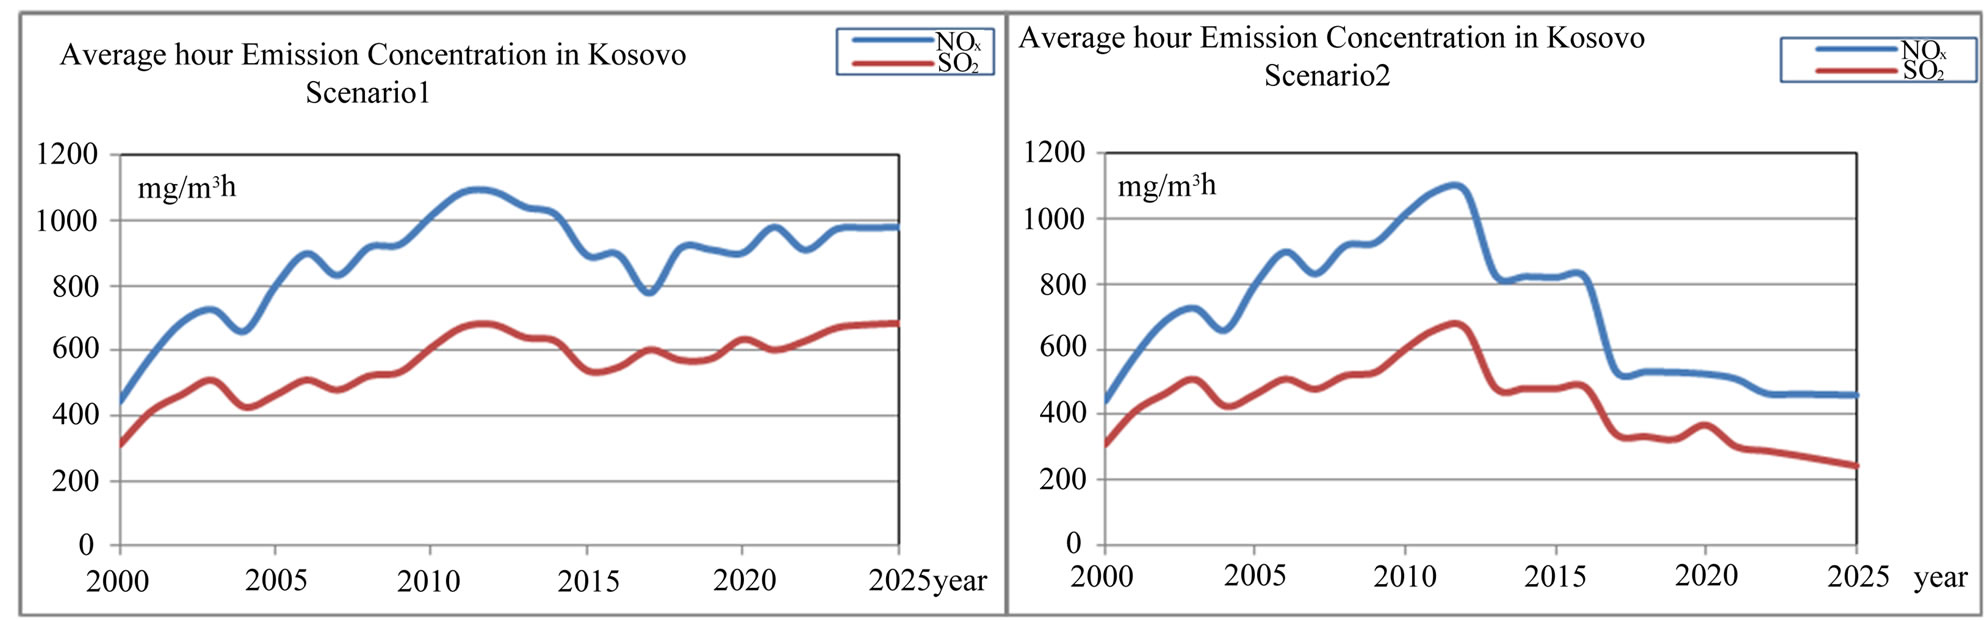
Figure 6. Average hour emission concentration of SO2 and NOx in Kosovo (mg/m3·h) (scenario 1 and scenario 2).
furous acid (H2SO3).
1) Some of the emitted SO2 is oxidized to SO3. Bunce [11,12] has identified a good first-order approximation for conversion of SO2 to SO3 per hour given by pseudo-first-order rate constant k1 = 0.1 hr–1.
This rate constant varies according to meteorological conditions, with high humidity and sunlight both leading toward higher reaction rates.
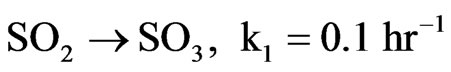 (5)
(5)
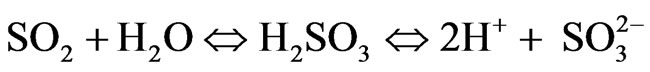
2) Some of the emitted SO2 combines with water (H2O) to from H2SO3. This H2SO3 further dissociates to release hydrogen ions and is deposited following equation
 (6)
(6)
H2SO3 in the aqueous state releases H+ ions and  (sulfite) ions. We can approximate a pseudo-firstorder reaction rate that captures both the transformation rate and the average deposition rate of this acid. The reaction and deposition processes occur at an average rate of k2 approximated as 0.03. We can write the summary reaction as follows:
 (7)
(7)
3) Finally, some of the SO3, generated in the first reaction identified earlier combines with the water to from H2SO4, or sulfuric acid. This acid dissociates to release H+ ions and SO3 ions. Again, we use a general reaction to illustrate this chemical transformation and deposition process:
 (8)
(8)
H2SO4 can release H+ ions and  (sulfate) ions. We can approximate a pseudo-first-order reaction rate that captures the reaction and deposition process as follows:
 (9)
(9)
Thus, we have three generalized reactions that depict the transformation of SO2, gas in the atmosphere and the ultimate deposition of this sulfur in the form of sulfites ( ) and sulfates (
 ). These reactions have relatively slow reaction rates, which allow for the transport of this pollutant over long distances. The concern for the downwind receptor site is how much deposition of sulfites and sulfates will occur on their site. This will be a function of the concentrations of sulfite/sulfate, as well as the deposition rate.
3.2. Modeling the Dynamic Acid Deposition System in Kosovo
For calculating acid deposition at a receptor site due to SO2 emissions from a source near Prishtina in Obiliq where are concentrate TPP Units A, B and in future Unit C, (Figures 7-9) many kilometers away, we must account for the emissions quantity, the dispersion of the emissions, the transformation of the emissions into acid, the travel time of the emissions to the receptor site, and the deposition rate of the acid. With several simplifying assumptions, however, we can model the expected deposition of  and
and  at various points between the source and receptor site. We are interested in determining the expected levels of deposition of sulfate and sulfite at our receptor site and the role that various mitigation policies or technologies may have on those levels. In modeling of this problem, we will make the following assumptions:
• The receptor site is directly downwind of the source site.
• The wind direction and wind velocity during the modeling period are constant.
• Emissions rate of SO2 from the TPP Units A, B, C and from Transport is constant.
• Constant natural inflow of SO2 into SO2 reservoir due to various natural processes.
• Assume a one-time inflow of SO2 from the Industrial Complex in Obiliq. The TPP will continue to pollute sub-sequent parcels of air that pass overhead during later time periods. The pollution from the electricity production system and from mobile sources is used to calculate the conditions in the parcel of air during the first period. Assume a one-time inflow of SO2 from the Industrial Complex in Obiliq. The TPP will continue to pollute subsequent parcels of air that pass overhead during later time periods. The pollution from the electricity production system and from mobile sources is used to calculate the conditions in the parcel of air during the firstperiod.
We can begin to address the transport problem by first identifying a stock of SO2 in the atmosphere. The primary contributor to this stock is a onetime influx of SO2 from sources TPP Units A, B and in future Unit C and from mobile sources somewhere upwind of a receptor site [13]. We can picture this stock as a parcel of air of a
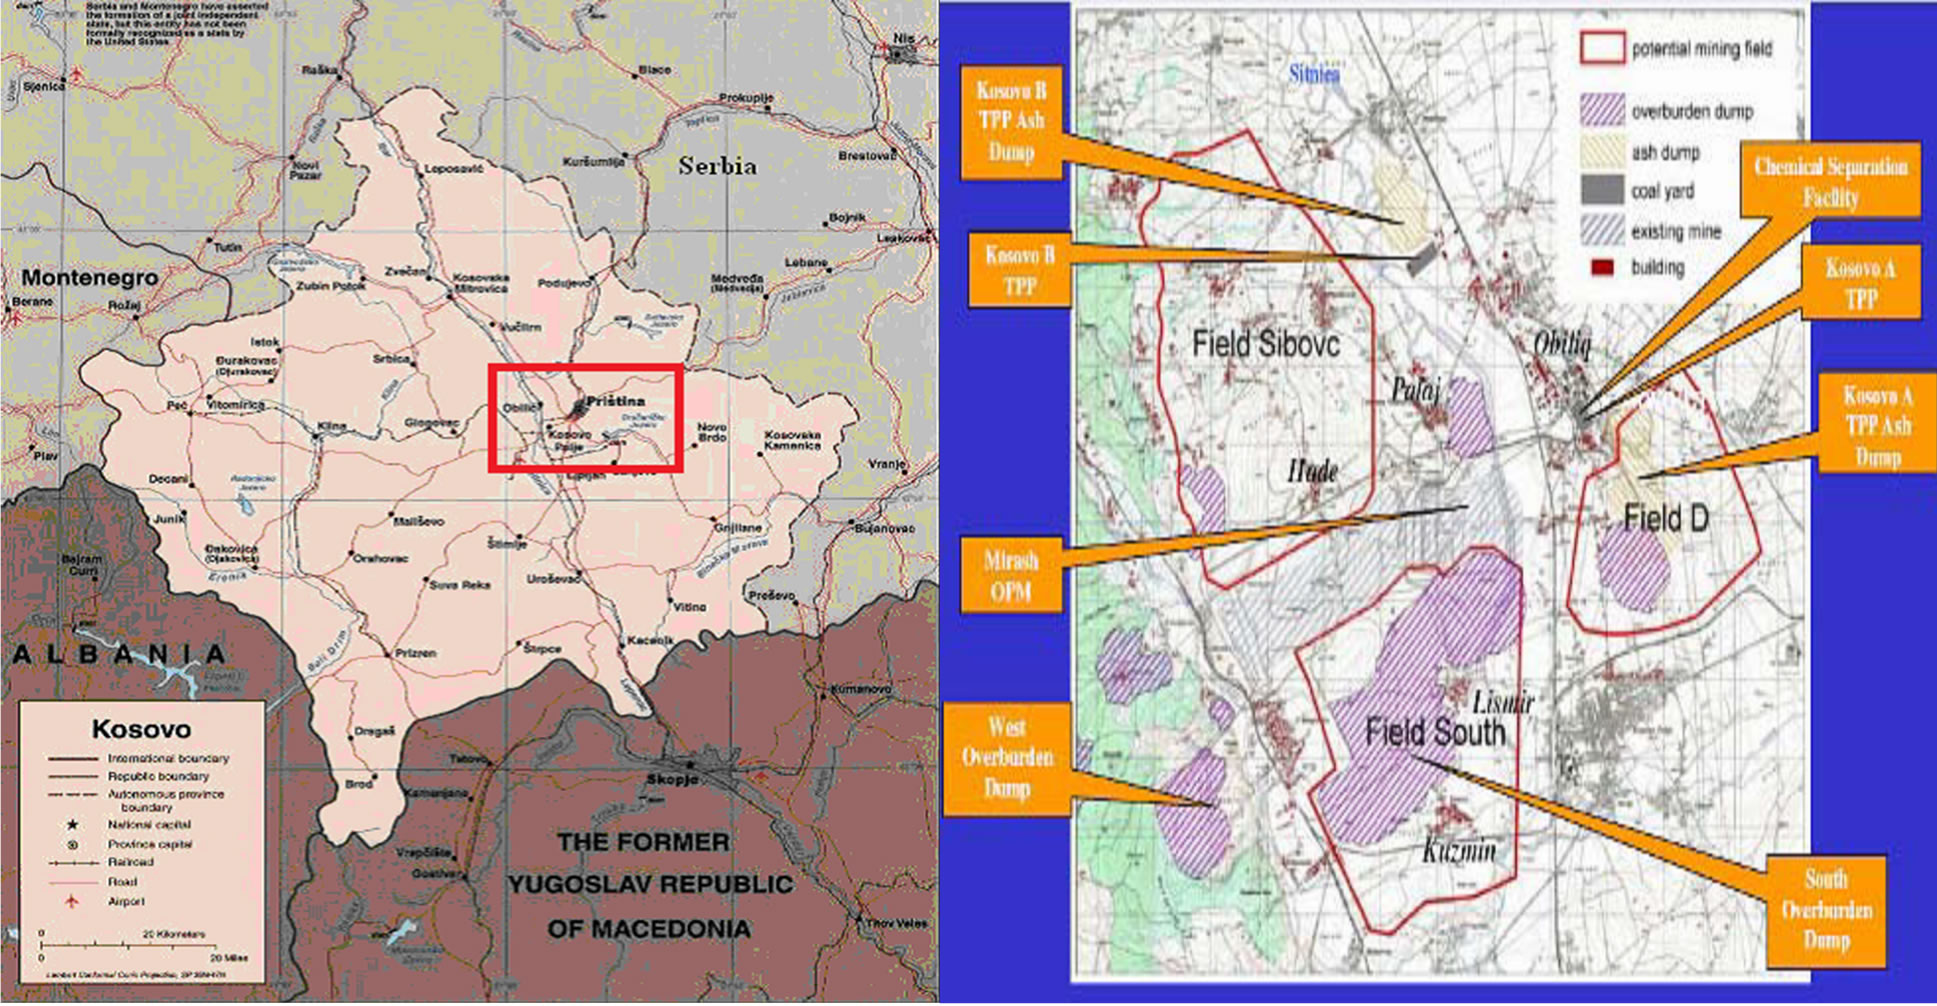
Figure 7. The map of Kosovo and location of TPP units A, B and in the future for units C near Prishtina (the capital of Kosovo) in Obiliq (source: MEM).
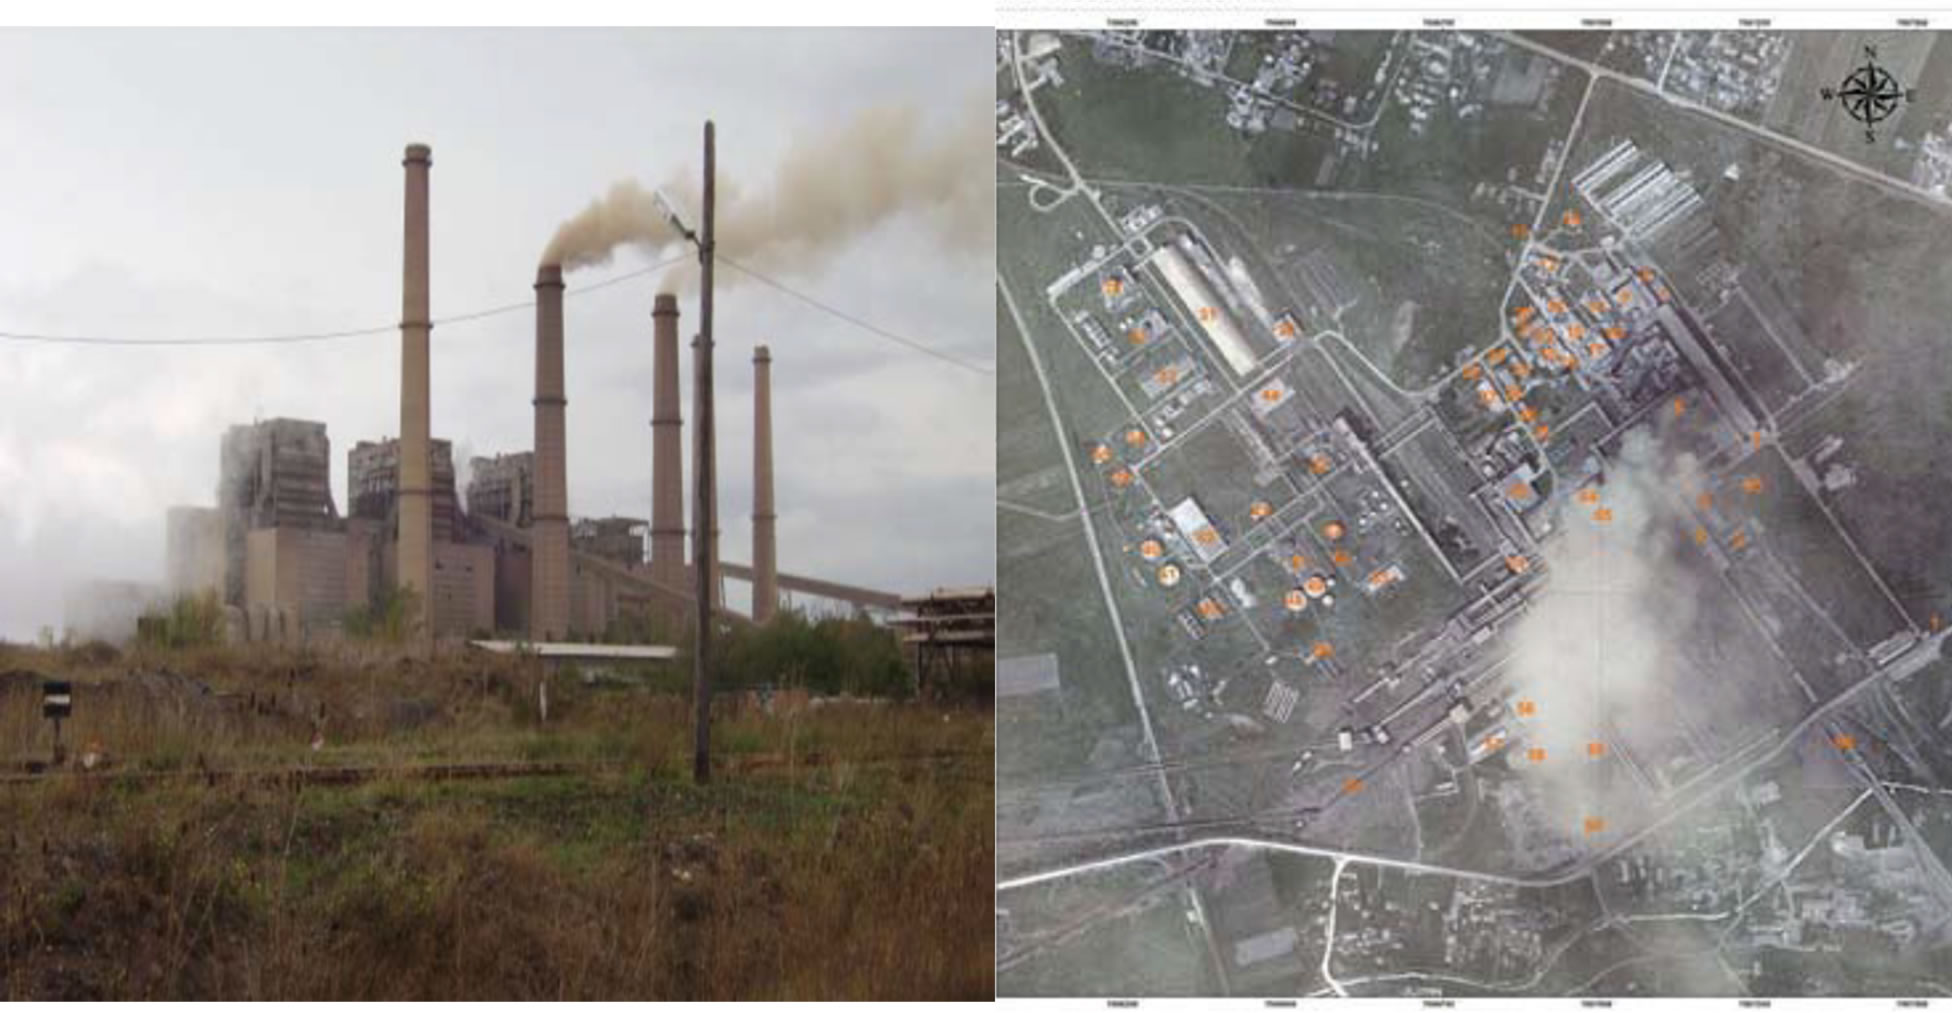
Figure 8. TPP units a flue gas and sites plan (source: MEM).
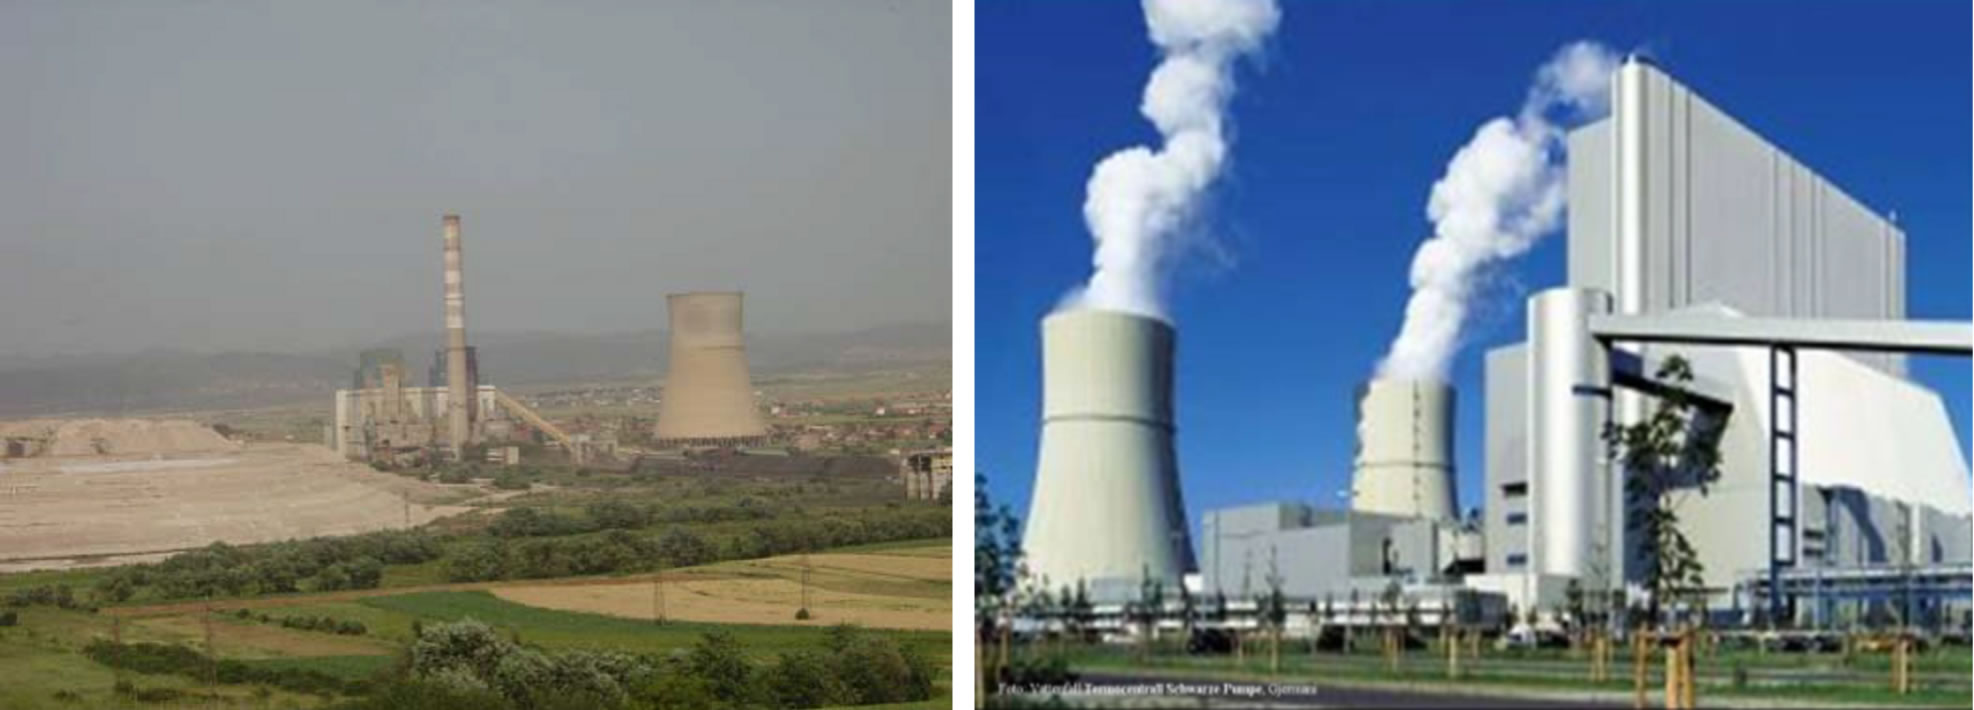
Figure 9. TPP units B and C. The photo for unit C is from water fall TPP in Germany (source: MEM).
given volume (150 × 150 × 100) m3 with a certain mass of whose concentration is given by the emissions rate of the source and other natural inflows.
The parcel of air will begin to travel downwind form the source toward the receptor site. As it moves downwind, three dynamic effects will occur. The first effect is simply the addition of a natural inflow of SO2 into the reservoir due to natural occurring processes. The Natural Inflow is assumed to be constant over time and is identified as natural inflow = constant.
The second effect will be an outflow of SO2. Here, SO2 is being converted into SO3. This flow is identified as Transformation = k1SO2 (Equation (5)).
The third effect whereby SO2 is deposited as H2SO3 or . This flow is given mathematically by Sulfite Deposition = k2SO2 (Equation (7)).
Last, we will have an outflow associated with the SO3 reservoir as it is transformed and deposited as H2SO4 or SO4. This is also a donor-controlled flow, as shown in Figure 10.
The outflow is represented as sulfite deposition = k3SO3, (Equation (9)).
This model is written in the Stella software language [14] and is similar to Figure 10. Finally, we need to recognize that these processes occur over time in a parcel of air that being transported due to wind speed. Thus, we can translate time into distance based on the velocity of the wind. In this way, we can track the concentration, transformation, and deposition of SO2 over time and distance. In this problem, we want to understand relationships among these variables at the point where this parcel of air passes over the receptor site. We will determine the impact of SO2 sources on a receptor site downwind from those sources In particular, we wish to determine how increased concentrations of SO2 due to the new source will potentially affect SO3 and SO4 at the receptor site. From the preceding equations we know, depending on meteorological conditions that if SO2 and SO3 concentrations are high, then we can expect high depositions of sulfites and sulfates. Our model should also allow us to explore the impact of various technologies or policies that might reduce the deposition at the receptor site. The initial values for data in model are presented in Table 3.
The output of this model for two scenarios are presented in Figures 11-18.
From outputs of the model Figures 11-18, we can see that average sulfide  depositions from TPP Units and Transport in Kosovo on different time period depending on time traveling and distances of air parcel from sources to receptors in both scenarios (scenario 1 and scenario 2) varies linearly with changes in SO2 emissions from TPP units A, B and C and Transport.
Also average sulphate  depositions from TPP units and transport in Kosovo on different time period depending on time traveling and distances of air parcel from sources to receptors in both scenarios (scenario 1 and scenario 2) varies linearly with changes in SO3 emissions from TPP units A, B and C and transport.
According to scenario 1, when SO2 emissions from TPP units A, B, C and transport increase in year 2012, 2017 and 2025 in comparison with year 2003 for 32.65%, 17.18% and 33.65% respectively, average sulfide  depositions also varies with same percentage changes 32.66%, 17.19% and 33.36% respectively.
While when SO3 emissions from TPP units A, B , C and Transport increase in year 2012, 2017 and 2025 in comparison with year 2003 for 30.30%, 15.17% and 32.79% respectively, also average sulfate  depositions increase, varies with same percentage changes 30.31%, 15.19% and 32.80% respectively.
These percentage increases also varies with traveling time and distances of air parcel from sources to receptors.
According to scenario 2, when SO2 emissions from TPP units A, B , C and transport reduce in year 2017 and 2025 in comparison with year 2003 for –33.26% and –52.46% respectively, also average sulphide  varies with same percentage changes –33.26% and –52.46% respectively. While when SO3 emissions from TPP units A, B, C and Transport reduce in year 2017 and 2025 in comparison with year 2003 for –34.29% and –53.27% respectively, also average sulphate
  depositions decrease, varies with same percentage changes for –34.29% and –53.27% respectively. These percentage decreases also varies with traveling time and distances of air parcel from sources to receptors also.
From scenario 2 we could argue that if the emissions from TPP units and Transport in Kosovo are reduced about 50% in year 2025 the sulphate acid deposition averaged over a year would also decrease by 50%. Such an answer implies linear dependence between SO2 (SO3) emissions and sulphide (sulphate) depositions.
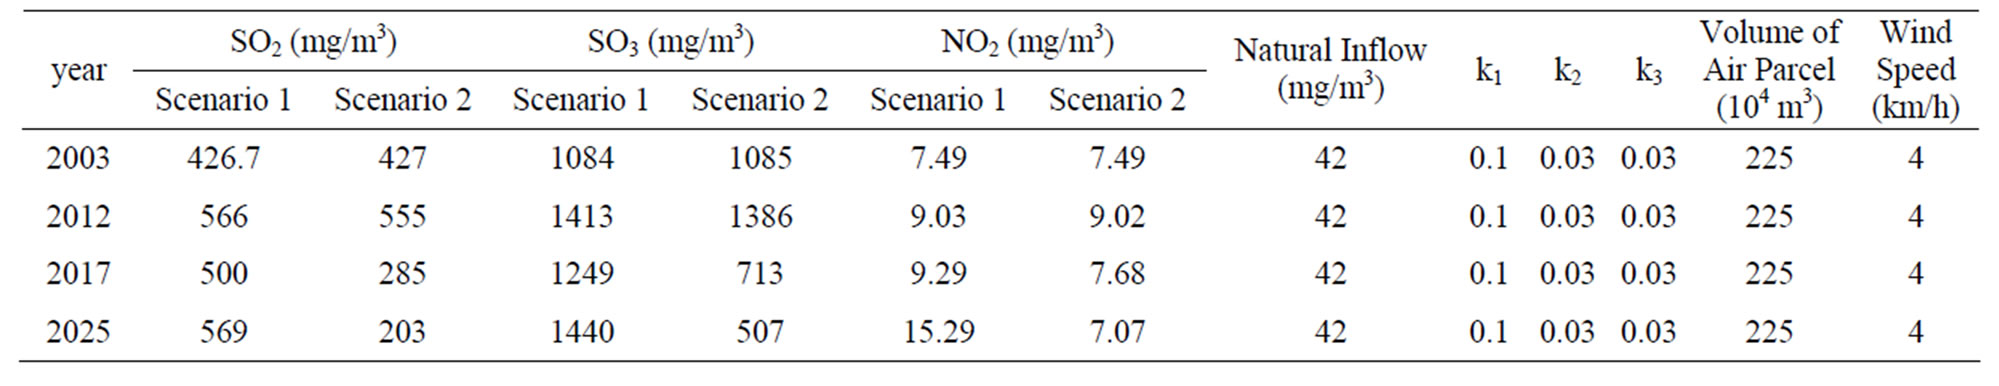
Table 3. Initial data value for acid deposition emission systemand break down of NO2 in Kosovo.
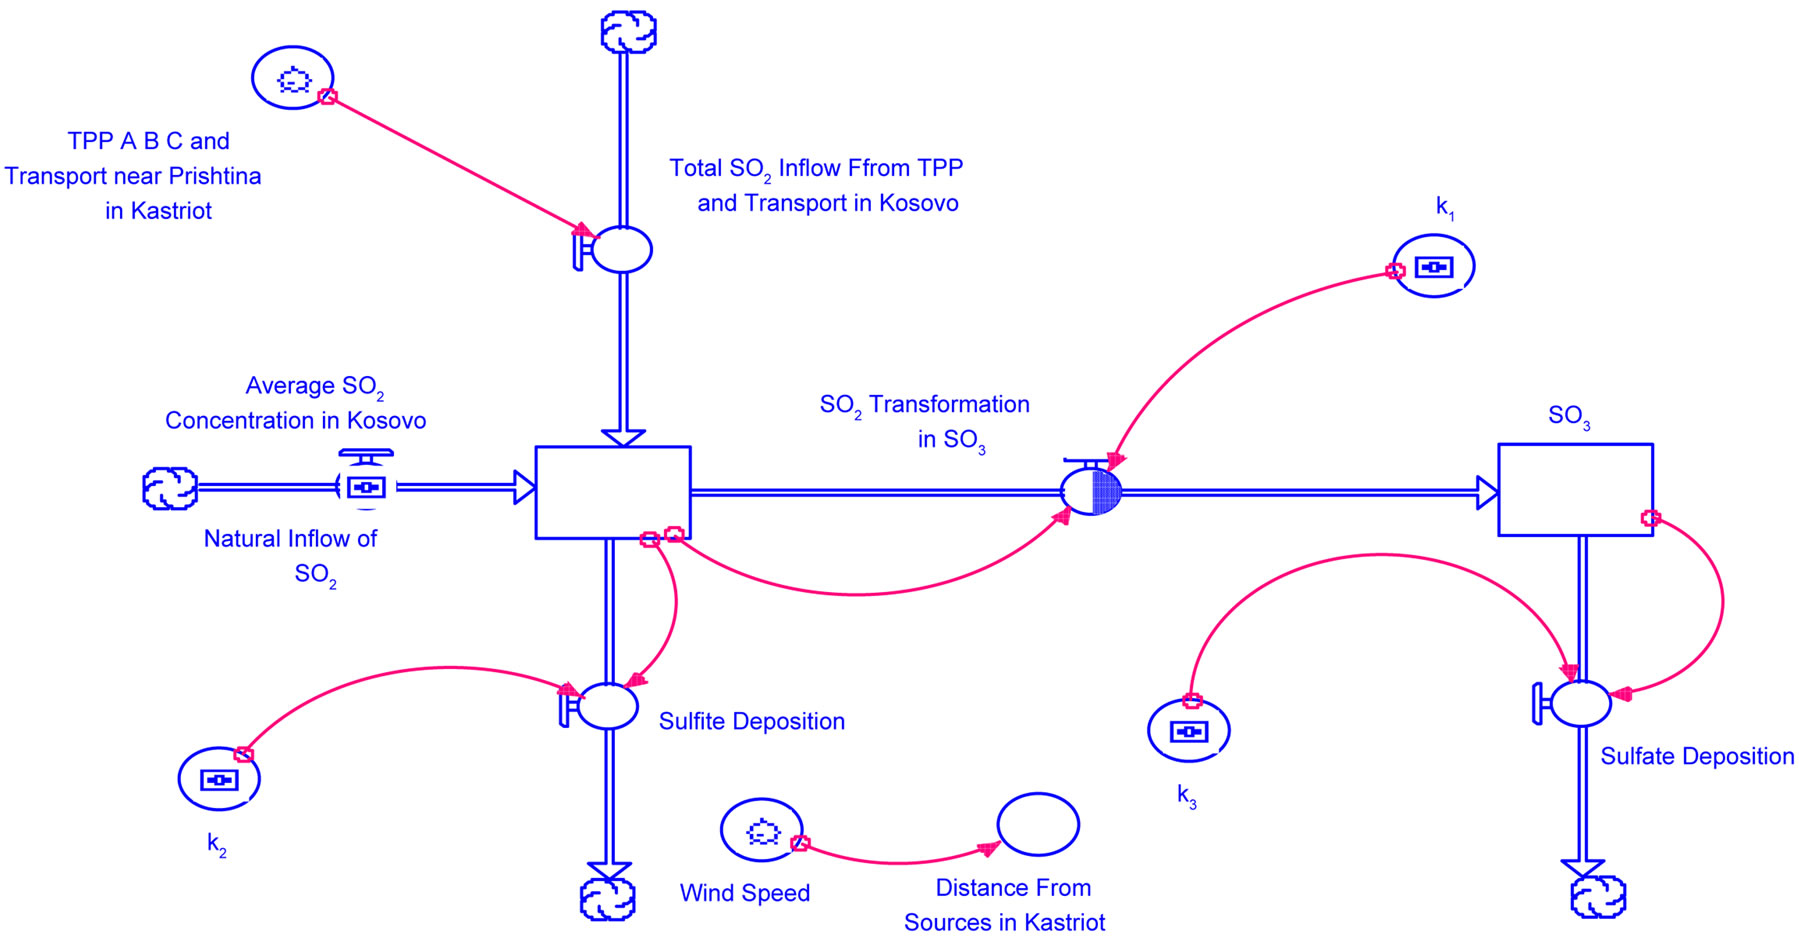
Figure 10. Modeling the dynamic acid deposition system in Kosovo.
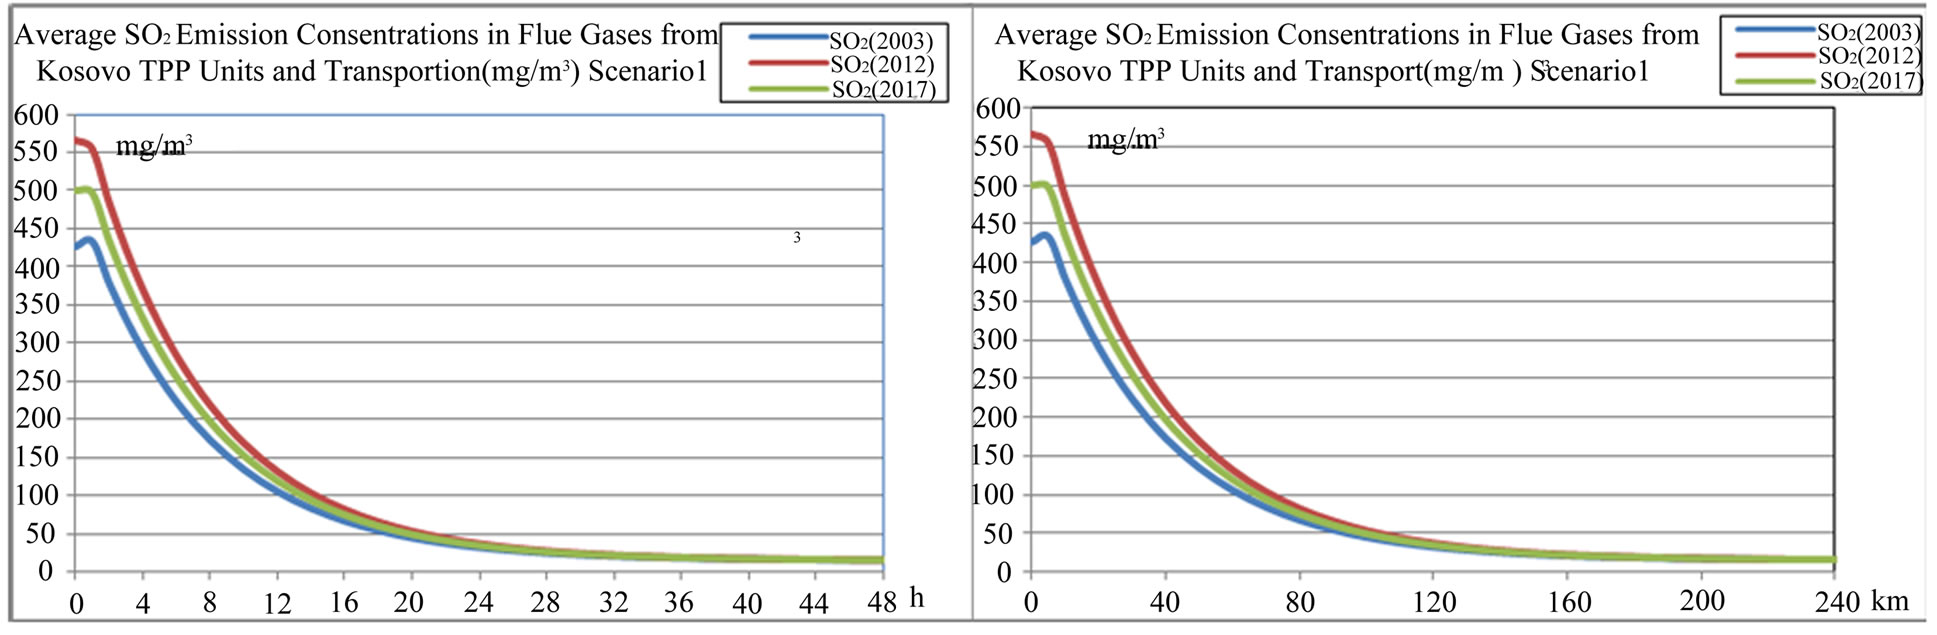
Figure 11. Average SO2 concentration in flue gases from TPP units and transport in Kosovo on different time period depending on time traveling and distances of air parcel from sources to receptors scenario 1.
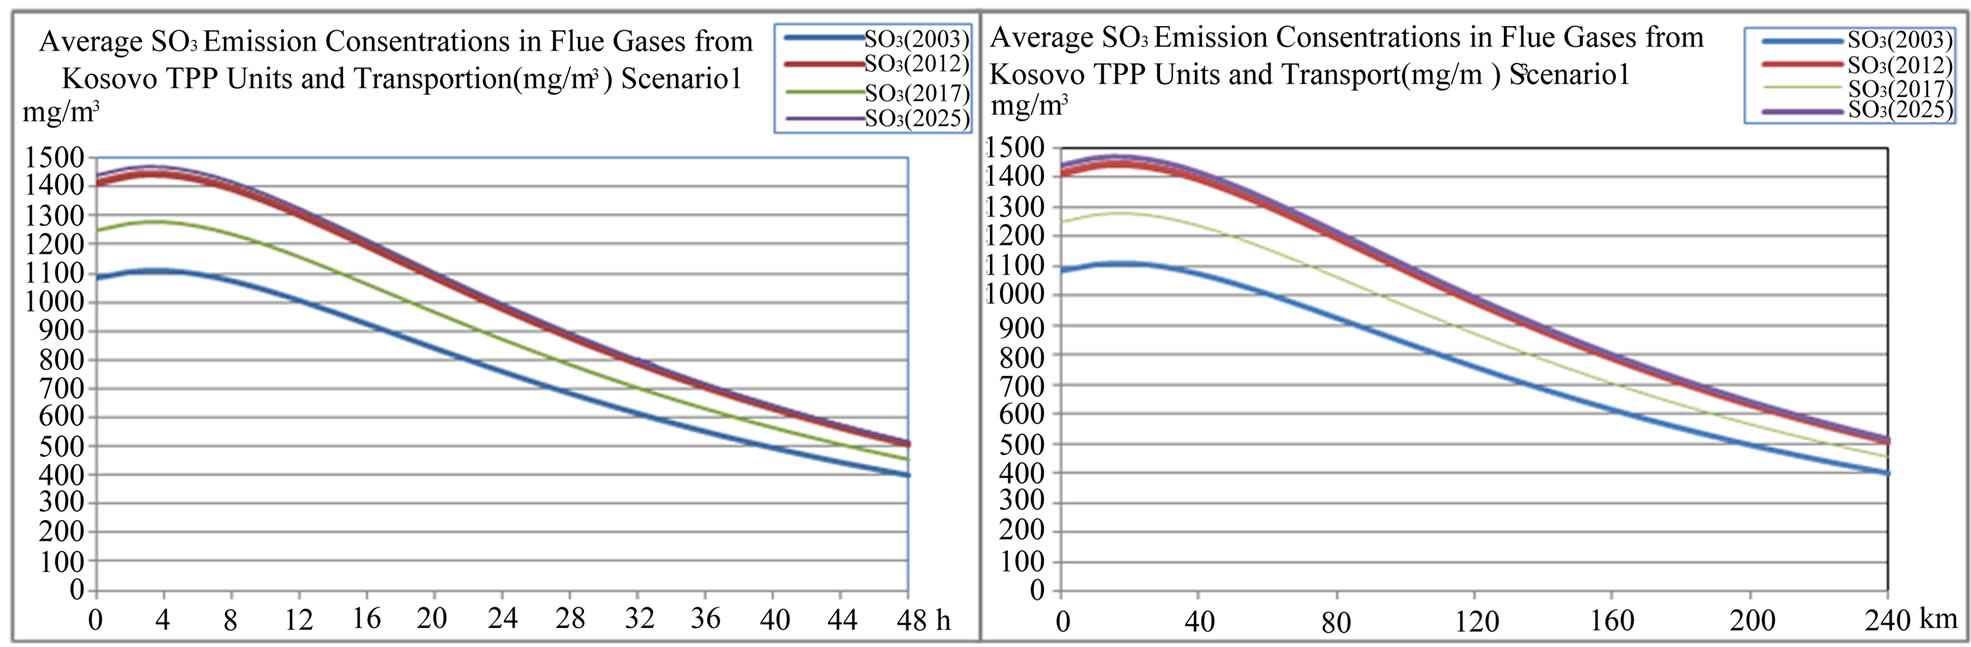
Figure 12. Average SO3 concentration in flue gases from TPP units and transport in Kosovo on different time period depending on time traveling and distances of air parcel from sources to receptors scenario 1.
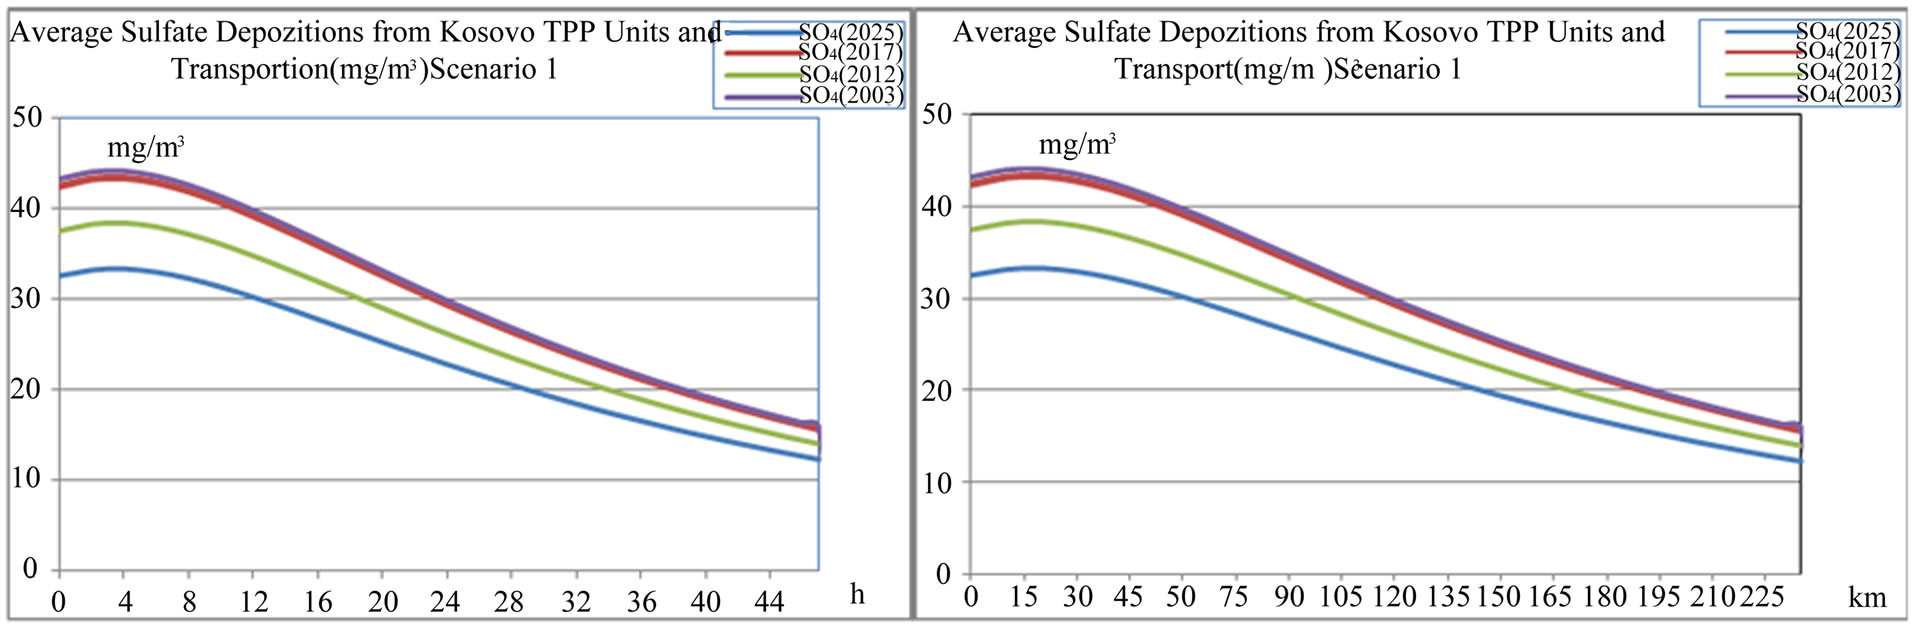
Figure 13. Average sulfate  depositions from TPP units and transport in Kosovo on different time period depending on time traveling and distances of air parcel from sources to receptors scenario 1.
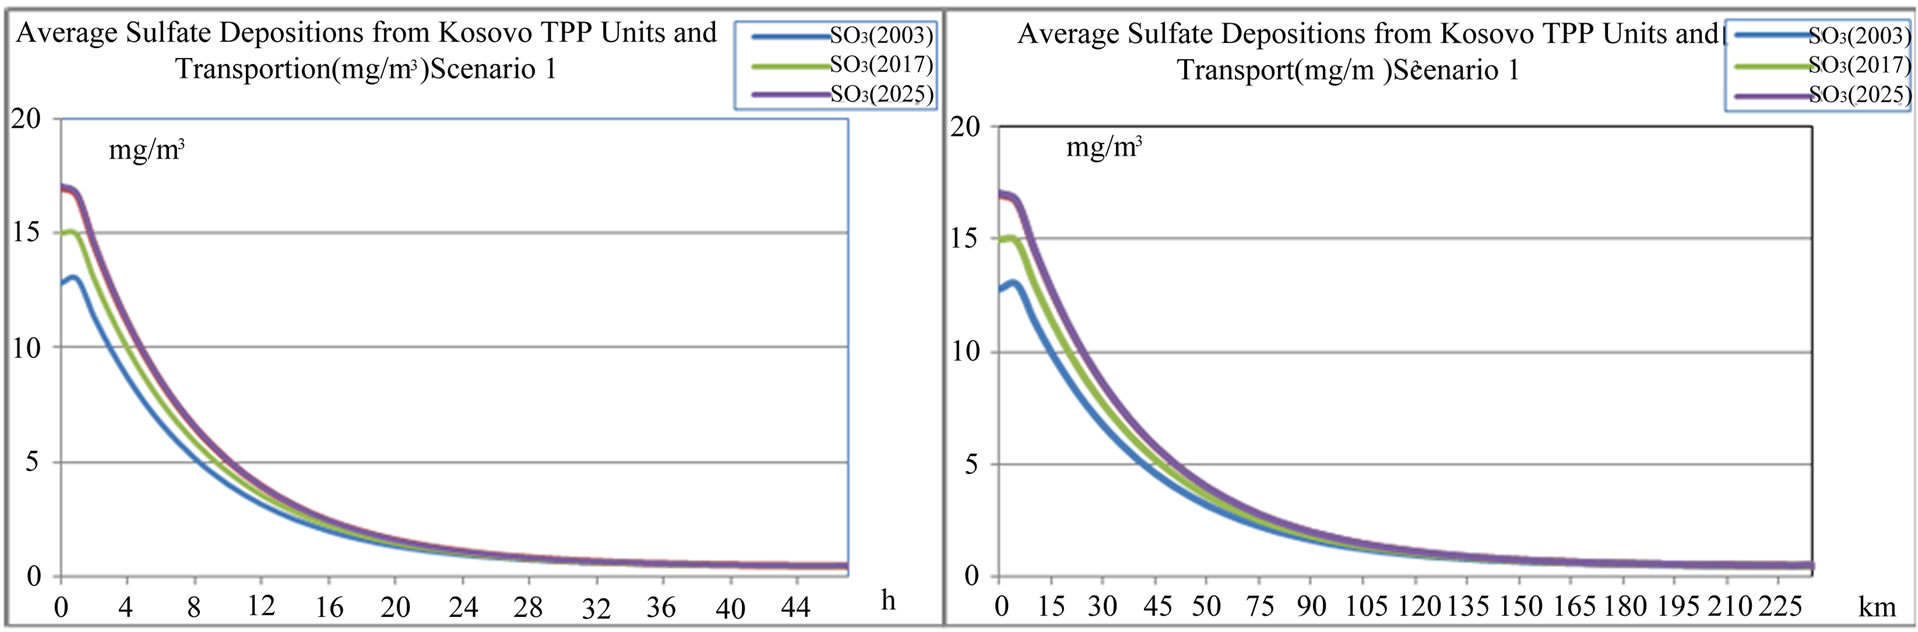
Figure 14. Average sulfide  depositions from TPP units and transport in Kosovo on different time period depending on time traveling and distances of air parcel from sources to receptors scenario 1.
4. Photo-Oxidant Modeling
Photo-oxidants are a class of secondary air pollutantsformed from some of the primary pollutants emitted by fossil fuel combustion. They irate and destroy (oxidize) the respiratory tract, eyes, skin, animal, organs, vegetation tissues and materials and structures. The major representative of this class of chemicals is ozone O3. Ozone (O3) is a photochemical oxidant that is the most important component of photochemical smog [15]. The only precursor that can initiate ozone formation in the troposphere is nitrogen dioxide NO2. The total NO2

Figure 15. Average SO2 concentration in flue gases from TPP units and transport in Kosovo on different time period depending on time traveling and distances of air parcel from sources to receptors scenario 2.
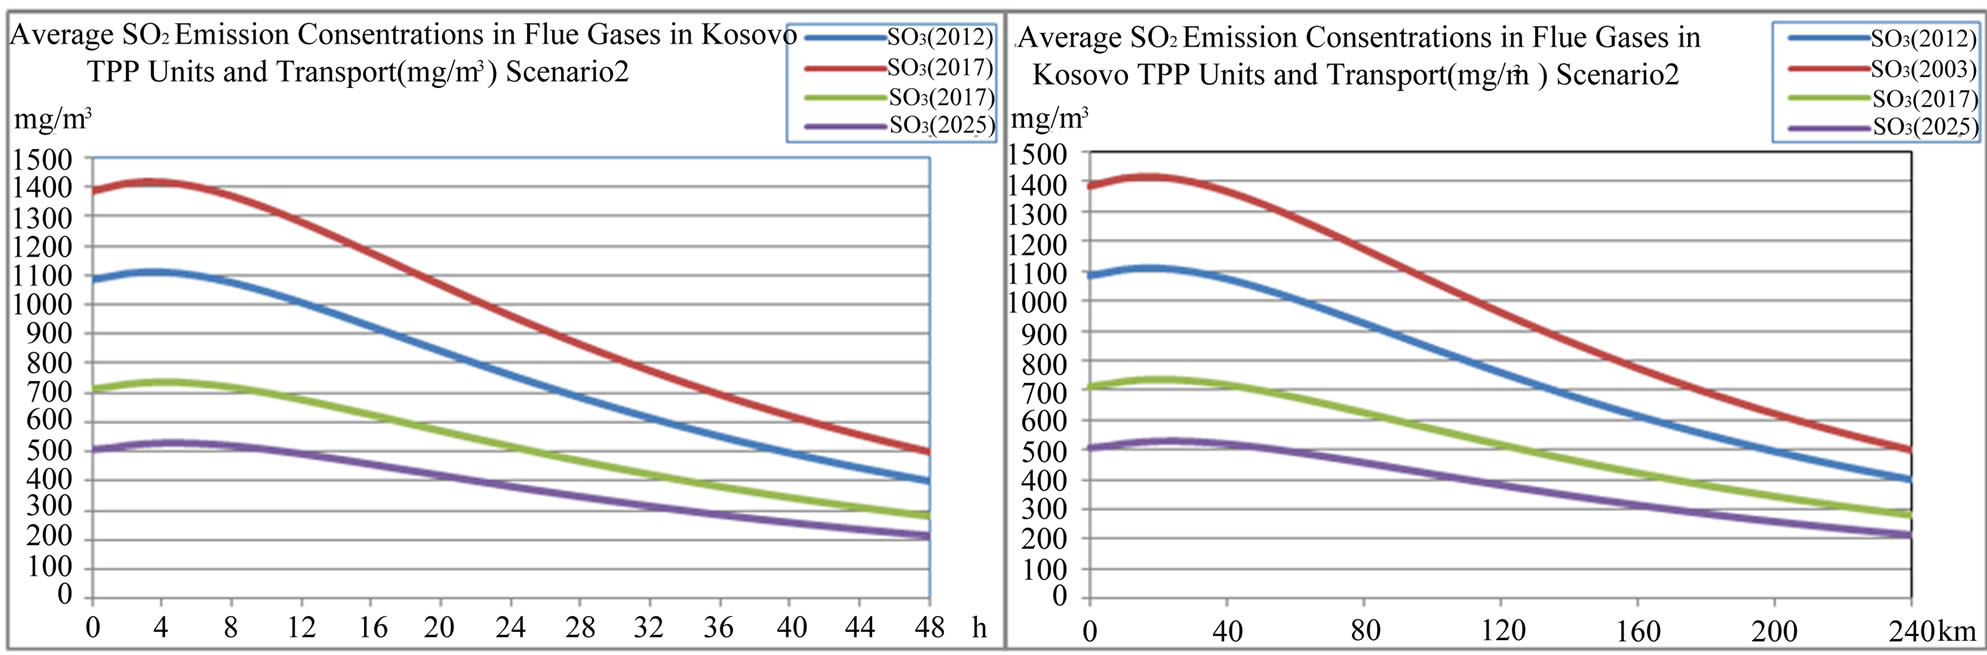
Figure 16. Average SO3 concentration in flue gases from TPP units and transport in Kosovo on different time period depending on time traveling and distances of air parcel from sources to receptors scenario 2.
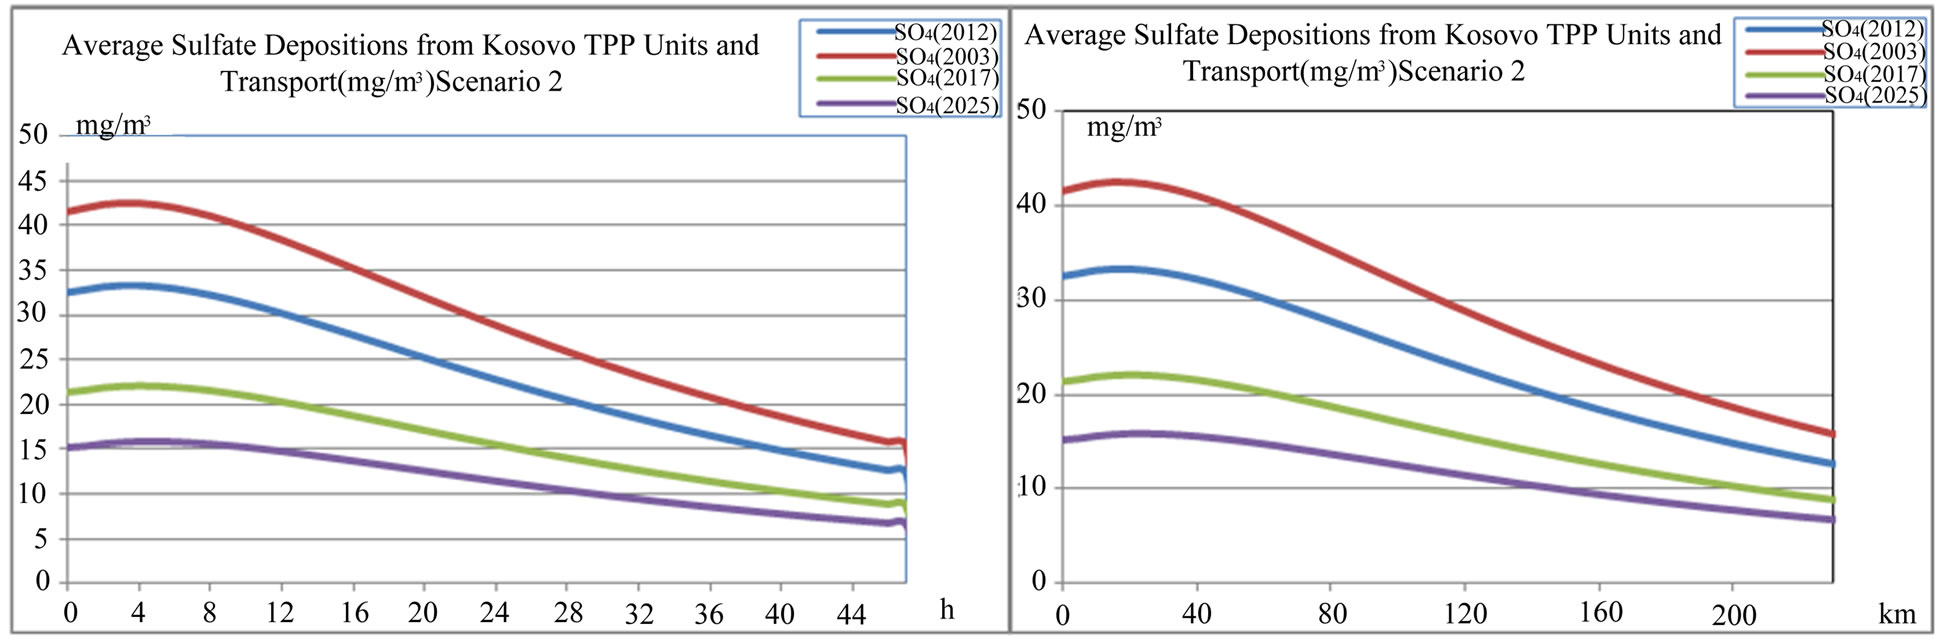
Figure 17. Average sulfate  depositions from TPP units and transport in Kosovo on different time period depending on time traveling and distances of air parcel from sources to receptors scenario 2.
emission rate and average hour NO2 emission concentration rate (mg/m3·h) in Kosovo scenario1 and scenario 2 is presented in Figures 19 and 20.
Tropospheric ozone is created by the breakdown of the anthropogenic pollutant nitrogen dioxide (NO2). Sunlightcontributes to the formation of photochemical smog by triggering the breakdown of NO2. This process happens, simplified as follows. Sunlight causes nitrogen dioxide to break down into nitrogen oxide and mo natomic oxygen, O. This O atom combines with O2 to form ozone O3.

Figure 18. Average sulfide  depositions from TPP units and transport in Kosovo on different time period depending on time traveling and distances of air parcel from sources to receptors scenario 2.
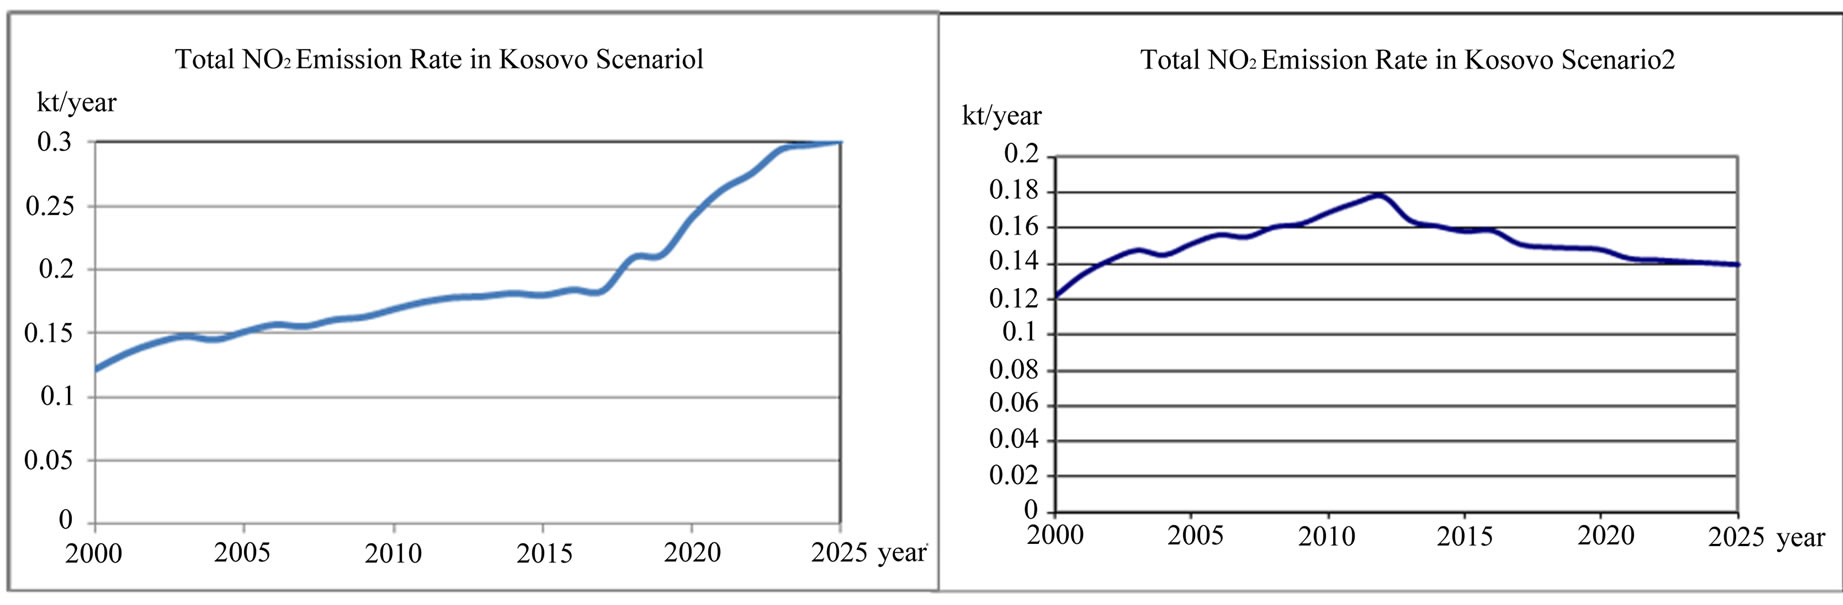
Figure 19. Total NO2 emission rate in Kosovo scenario 1 and scenario 2.

Figure 20. Average hour NO2 emission concentration rate in Kosovo (mg/m3·h) scenario 1 and scenario 2.
Reactions Involving O3
Nitrogen dioxide gas can photo-dissociate in sunlight, at wavelengths shorter than 420 nm.
The resulting atomic oxygen combines with molecular oxygen to form ozone:
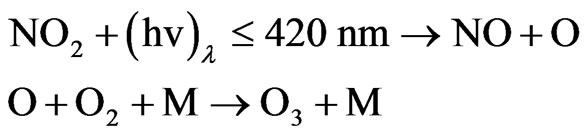
where M is an inert molecule which is necessary to bring about the combining of atomic and molecular oxygen.
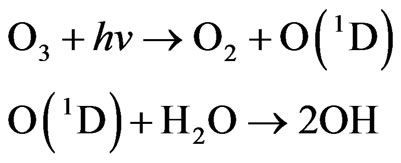
Than we have the photolysis of ozone at wavelengths < 319 nm to yield the electronically excited O(1D) atom, followed by O(1D) reaction with H2O to Generate two OH radicals.
Hydroxyl radicals react with CH4
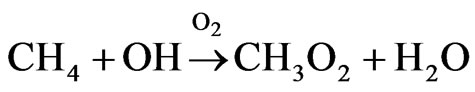
Under tropospheric conditions, the methylperoxy radical can react with NO, NO2, and HO2 radicals, and other organic peroxy (RO2) radicals.
When NOx levels are sufficiently high that reaction of the peroxy radicals HO2 and CH3O2 with NO predominates over peroxy radical self-reactions.

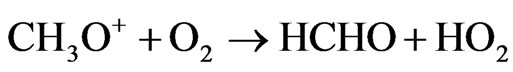


Net: 
Two molecules of ozone result from each CH4 molecule. In Figure 21. is presented modeling break down of NO2 into the NO and O in two scenarios (scenarios 1 and scenarios 2). The initial data value for NO2 (mg/m3)
in Kosovo for two scenarios are presented in Table 2. The output of the model is shown in Figure 22.
According to scenario 1, when NO2 emissions from TPP units A, B, C and transport increase in year 2012, 2017 and 2025 in comparison with year 2003 for 20.56%, 24.03% and 104.14% respectively, the contribution to the NO concentration in troposphere will increase with same percentage changes 20.41%, 22.45% and 102.04% respectively, the contribution to the O concentration in troposphere will increase with percentage changes 23.08%, 26.92% and 107.69% respectively and as a consequence an increase of photochemical ozone. That means more chemical smog in Kastriot and Prishtina.
According to scenario 2, when NO2 emissions from TPP units A, B, C and transport decrease in year 2025 in comparison with year 2003 for −5.61%, the contribution to the NO concentration in troposphere will decrease −6.12% respectively, while the contribution to the O concentration in troposphere will decrease with −3.85% respec-

Figure 21. Photo-oxidant modeling in Kosovo.

Figure 22. Break down of NO2 into the NO and O from TPP units and transport in Kosovo on different time period depending on time scenario 1 and scenario 2.
tively and as a consequence an decrease of photochemical ozone. That means les chemical smog in Obiliq and Prishtina.
5. Conclusions
In this paper we modeled the impact of SO2 and NO2 emissions from energy system and transport in Kosovo on acid deposition and chemical smog locally. In model we consider the role of SO2 and NO2 pollution control technologies on mitigating these impacts.
From outputs of the model for dynamic acid deposition system in Kosovo we conclude that average sulfide  depositions from TPP Units and Transport in Kosovo on different time period depending on time traveling and distances of air parcel from sources to receptors in both scenarios (scenario 1 and scenario 2) varies linearly with changes in SO2 emissions from TPP units A, B and C and Transport. Also average sulphate
  depositions from TPP units and transport in Kosovo on different time period depending on time traveling and distances of air parcel from sources to receptors in both scenarios (scenario 1 and scenario 2) varies linearly with changes in SO3 emissions from TPP units A, B and C and transport. From scenario 2 we could argue that if the emissions from TPP units and Transport in Kosovo are reduced about 50% in year 2025 the sulphate acid deposition averaged over a year would also decrease by 50%. Such an answer implies linear dependence between SO2 (SO3) emissions and sulphide (sulphate) depositions.
From outputs of hoto-oxidant modeling in Kosovo we conclude According to scenario 1, when NO2 emissions from TPP units A, B, C and transport increase in year 2012, 2017 and 2025 in comparison with year 2003 for 20.56%, 24.03% and 104.14% respectively, the contribution to the NO concentration in troposphere will increase with same percentage changes 20.41%, 22.45% and 102.04% respectively, while the contribution to the O concentration in troposphere will increase with percentage changes 23.08%, 26.92% and 107.69% respectively and as a consequence an increase of photochemical ozone. That means more chemical smog in Kastriot and Prishtina.
According to scenario 2, when NO2 emissions from TPP units A, B, C and transport decrease in year 2025 in comparison with year 2003 for −5.61%, the contribution to the NO concentration in troposphere will decrease −6.12% respectively, while the contribution to the O concentration in troposphere will decrease with –3.85% respectively and as a consequence an decrease of photochemical ozone. That means less chemical smog in Obiliq and Prishtina.
REFERENCES
- J. H. Seinfled and S. N. Pandis, “Atmospheric Chemistry and Physics,” Wiley, Hoboken, 1998.
- G. P. Howells, “Acid Rain and Acid Waters,” E. Horwood, New York, 1990.
- MEZH (Ministry of Economoc Development in Kosovo). http://www.ks-gov.net/mezh
- S. Kabashi, S. Bekteshi, S Ahmetaj, G. Kabashi, D. Najdovski, A. Zidanšek and I. Šlaus, “Effects of Kosovo’s Energy Use Scenarios and Associated Gas Emissions on Its Climate Change and Sustainable Development,” Applied Energy, Vol. 88, 2011, pp. 473-478.
- EPA, “Compilation of Air Pollutant Emission Factors AP-42,” 5th Edition, US Environmental Protection Agency, Office of Air Quality Planning and Standards, 2003. www.epa.gov/ttn/chief/ap42/index.html
- ESTAP (Energy Sector Technical Assistance Project), “World Bank Grant No.TF-027791,” Kosovo, 2002. www.ero-ks.org/ESTAP%20I/Executive_Summary.pdf
- S. Kabashi, S. Bekteshi, S. Ahmetaj, G. Kabashi, G. Kabashi, R. Blinc, A. Zidanšek and I. Šlaus, “Greenhouse Gas and Air Pollution Emissions and Options for Reducing from the Kosovo Transportion Sektor: Dynamic Modelling,” Management of Environmental Quality: An International Journal, Vol. 1, 2011, pp. 72-88.
- J. A. Fay, “Energy and Environment,” Oxford University Press, New York, 2002.
- R. Blinc, D. Najdovski, S. Bekteshi, S. Kabashi, I. Šlaus and A. Zidanšek, “How to Achieve a Sustainable Future for Europe,” Thermal Science, Vol. 12, 2008, pp. 19-25.
- A. Zidanšek, R. Blinc, A. Jeglič, S. Kabashi, S. Bekteshi and I. Šlaus, “Climate Changes, Bio Fuels and the Sustainable Future,” International Journal of Hydrogen Energy, Vol. 34, No. 16, 2009, pp. 6980-6983
 .
. - N. B. Bunce, “Environmental Chemistry” 2nd Edition, Wooers Publishing, Winnipeg, 1994.
- D. Bunce, “Environmental Science,” 1994.
- L. Deaton and D. Winebrake, “Dynamic Modelling of Environmental Systems,” Springer Science Business Media Inc., New York, 2000, pp. 174-186.
- STELLA, Copyright©1985-2010 by ISEE Systems, Inc. www.iseesystems.com
- M. Ruth and B. Hannon, “Dynamic Modelling,” Springer Science Business Media Inc., New York, 2001, pp. 122- 128.
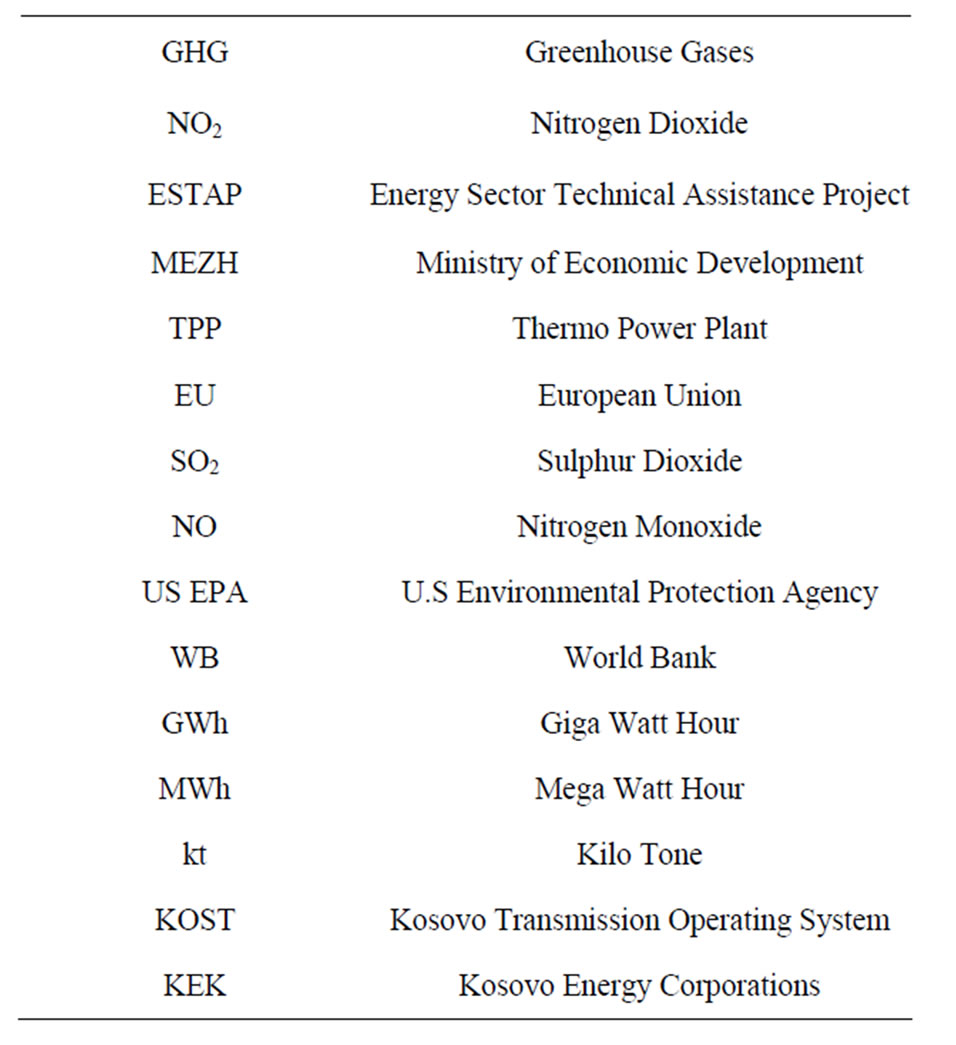
Abbreviation