American Journal of Climate Change
Vol.2 No.1(2013), Article ID:29092,12 pages DOI:10.4236/ajcc.2013.21004
Case Study: ENSO Events, Rainfall Variability and the Potential of SOI for the Seasonal Precipitation Predictions in Iran
Physics Department, Hormozgan University, Bandar Abbas, Iran
Email: abolhassang@yahoo.com, noorafshan.maryam@yahoo.com
Received September 26, 2012; revised November 20, 2012; accepted November 29, 2012
Keywords: ENSO; SOI; Rainfall Variability; Seasonal Precipitation Predictions
ABSTRACT
The studies in recent decades show that many natural disasters such as tropical severe storms, hurricanes development, torrential rain, river flooding, and landslides in some regions of the world and severe droughts and wildfires in other areas are due to El Nino-Southern Oscillation (ENSO). This research aims to contribute to an improved definition of the relation between ENSO and seasonal (autumn and winter) variability of rainfall over Iran. The results show that during autumn, the positive phase of SOI is associated with decrease in the rainfall amount in most part of the country; negative phase of SOI is associated with a significant increase in the rainfall amount. It is also found that, during the winter time when positive phase of SOI is dominant, winter precipitation increases in most areas of the eastern part of the country while at the same time the decreases in the amount of rainfall in other parts is not significant. Moreover, with negative phase of SOI in winter season the amount of rainfall in most areas except south shores of Caspian Sea in the north decreases, so that the decrease of rainfall amount in the eastern part is statistically significant.
1. Introduction
Islamic Republic of Iran has arid and semiarid climates and for which the occurrence of rainfall is unreliable. The country’s average annual precipitation is estimated about 250 mm which is less than a third of the world’s average precipitation. Two mountain ridges, the Alborz and Zagros, which run from northwest corner to east and southeast of the country, play an influential role in amount and special distribution of precipitation. While the total annual precipitation in mountainous areas and south shores of the Caspian Sea is more than 1500 mm, the central and southern parts of Iran have less than 60 mm of precipitation annually. Droughts and floods, which are common in many parts of the country, can significantly effects the people lives, agriculture, livestock, forestry, water resources, tourism construction, industry and many other local activity. It has long been a matter of debate whether and how the El Nino Southern Oscillation (ENSO) warm and cold extremes influence Iranian rainfall. An early study by Nazemosadat (1999) shows the impacts of ENSO on the occurrence of autumnal drought in Iran [1]. Later work by Nazemosadat and Cordery revealed that the autumn rainfall in Iran negatively is correlated with ENSO [2]. Their relationships were found to be strongly and consistent over the southern foothills of the Alborz mountains, northwestern districts and central areas. In another study he (Nazemosadat, 2001) found that for the main parts of Iran, winter average SOI positively related with winter rainfall, but for a few stations cold events generally were coincided with low rainfall (drought). The other study, Soltani and Gholipor, evaluate lag-correlation between ENSO and rainfall and temperature in some selected Iranian stations with contrasting climates [3,4]. They found that the rainfall is negatively correlated with both SOI and NAO. A number of papers have indicated the ENSO related rainfall anomalies are found at a nation-wide scale in Mediterranean and Middle East regions also in other periods of the year [5-9]. Since autumn and winter rainfall contributes a major portion of Iranian water resources, the shortage of rainfall during these seasons are most important. Therefore, this paper aims to contribute to an improved definition of the relation between ENSO and seasonal (autumn and winter) variability of rainfall over Iran.
2. Data Preparation
In this study, two types of datasets, Southern Oscillation Index (SOI, one of the ENSO indicators) and monthlymean rainfalls are used. Monthly values of SOI index have been prepared for a 46-year period (1960-2005) from the Climate Prediction Center of the International US Weather organization [10].
The monthly-mean rainfalls have been taken for 40 synoptic stations, from Iran Meteorology Organization (IMO) website [11]. The desired stations have been selected based on the maximum duration and the least amount of missing data. The missing data are not reconstructed and are not considered in the calculations. Due to the unavailability of data, the record length of the precipitation time series was not consistent for all stations, varying from 35 to 46.
3. Methodology
The basic data used in this study were three-monthly mean rainfalls and the SOI index. The time series of autumn and winter rainfalls was obtained by averaging the 3-month values of precipitation. Best results were obtained by defining autumn from October to December (OND) and winter from January to March (JFM) [2]. The same averaging procedure was performed to provide the seasonal time series of SOI data. To investigate the impact of ENSO on precipitation, the following steps are performed, respectively.
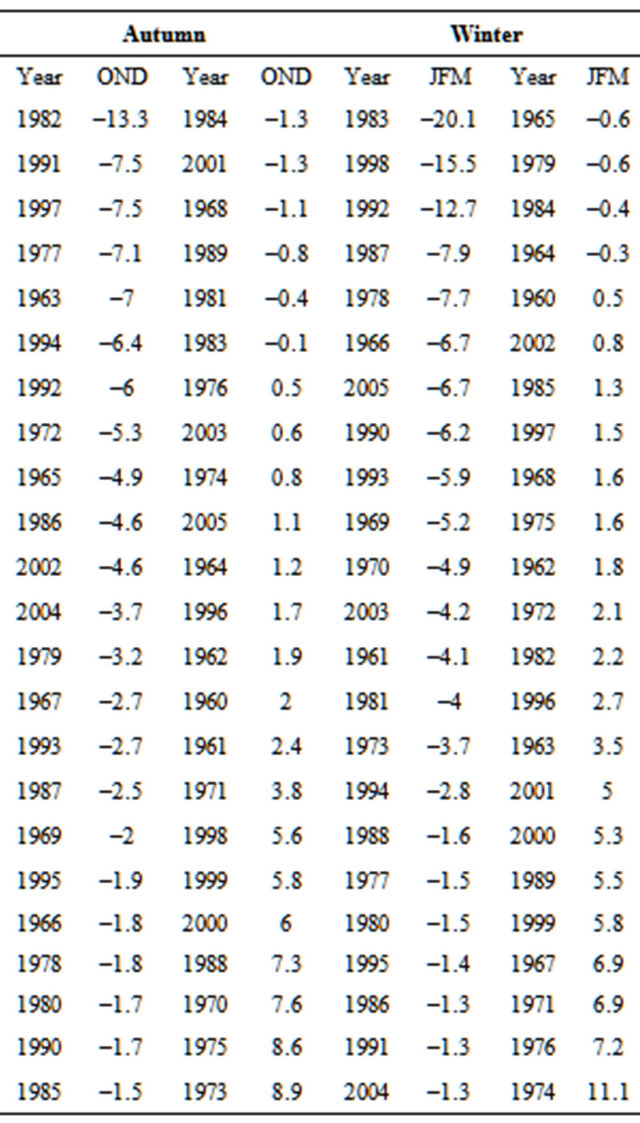
1) The positive and negative phases of SOI in each season are considered as the mean seasonal of this index and arranged in descending order (Table 1).
2) Then, one third of the highest and the lowest values of the SOI data are chosen as the positive and the negative phases of SOI, respectively. Therefore, during the studied period, 15 years are selected as the positive, 15 years as the negative and the remaining 16 years are selected as the neutral period of SOI.
3) In each year the average long-term seasonal precipitation in autumn and winter for all stations are calculated separately and represented by the symbols  and
and , respectively. Thus, for each station, there are two seasonal precipitation time series (positive and negative phase of seasonal precipitation).
4) The average precipitation values for the positive and the negative SOI phases are calculated from the 15- year time series of precipitation in each season, and are marked as  and
and 
for autumn and winter season respectively.
5) The ratio of average precipitation in the positive and negative phase of SOI in autumn and winter are calculated as  and
and .
.
This parameter indicates that the average precipitation during the dominance of positive SOI phase is higher (lower) than the average precipitation in negative SOI.
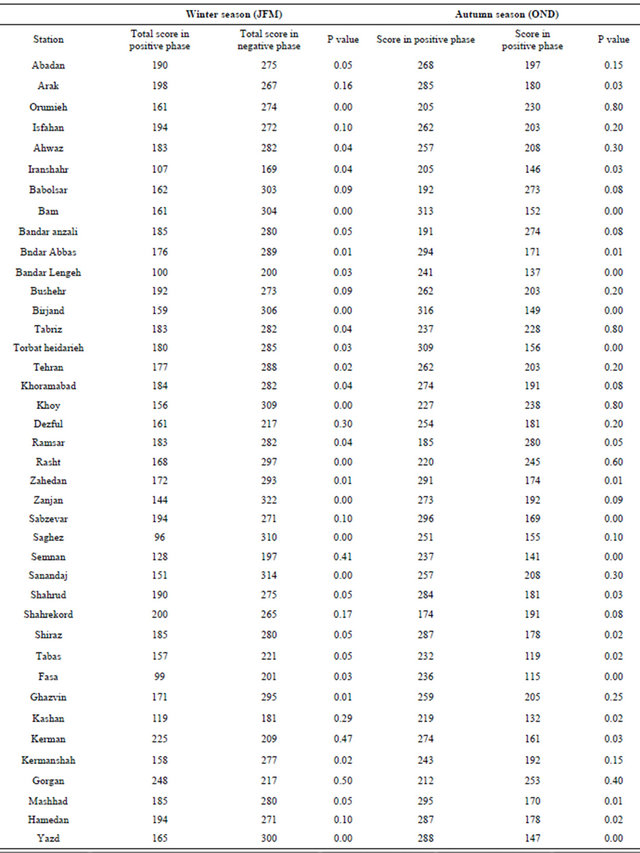
Table 1. Descending order of positive and negative SOI phases for autumn and winter in the studies period.
phase the values of this ratio are equal to 1, it shows that the SOI phenomenon has no effect on precipitation.
6) The ratio of average precipitation during the positive and negative phases in autumn as well as winterto the average long-term of seasonal precipitation
( and
and ) and
) and
( and
and )
)
are calculated. If this factor in each season was higher (lower) than 1, then the average precipitation in the positive phase of SOI is higher (lower) than the mean longterm precipitation in that season. When the values of this ratio are equal to 1, it shows that the SOI phenomenon has no effect on increasing or decreasing of rainfalls.
For example, in Abadan, the average precipitation  for winter is equal to 26.94 mm, the average winter precipitation in the positive phase
  is equal to 26.24 mm, and the average winter precipitation in the negative phase
  is equal to 31.02 mm.
Thus, the values of the ratios ,
,  and
and  are 0.85, 0.97 and 1.15, respectively. This means that dominance of the SOI phenomenon is an influencing factor in precipitation variability for Abadan, and it is expected that during of El Nino negative phase in winter is accompanied by decrease in precipitation by more than 20 percent than the long-term average.
7) In order to determine the occurrence probability of seasonal dry and wet periods during the positive and negative SOI phases, in each station, the percentage of years during the positive SOI phase whose precipitations are less than or equal to the average precipitation of that station in autumn are calculated as the occurrence probability of dry period for positive phase. Also, the percentage of years concurrent with dominance of negative SOI phase in the autumn whose precipitations are less than or equal to the average autumn precipitation are calculated as the occurrence probability of wet period for the negative SOI phase. The occurrence probability of dry period for negative SOI phase in winter are the percentage of years concurrent with dominance of negative SOI phase whose precipitations is less than or equal to the average long-term precipitation in winter. The occurrence probability of wet period during the negative SOI phase in winter are the percentage of years concurrent with dominance of positive SOI phase whose precipitations is less than or equal to the average long-term precipitation.
8) To evaluate significant differences in precipitation values during the positive and negative SOI phases, two indicators have been calculated.
a) Non-parametric Mann-Whitney test [12] that indicate in which stations the changes of SOI phase from positive to negative cause significant changes in precipitation. In this method, significant differences between the two groups of independent variables (precipitation values during the negative phase in group 1, positive phase in group 2) are evaluated. Therefore, at each station, during the positive or negative SOI phases, the precipitation values are ranked and the mean difference ranks are evaluated in each phase separately, and the significant levels of this difference is determined. P-value smaller than 0.05 indicates that there is a significant difference between precipitation values during the two SOI phases at the significance level of 95%. In other words, the significance of this test at each station shows the significant effect of SOI in occurrence of dry or wet periods. For example, in autumn in Ahwaz station, the precipitation rank during the negative and positive SOI phases are 18.80 and 12.20, respectively. P-value of this test is equal to 0.04 indicating a significant difference between the two above ranks. In other words, the displacement of SOI phases in autumn is a significant factor in the changing of winter precipitation in Ahwaz station. Higher rank of precipitation during the negative phase than the positive phase reflects the effect of dominance of negative phase in increasing precipitation values than the positive phase.
b) The exact non-parametric Fisher’s test that specifies the significant relationship between the occurrences of dry and wet periods during the positive and negative SOI phases [13]. In this test, dry and wet periods in each season are separately assessed with dominance of positive and negative SOI phases, respectively [P1]. To this end, a table with two rows and two columns (2 × 2) is prepared for each season at each station. The columns represent the positive and negative phases, and the rows indicate the frequency of dry and wet periods. It should be noted that in wet periods, the average precipitation for each phase is higher than the average long-term seasonal, and in dry periods, the average long-term for each of the phases is lower than the long-term average. If the average of each phase is equal to the average long-term, it shall be considered a dry period contractually. For example, for Ahwaz station, concurrent with dominance of the positive phase, the frequencies of drought and wet are 9 and 6 years, respectively. Similarly, the number of wet and dry periods during the negative phase are 10 and 5 years, respectively. The significance level of this test at 95% indicates statistical effects of positive and negative SOI phases in occurring wet and dry periods, respectively. In order to determine the regional distribution of precipitation in positive and negative SOI phases, interpolation is used. Dirks et al. [14] showed that interpolation is one of the best ways to determine the regional precipitation in catchment. There are many ways for interpolation such as Kriging, Spline, IDW2 [15]. Lancaster and Salkauskas [16] expressed that the data which are located in a less spatial distance from each other are more similar to each other than further points and accordingly, the IDW method was founded an appropriate method. In this study, precipitation oscillations in positive and negative phases of SOI in Iran are displayed in the GIS software. For this purpose, first a database associated with the ratios obtained from each station in each month and each phase is prepared in scale of 1:11,000,000.
4. Discussion
The effect of positive and negative SOI phases on precipitation in different regions of Iran in autumn and winter seasons are as follows:
4.1. Autumn (OND)
The geographical distribution of the ratio of the average precipitation during the positive to the negative phase of SOI in autumn  is presented in Figure 1. In most areas in Iran, this ratio is less than 1. This means that with displacement of the SOI phases, precipitation varies.
4.1.1. Positive SOI Phase
Figure 2 shows the geographical distribution of the ratio of average values of autumn precipitation during the positive SOI phase to the average long-term of autumn precipitation  in the stations studied.
In all stations except Semnan and Kashan, this ratio is less than one. This means that dominance of positive SOI phase in Iran reduces the precipitation values and causes a dry autumn period in the country. The lowest ratio related to the southeast region (0.25 - 0.60) is accompanied by 40 to 75 percent reduction in autumn precipitation. In other areas of the country, this ratio is in the range of 0.60 - 1.00, i.e. dominance of positive SOI phase is accompanied by 5 to 45 percent reduction in precipitation and autumn water resources. Kashan and Semnan stations in which this ratio is 5% larger than one, the Mann-Whitney test results (Table 2) are not significant, so, the importance of positive SOI phase is not accompanied by occurrence of a wet period in any region of Iran. The geographical distribution of occurrence probability of dry autumn period during the positive SOI phase in the different regions of the country is presented in Figure 3. The highest probability of drought in autumn during the positive SOI phase is associated with Sagghez, Iranshahr and Sanandaj. In these regions, during the positive SOI phase, the probability of dry periods is about 90 to 100 percent. In most areas of North West and South East and some of the southern regions, the probability of dry periods is about 55 to 75 percent.
The least probability is related to Gorgan station in the eastern coast of the Caspian Sea (about 50%), and there is no significant difference between the occurrence probability of dry and wet periods in this region with the occurrence of positive and negative SOI phases.
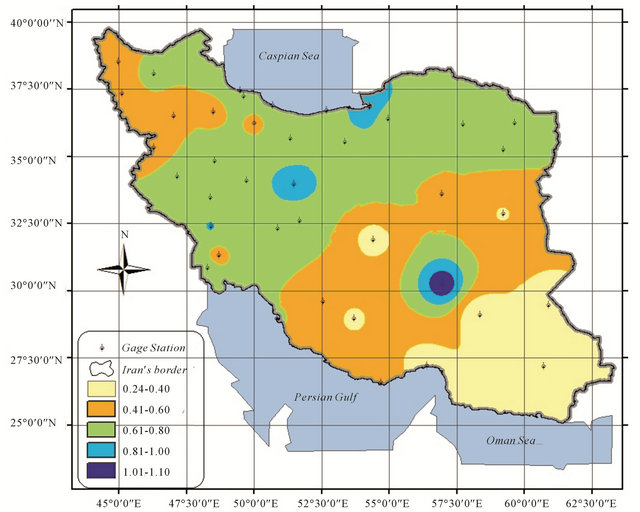
Figure 1. Geographical distribution of 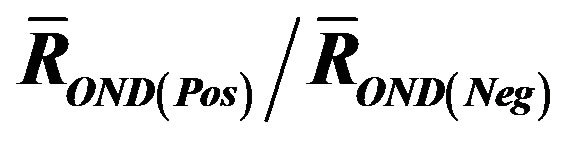 the 40 stations studied in Iran.
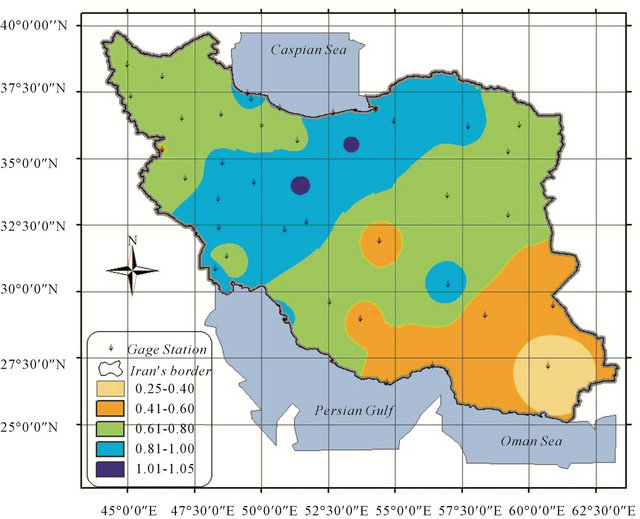
Figure 2. Geographical distribution of the ratio  in 40 stations studied.

Figure 3. Geographical distribution of the occurrence probability of dry autumn periods with the occurrence of positive SOI phase in 40 stations studied.
Table 2. Mann-Whitney test results in 40 synoptic stations.
4.1.2. Negative SOI Phase
Geographical distribution of the ratio of average autumn precipitation during the negative SOI phase to the average long-term autumn precipitation  is presented in Figure 4. During the negative SOI phase, for all stations except Iranshahr and Kerman, average precipitation values are greater than their average longterm in autumn. This means that the dominance of negative SOI phase increases the precipitation value, and leads to the wet autumn period and increased water resources. The highest value is related to Bam (1.87) that leads to 90 percent increase in the autumn water resources. In southern and central parts of the country, this ratio is in the range of 1.30 - 1.70. For most areas in the northern half and South West of the country, this ratio is in the range of 1.01 - 1.70.
In Kerman station, during the negative phase of SOI ,a reduction of 15% in water resources is seen. But as shown in Table 2 there is a no significant difference between precipitation values concurrent with dominance of either SOI phases. In Iranshahr, during the negative SOI phase, there is little reduction in precipitation, but is very low compared to other areas, as seen in Figure 5, (white circles). Therefore it can account for a rather small range in interpolation calculations and are negligible in regional analysis.
4.2. Winter (JFM)
Geographical distribution of the ratio of average precipitation during the positive SOI phase to the average precipitation with dominance of its negative phase
 is presented in Figure 5. In most areas except coastal areas of the Caspian Sea and the North West of Iran, it is greater than 1. The highest value is in Birjand in the North East, Bandar Abbas and Bandar Lengeh in the south which are in the range of 2.80 - 3.20. The lowest value is related to western half of the country in which ranges from 1.01 to 1.70. In the eastern half of the country, the ratio is mostly in the range of 1.70 - 2.80. Thus, in all areas except in coastal areas and the North West, it is expected that precipitation values during the positive SOI phase be higher than precipitation values for the negative SOI phase in winter.
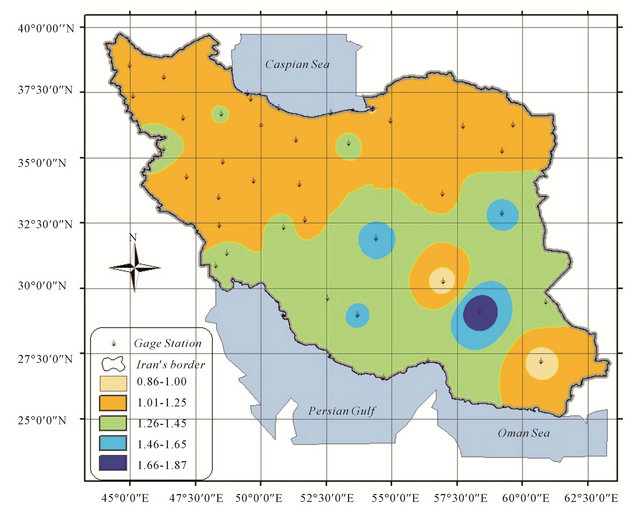
Figure 4. Geographical distribution of the  ratio in the 40 stations studied.
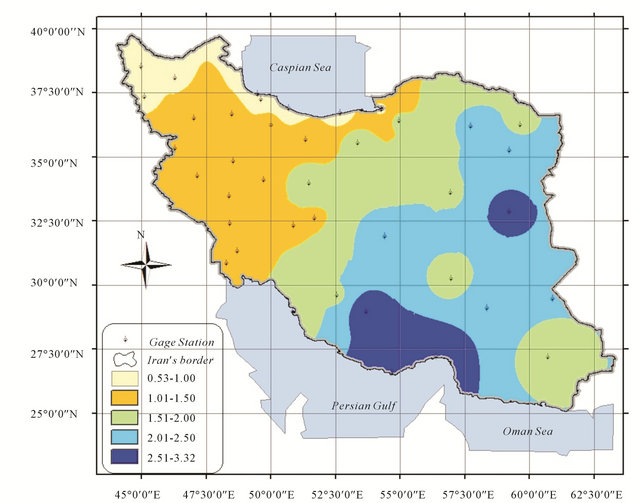
Figure 5. Geographical distribution of the ratio  in 40 stations studied in Iran.
4.2.1. Positive SOI Phase
Figure 6 shows the geographical distribution of the ratio of average winter precipitation during the positive SOI phase to the average long-term winter precipitation ( ) for 40 study stations. In all regions except the coastal regions of the Caspian Sea and the North West of the country, it is slightly larger than one. The highest value related to the eastern half of the country (1.11 - 1.17) that is lead to 10 to 20 percent increase in precipitation. In most regions of Central, South West, West and North regions of the country during the positive SOI phase in winter, the ratio ranges from 1.01 to 1.10. In some areas of North West as well as Tehran, Isfahan and Shahrekord during the positive SOI phase, this ratio is in the range of 0.88 - 1.00. The MannWhitney and Fisher test are for these stations positively correlated with SOI and for other areas small increase or decrease of precipitation is not significant (Table 2). So, it can be said that dominance of positive SOI phase has a significant effect on precipitation and water resources in the eastern half of the country. Figure 7 shows the geographical distribution of the occurrence probability of wet periods during the positive SOI phase in different parts of the country. The most probability of wet in winter during the positive SOI phase is associated with areas located in the eastern half of the country. In these regions, during the positive SOI phase, 60 to 75 percent of winter precipitation do increase. In some areas in North West and West, the occurrence probability of wet winter periods during the positive SOI phase is very low and is about 35 percent. In other areas located at the western half of the country, this probability is higher and is about 50 to 60 percent. The Fisher’s exact test results in Figure 7 show that low occurrence probability of wet periods during the positive SOI phase is not significant in western areas of the country.
4.2.2. Negative SOI Phase
Figure 8 shows the geographical distribution of the ratio of average winter precipitation during the negative SOI phase to the average long-term precipitation
 .
.
Figure 6. Geographical distribution of the ratio of  in 40 stations Studied.
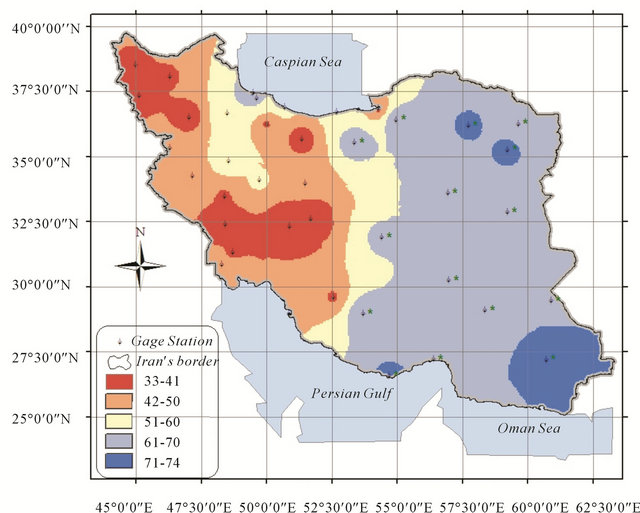
Figure 7. Geographical distribution of occurrence probability wet winter period concurrent with dominance of positive SOI phase in 40 stations Studied.
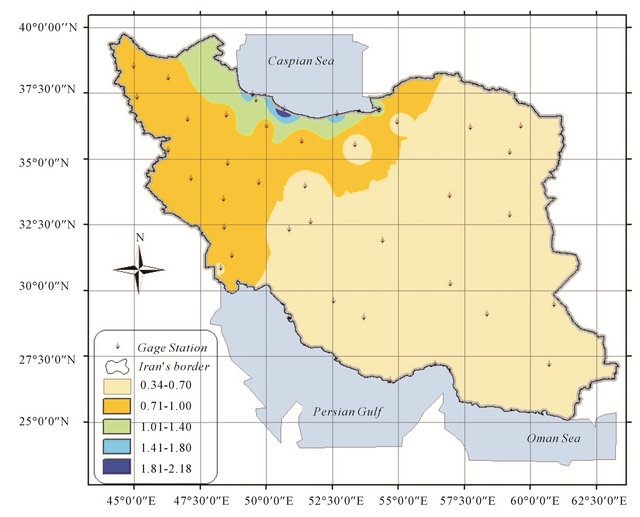
Figure 8. Geographical distribution of the ratio probability of  in 40 stations studied.
In most areas of the country except the coastal regions of the Caspian Sea, it is less than one. In other words, in all regions except the coast of the Caspian Sea during the negative SOI phase in winter, average precipitation is less than the average long-term winter, and dry periods are prevailing. In eastern half and South West of the country, this ratio has the lowest values (0.35 - 0.70). These during the negative SOI phase, the water resources in west, north west and northern regions of the country is reduce to the ratio in these areas is about 0.7 - 1.00 for the coastal area of Caspian sea, during the SOI negative phase ,which to 80% precipitation has been increased. Mann-Whitney test revealed no significant difference (Table 2). Figure 9 shows the geographical distribution of occurrence probability for winter dry periods during the negative SOI phase. In all regions except the coastal regions of the Caspian Sea, the occurrence probability of wintry dry periods is very high. In most regions at the eastern half of the country except South East, this probability is the highest (85 to 100 percent). In South East, and West, South West and North areas, this probability decreases to 70 to 85 percent.
In the coastal regions of the Caspian Sea and North West areas, the occurrence probability of dry periods during the negative SOI phase reaches 20 to 55 percent. It should be noted that the occurrence probability of dry periods is only acceptable for areas that exact Fisher’s test are significant (Figure 5). In other words, with the probably of 70 to 100 percent, dominance of negative SOI phase in the eastern half of the country, dry period is dominant and in other regions of the country, such probability is not significant.
5. Conclusion
In this study, the seasonal precipitation variations for the autumn and winter in the country according to the Southern Oscillation index and for 46-year time period has been studied. The obtained results for the seasons can be summarized as follows.
6. Autumn
During the positive SOI phase, the precipitation values decrease compared to their average long-term. This
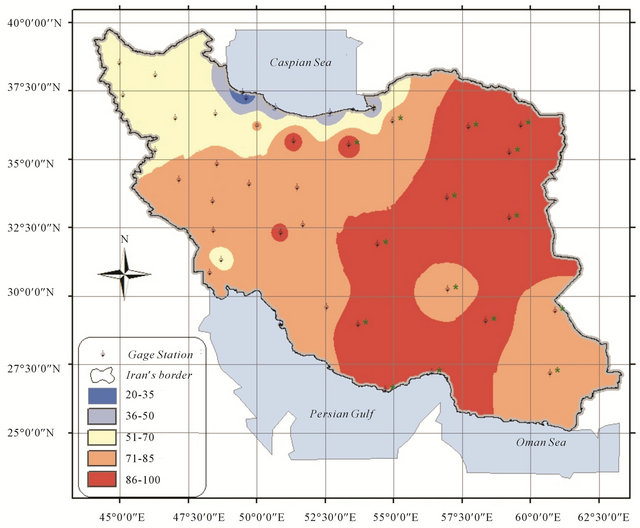
Figure 9. Geographical distribution of the occurrence wintry dry period concurrent with dominance negative phase in 40 stations studied.
increase is more significant in the south east region of the country. The highest probability of drought (about 90 percent) is related to Saghez, Iranshahr and Sanandaj station. During the negative SOI phase, the precipitation values increase compared to their average long-term.
This reduction is more significant in the southern and central region of the country. Its maximum (about 90 to 100 percent) is related to Bam stations.
During the negative SOI phase, the precipitation values increase only in small areas around Iranshahr and Kerman stations which are not significant based on Mann-Whitney and are negligible in regional analysis.
7. Winter
During the positive SOI phase, in all regions except the coastal regions of the Caspian Sea and the North West, the precipitation values are increased compared to their average long-term. The maximum increase (about 10 to 20 percent) is associated to the eastern half of the country.
In the most of central regions, South West, West and North regions of the country, this increase is less than 10% and in other areas, the precipitation value is unchanged or reduced. Mann-Whitney and Fisher statistical tests for areas where the precipitation increase are significant and for other cases are not significant.
During the negative SOI phase, in all regions except the coast of the Caspian Sea, average winter precipitation is less than their average long-term.
The maximum reduction (about 30 to 65 percent) is related to all areas in the eastern and southwestern half of the country.
8. Acknowledgements
This research is sponsored by Research Committee of the Regional Water Co. of the Hormozgan Province under Contract No. 74065/25 with the code HOW-86011 that we hereby declare our gratitude.
REFERENCES
- M. J. Nazemosadat, “ENSO’s Impact on the Occurrence of Autumnal Drought in Iran,” Drought Network News, Vol. 11, No. 2, 1999, pp. 15-18.
- M. J. Nazemosadat and I. Cordery, “On the Relationships between ENSO and Autumn Rainfall in Iran,” International Journal of Climatology, Vol. 20, No. 1, 2000, pp. 47-61. doi:10.1002/(SICI)1097-0088(200001)20:1<47::AID-JOC461>3.0.CO;2-P
- M. J. Nazemosadat, “Winter Rainfall in Iran: ENSO and Aloft Wind Interactions,” Iranian Journal of Science and Technology, Vol. 25, No. 4, 2001, pp. 611-624.
- A. Soltani and M. Gholipoor, “Teleconnections between El Nino/Southern Oscillation and Rainfall and Temperature in Iran,” International Journal of Agricultural Research, Vol. 1, No. 6, 2006, pp. 603-608.
- X. Rodo, E. Baert and F. A. Comin, “Variations in Seasonal Rainfall in Southern Europe during Present Century: Relationships with the North Atlantic Oscillation and ENSO,” Clim, Vol. 13, No. 4, 1997, pp. 275-284.
- C. Price, L. Stone, A. Huppert, B. Rajagopalan and P. Alpert, “A Possible Link between El Nino and Precipitation in Israel,” Geophysical Research Letters, Vol. 25, No. 21, 1998, pp. 3963-3966. doi:10.1029/1998GL900098
- M. Turkes, “Influence of Geopotential Heights, Cyclone Frequency and the Southern Oscillation on Rainfall Variations in Turkey,” International Journal of Climatology, Vol. 18, No. 6, 1998, pp. 649-680. doi:10.1002/(SICI)1097-0088(199805)18:6<649::AID-JOC269>3.0.CO;2-3
- K. Arpe, L. Bengtsson, G. S. Golistsyn, I. I. Mokhov, V. A. Semenov and P. V. Sporyshev, “Connection between Caspian Sea Level Variability and ENSO,” Geophysical Research Letters, Vol. 27, No. 17, 2000, pp. 2693-2696. doi:10.1029/1999GL002374
- M. Annarita, Z. Ning and K. L. Lau, “Euro-Mediterranean Rainfall and ENSO—A Seasonally Varying Relationship,” Geophysical Research Letters, Vol. 29, No. 12, 2002, pp, 59-1-59-4.
- “Climate Prediction Center of the International U.S. Weather.” http://www.cpc.noaa.gov/data/indices/soi
- “Iran Meteorology Organization.” www.irimet.net
- H. B. Mann and D. R. Whitney, “On a Test of Whether One of Two Random Variables is Stochastically Larger than the Other,” Annals of Mathematical Statistics, Vol. 18, No. 1, 1947, pp. 50-60. doi:10.1214/aoms/1177730491
- A. Agresti, “A Survey of Exact Inference for Contegency Tables,” Statitical Science, Vol. 7, No. 1, 1992, pp. 131- 153. doi:10.1214/ss/1177011454
- K. N. Dirks, J. E. Hay, C. D. Stow and D. Harris, “HighResolution Studies of Rainfall on Norfolk Island,” Part II: Interpolation of Rainfall Data, Journal of Hydrology, Vol. 208, No. 3-4, 1998, pp. 187-193. doi:10.1016/S0022-1694(98)00155-3
- ESRI, “Environmental System Research Institute,” 2001. http://www.esri.com/.
- P. Lancaster and K. Salkauskas, “Curve and Surface Fitting: An Introduction,” Academic Press, London-Orlando, 1986.