Open Journal of Fluid Dynamics
Vol.2 No.4(2012), Article ID:25500,4 pages DOI:10.4236/ojfd.2012.24014
Numerical Study on the Effect of Unsteady Downstream Conditions on Hydrogen Gas Flow through a Critical Nozzle
1Graduate School of Science and Engineering, Saga University, Saga, Japan
2Department of Mechanical Engineering, Saga University, Saga, Japan
3Institute of Ocean Energy, Saga University, Saga, Japan
4School of Mechanical Engineering, Andong National University, Andong, Korea
Email: *matsuo@me.saga-u.ac.jp
Received October 23, 2012; revised November 29, 2012; accepted December 8, 2012
Keywords: Compressible Flow; Critical Nozzle; Pressure Fluctuation; Measurement; Supersonic Flow
ABSTRACT
A critical nozzle (sonic nozzle) is used to measure the mass flow rate of gas. It is well known that the coefficient of discharge of the flow in the nozzle is a single function of Reynolds number. The purpose of the present study is to investigate the effect of unsteady downstream condition on hydrogen gas flow through a sonic nozzle, numerically. Navier-Stokes equations were solved numerically using 3rd-order MUSCL type TVD finite-difference scheme with a second-order fractional-step for time integration. A standard k-ε model was used as a turbulence model. The computational results showed that the discharge coefficients in case without pressure fluctuations were in good agreement with experimental results. Further, it was found that the pressure fluctuations tended to propagate upstream of nozzle throat with the decrease of Reynolds number and an increase of amplitude of pressure fluctuations.
1. Introduction
The critical nozzle which makes use of the flow-choking phenomenon at the nozzle throat is defined as a device to measure the mass flow with only the nozzle supply conditions. Once the flow is choked, the flow upstream of choking area is no longer dependent on the pressure change in the downstream flow field. In this case, the mass flow is determined only by the stagnation conditions upstream of the flow passage.
In the past, much attention has been paid to the prediction of mass flow through a flow passage, since it was practically important in a variety of industrial and engineering fields. The mass flow rate and critical pressure ratio are associated with the working gas consumption and the establishment of safe operation conditions of the critical nozzle. From previous researches [1-3], the mass flow rate and critical pressure ratio are strong functions of Reynolds number Re. The relationship between the mass flow rate and Reynolds number is as follows:
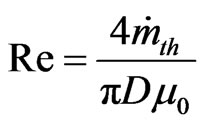 (1)
(1)
where D is diameter of the nozzle throat and μ0 is molecular viscosity at stagnation point.  which is theoretical mass flow rate at the nozzle throat is written in
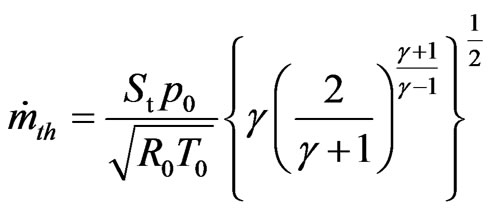 (2)
(2)
where p0, T0 are total pressure and total temperature at stagnation point upstream of the nozzle, respectively. R0 is gas constant. In the practical flow fields, mass flow rate at the nozzle throat is different from theoretical one (Equation (2)) because of existence of boundary layer on the wall. The relationship between practical and theoretical mass flow rate is written in
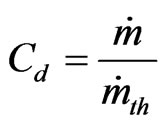 (3)
(3)
where,  is the practical mass flow rate at the nozzle throat and Cd is coefficient of discharge.
Of many kinds of working gases employed in Industrial fields, it is recognized that hydrogen gas is one of the most promising gases as a future alternative energy source. In such an application, precise measurement of flow rate is of practical importance for mileage and power output of the vehicle. A large number of works [4-7] have been made to investigate the thermo-physical properties of hydrogen gas, which are specified by some different kinds of the equations of state, the critical pressure, the compressibility factor of hydrogen gas and so on.
In the case of small critical nozzles, viscous effect near the nozzle wall becomes dominant and the wall boundary layer can be several percent of diameter of the critical nozzle. Recently, Kim et al. [8] have investigated the critical gas flows using a computational fluid dynamics (CFD) method. They have tested effects of turbulence model on the critical nozzle flows and showed that the standard k-ε model with standard wall function predicts the discharge coefficient and critical pressure with good accuracy. They have made further investigations to analyze the boundary layer flows through the critical nozzles and showed that the boundary layers at the critical nozzle throat are turbulent, typically expressed by both the law of wall and the law of the wake.
According to their computation results, the subsonic region in the turbulent boundary layers amounted to several tens of percent of the boundary layer thickness. In most critical flows, the flow downstream of the nozzle throat is often subject to strong pressure fluctuations that can be produced by the shock-boundary layer interaction acoustic waves or vortices [9,10]. In this case, pressure fluctuations can propagate upstream beyond the throat of critical nozzle through the subsonic regions of the boundary layer flows, even above the critical pressure ratio. As a result, it may lead to fluctuating mass flow through the critical nozzle.
Recently, von Lavante et al. [11] have made some experiments and computations in order to investigate the effect of pressure fluctuations on the nozzle flow. Kim et al. [12] and Nagao et al. [13] conducted numerical simulations and experiments, respectively. They showed that the pressure fluctuations propagated upstream of throat of critical nozzles. However they did not give a clear explanation about the boundary layer flows and pressure fluctuations. Further, Kim et al. [12] and Nagao et al. [14] investigated that the sonic line near the nozzle throat was fluctuated by pressure fluctuations from downstream of nozzle exit in the range of low Reynolds number [12, 14], low frequency [14] and large amplitude [14]. In these researches a dry air was used as a working gas.
In the present study, hydrogen gas is used as a working gas and numerical simulations were performed in order to clarify the effects of amplitude and frequency of the pressure fluctuations on the flow characteristics in a critical nozzle in the range of low Reynolds number.
2. CFD Analysis
2.1. Governing Equations
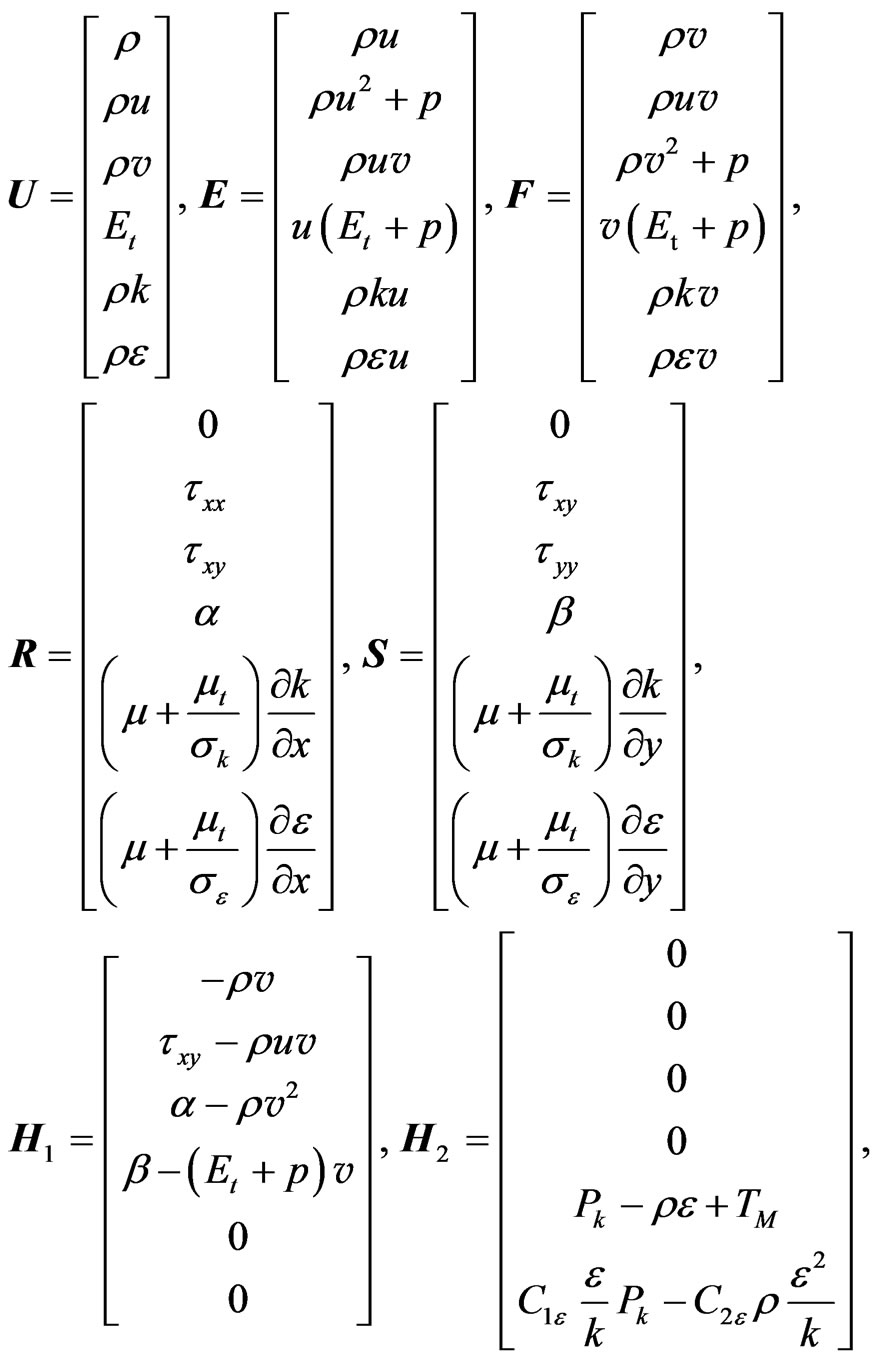
The governing equations, i.e., the unsteady compressible Navier-Stokes equations written in an axisymmetric coordinate system (x, y) are as follows:
 (4)
(4)
where
 (5)
(5)
 (6)
(6)
 (7)
(7)
 (8)
(8)
 (9)
(9)
 (10)
(10)
 (11)
(11)
 (12)
(12)
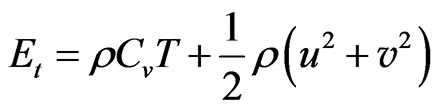
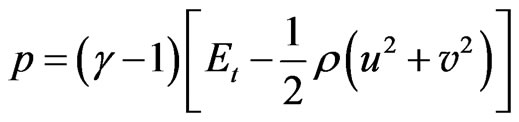
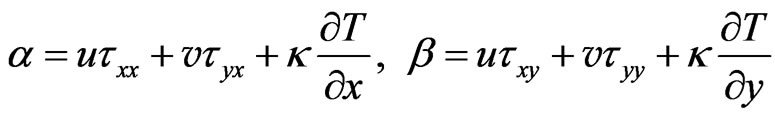
In Equation (2), U is the conservative vector, E and F are inviscid flux vector and R and S are viscous flux vectors. H1 and H2 are the source terms corresponding to axisymmetry and turbulence, respectively. τxx, τxy, τyx and τyy are components of viscous shear stress.
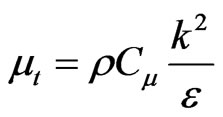
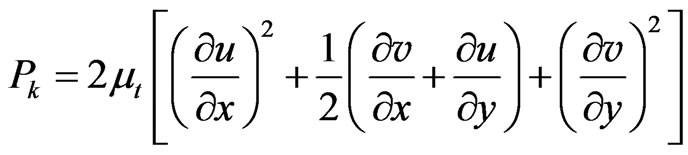
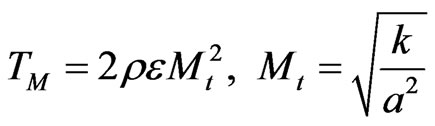
The governing equation systems that are non-dimensionalized with reference values at the reservoir condition are mapped from the physical plane into a computational plane of a general transformation. To close the governing equations, a standard k-ε model [15] is employed in computations. In order to take account of effect of compressibility, the dilatation dissipation term TM [16, 17] was included in the model. The equations were discretized by the finite difference method. A third-order TVD (Total Variation Diminishing) finite difference scheme with MUSCL [18] is used to discretize the spatial derivatives, and a second order-central difference scheme for the viscous terms, and a second-order fractional step method is employed for time integration.
2.2. Computational Conditions
Figure 1 shows an ISO-type toroidal throat sonic Venturi nozzle [19] used in the present study. The radius of curvature at the throat of the nozzle is twice the throat diameter fD (=0.5935 mm). The straight divergent part has a half angle of θ (=3˚) and its axial length is 3.0D. In order to simulate the pressure fluctuations downstream, a sudden enlargement section that is 30D long and 30D high was connected to the nozzle exit. The nozzle inlet is located at 100D upstream of the nozzle throat.
In the steady computations, the total pressure p0 (reservoir) and back pressure pb0 were given at the inlet and outlet of the critical nozzle, respectively. In order to simulate the effects of pressure fluctuations on the critical flows, a sinusoidal wave with an amplitude A, an angular frequency ω = 2πf and a phase φ was assumed at the exit of the sudden enlargement section as illustrated in Figure 1. As shown in this figure, point P is located at −0.1D upstream of nozzle throat. Combinations of amplitude A and frequency f used in the present simulation are shown in Table 1. The inlet total pressure p0 was varied to change the Reynolds number. Ranges of Reynolds number are about from 600 to 100,000 (Table 1). The total pressure at stagnation point upstream of the nozzle was decided from Equations (1) and (2) for each
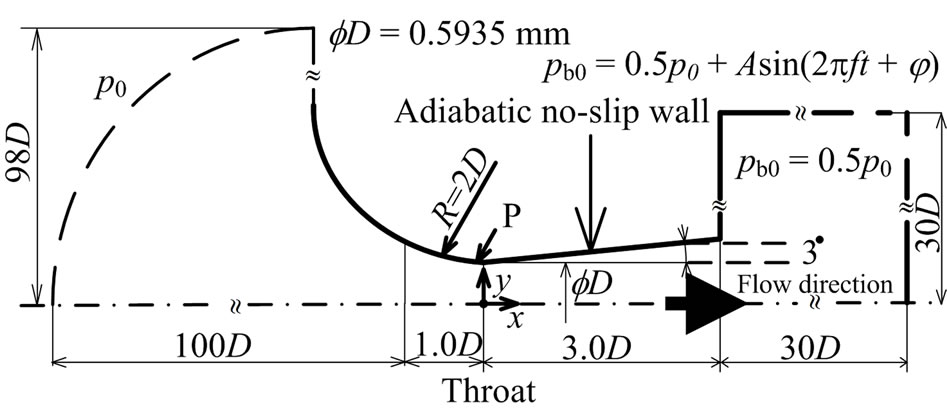
Figure 1. Details of critical nozzle.
Reynolds number. Total temperature is T0 = 298 K.
3. Results and Discussions
3.1. Discharge Coefficient for Low Reynolds Number
The relationships between Reynolds number which is defined in Equation (1) and coefficient of discharge Cd by the present computations are shown in Figure 2. and they are compared with the experimental results [20]. It is known that the coefficient of discharge Cd is a strong function of the Reynolds number, and the predicted coefficients of discharge are in good agreement with the experimental results below Re = 1.5 × 10⁴. It is found that the present computational method effectively predicts the gas flow through the critical nozzle for low Reynolds number.
3.2. Effects of Pressure Fluctuations on the Flows
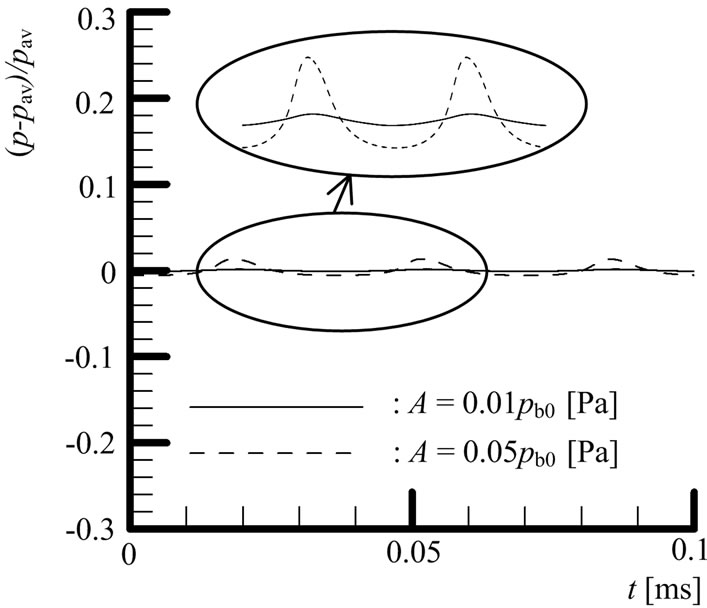
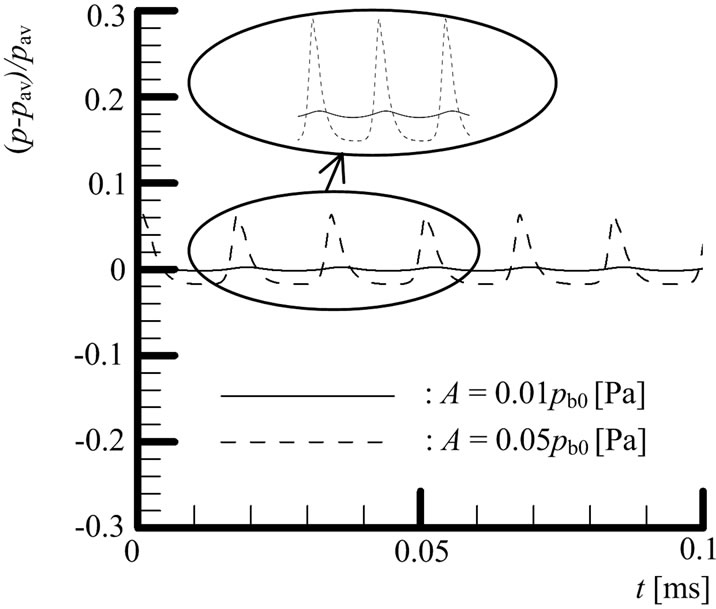
Figures 3 and 4 show pressure-time histories at point P for f = 30 kHz and 60 kHz, respectively. In Figures 3(a) and 4(a), Reynolds number is 1500 and it is 15,000 in Figures 3(b) and 4(b).
Pressure amplitudes are A = 0.01pb0 Pa and 0.05pb0 Pa in each figure. pav means the time-averaged local static pressure on point P. For Re = 1500 (Figures 3(a) and 4(a)), static pressures fluctuate with time. This means that effect of pressure fluctuations can affect upstream of nozzle throat. Further, it is found that amplitude of pressure fluctuations becomes large with an increase of A. For Re = 15,000 (Figures 3(b) and 4(b)), different result can be observed in comparison with Re = 1500. In the case of f = 30 kHz, effect of pressure fluctuation downstream of nozzle throat can not be observed for A =
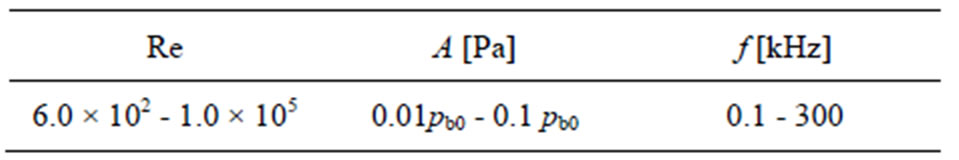
Table 1. Computational conditions.
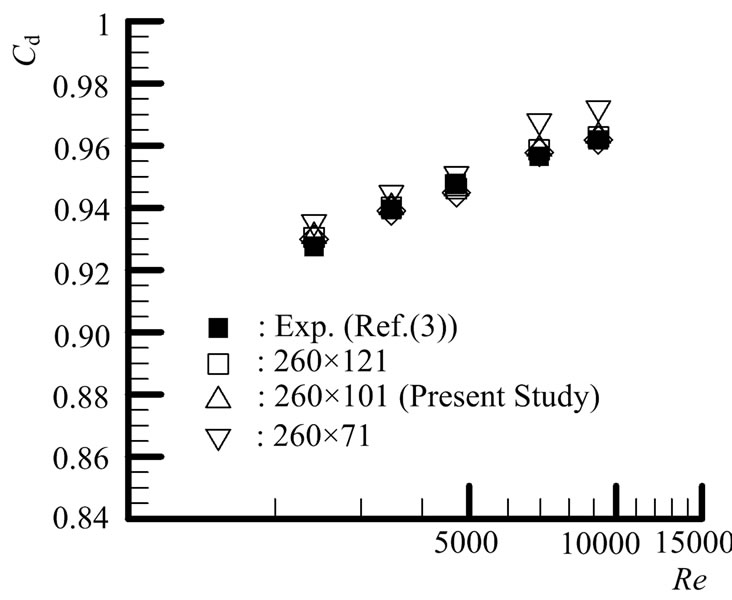
Figure 2. Effect of mesh numbers on discharge coefficient.
 (a)
(a) (b)
(b)
Figure 3. Pressure-time histories at point P (f = 30 [kHz]). (a) Re = 1500; (b) Re = 15,000.
0.01pb0 Pa and 0.05pb0 Pa. However, for f = 60 kHz, despite the non-fluctuation for A = 0.01pb0 Pa, fluctuation in static pressure is observed in the case of A = 0.05pb0 Pa.
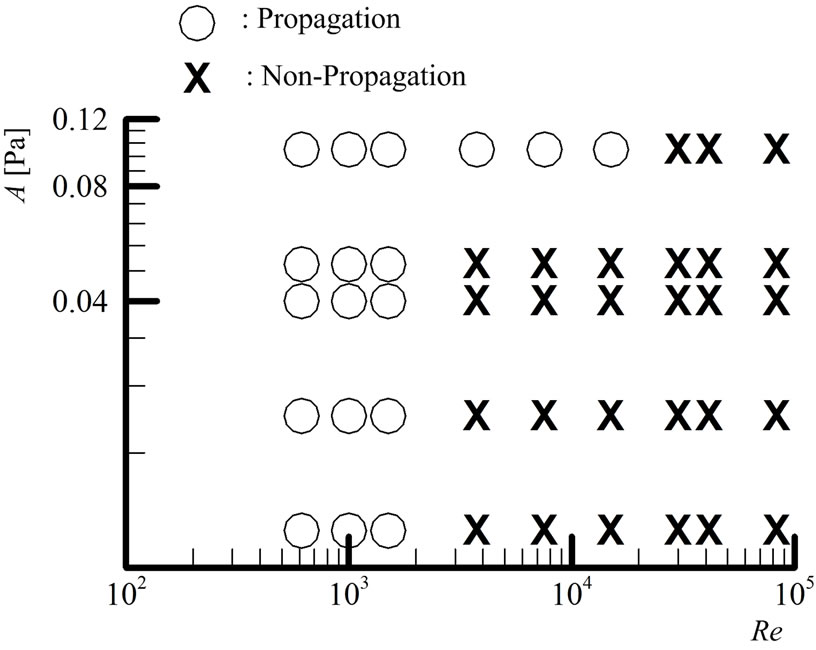
Figure 5 shows effects of Reynolds number and amplitude on propagation of pressure fluctuation at point P. Figures 5(a) and (b) are for f = 30 kHz and 60 kHz, respectively. Open circle and X mark indicate cases with and without propagation of the pressure fluctuation, respectively. As seen from these figures, in the case of low Reynolds number, pressure fluctuation can be propagated upstream compared with case of high Reynolds number. This is considered to be due to an increase in subsonic range by increase of boundary layer thickness. In addition, it can be propagated upstream even in case of high Reynolds number with an increase of amplitude A. This is considered that strong pressure wave (pressure fluctuation with large amplitude) affects strongly velocity distribution and thickness in the boundary layer compared to case of pressure fluctuations with low amplitude. Further, as seen from Figures 5(a) (f = 30 kHz) and (b) (f = 60 kHz), pressure fluctuation for f = 60 kHz can be propagated even in low amplitude compared with case of f = 30 kHz.
Figure 6 shows the relationship between Reynolds
 (a)
(a)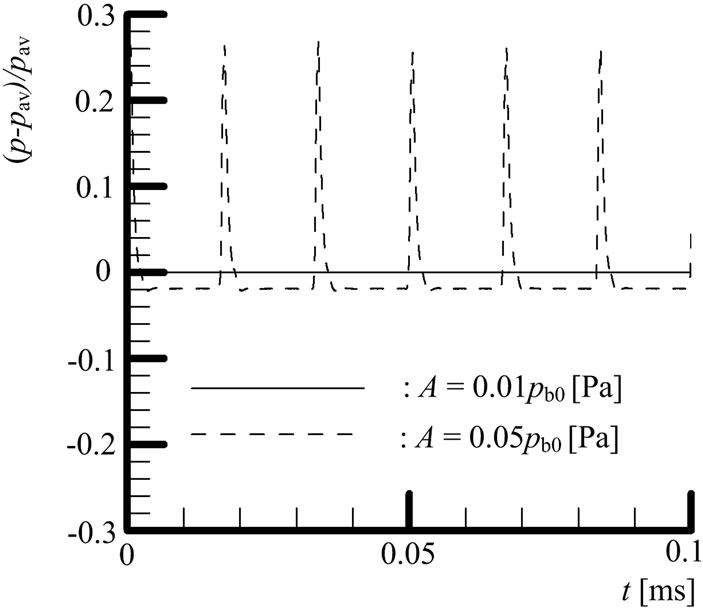 (b)
(b)
Figure 4. Pressure-time histories at point P (f = 60 [kHz]). (a) Re = 1500; (b) Re = 15,000.
number Re and frequency f of pressure fluctuations at point P for A = 0.05pb0 Pa. Open circle and X mark indicate cases with and without propagation of the pressure fluctuation, respectively. As is evident from this figure, in the range from f = 50 kHz to f = 120 kHz, pressure fluctuations can be propagated upstream of nozzle throat even in case of high Reynolds number. This tendency was also confirmed in cases of other amplitudes. However, it is difficult to explain the reason at present.
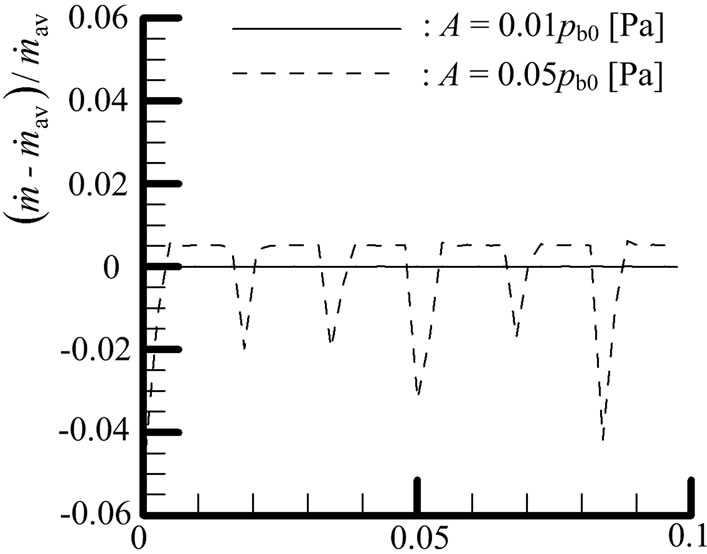
Figures 7 and 8 show time histories of mass flow rate at point P for f = 30 kHz and 60 kHz, respectively. Mass flow rates for Re = 1500 and 15,000 are shown in Figures 7(a), 8(a) and 7(b), 8(b), respectively. Pressure amplitudes are A = 0.01pb0 Pa and 0.05pb0 Pa in each figure.  means the time-averaged mass flow rate at nozzle throat. In the case of Re = 1500 (Figures 7(a) and 8(a)), it is found that the mass flow rate fluctuates with time and amplitude of mass flow rate fluctuations becomes large with an increase of A. For f = 30 kHz and Re = 1500, the maximum of amplitudes of mass flow rate fluctuation is about 0.05% for A = 0.01pb0 Pa and 0.6% for A = 0.05pb0 Pa. In the case of f = 60 kHz and Re = 1500, it fluctuates about 0.09% for A = 0.01pb0 Pa and 2% for A = 0.05 pb0 Pa. In the case of Re = 15,000 (Fig-
 (a)
(a)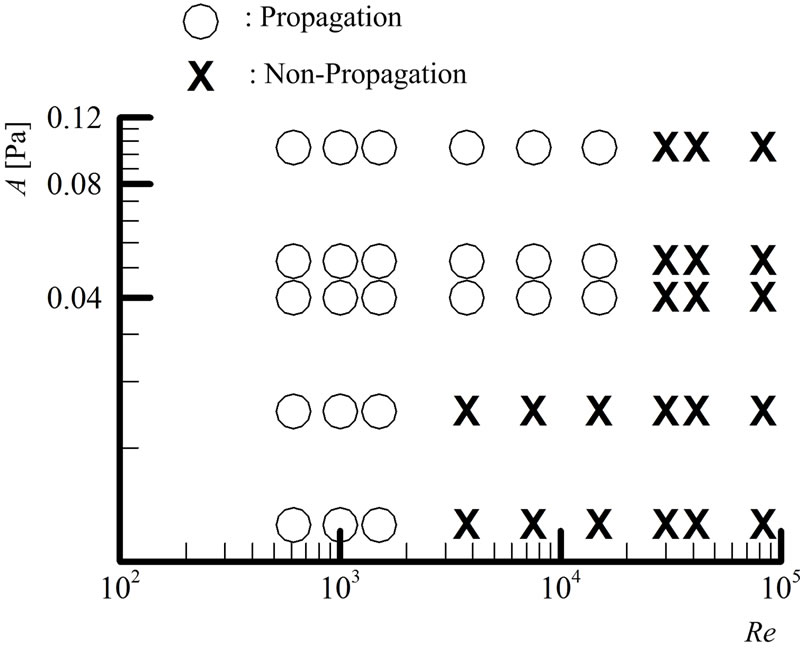 (b)
(b)
Figure 5. Effects of Reynolds number and amplitude on propagation of pressure disturbance at point P. (a) f = 30 [kHz]; (b) f = 60 [kHz].
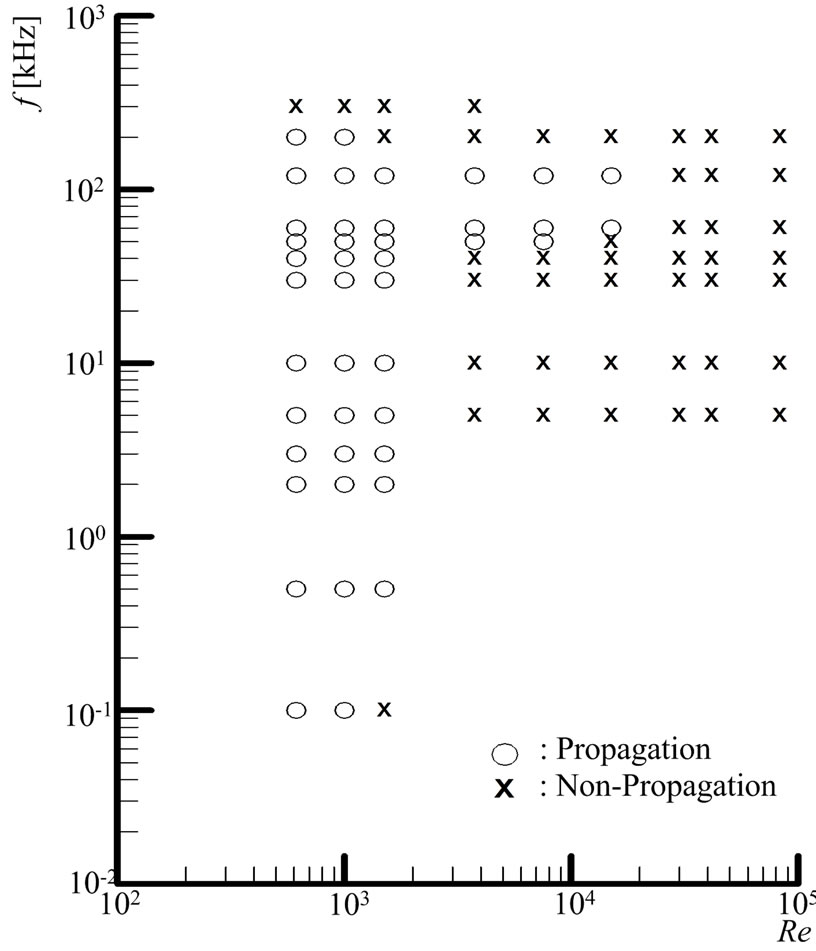
Figure 6. Effects of Reynolds number and frequency on propagation of pressure fluctuation at point P. (A = 0.05pb0 [Pa]).
 (a)
(a)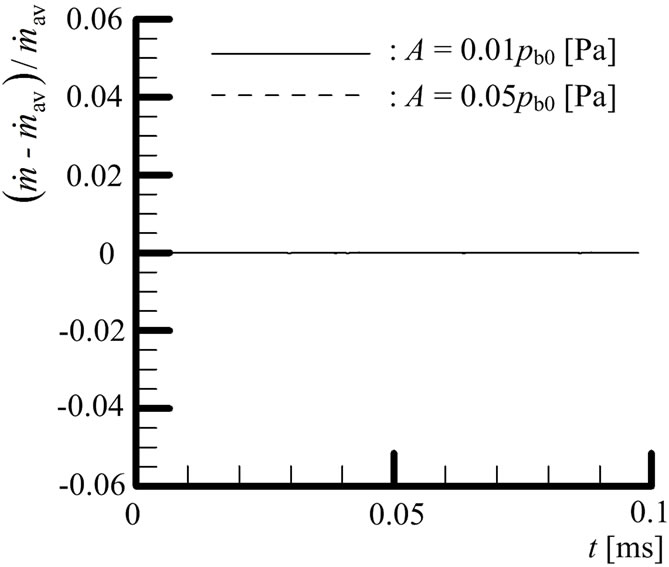 (b)
(b)
Figure 7. Time histories of mass flow rate σ at point P (f = 30 [kHz]). (a) Re = 1500; (b) Re = 15,000.
ures 7(b) and 8(b)), mass flow rate fluctuation can not be observed except case of f = 60 kHz and A = 0.05pb0 Pa. For f = 60 kHz and A = 0.05pb0 Pa, the maximum of amplitude of mass flow rate fluctuations is about 4.5%.
It is considered from these results that pressure fluctuations affect adversely for the accurate measurement of mass flow rate using the critical nozzle.
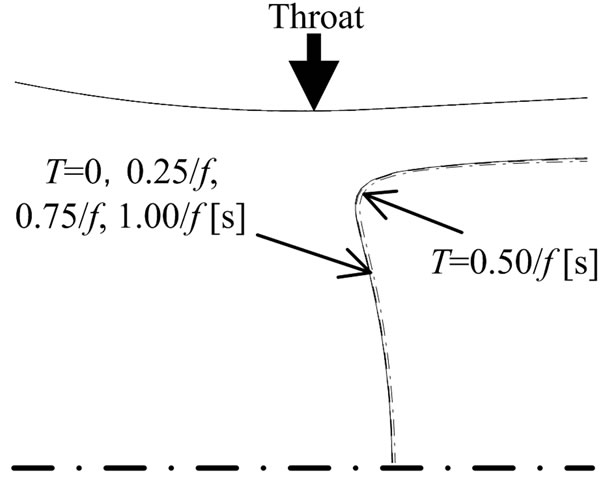
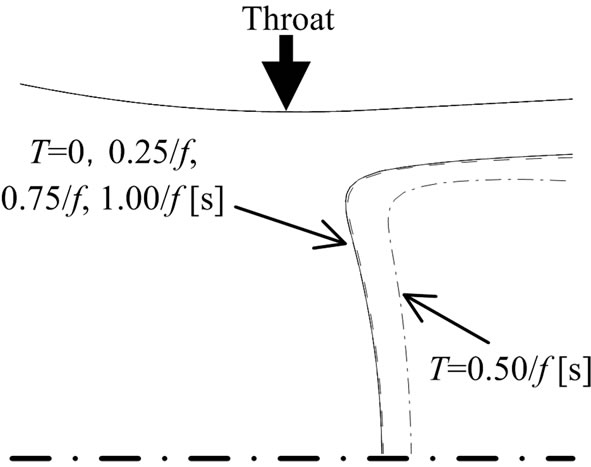
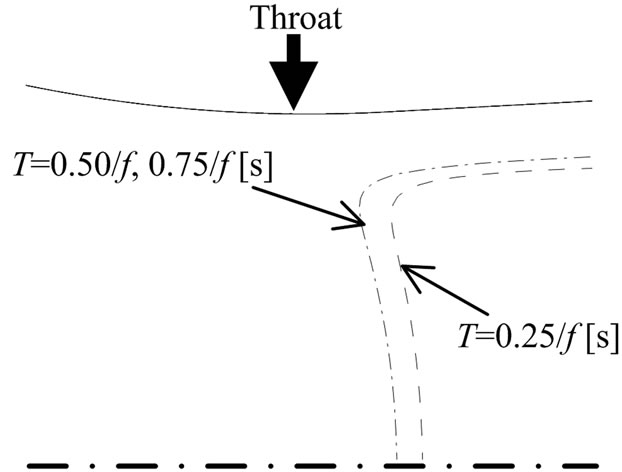
Figures 9(a) and (b) show time-dependent sonic lines in the range close to the nozzle throat for Re = 1500 and Re = 15,000, respectively. Frequency f and amplitude A of pressure fluctuation are 30 kHz and 0.01pb0 Pa, respectively. In the case of Re = 1500, the sonic line fluctuations are slightly observed. However, it is found for Re = 15,000 that the sonic line fluctuations are not observed in the flow field.
In Figure 10, time-dependent sonic lines are shown for f = 30 kHz and A = 0.05pb0 Pa. Reynolds numbers of Figures 10(a) and (b) are 1500 and 15,000, respectively. As seen from these results, increase of amplitude induces large variation at low Reynolds number compared with that in Figure 9(a).
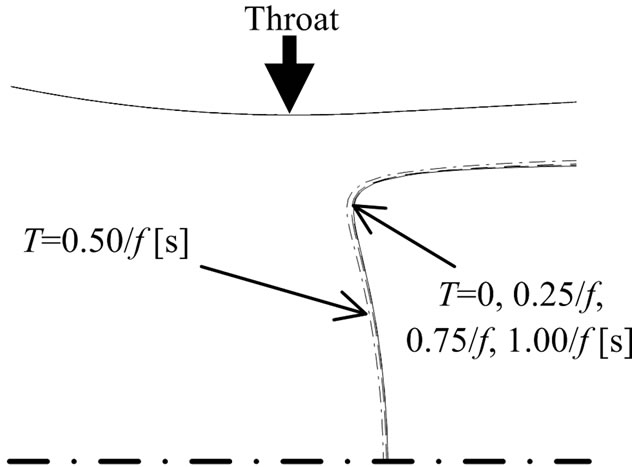
Figure 11 shows time-dependent sonic lines for f = 60 kHz and A = 0.01pb0 Pa. Reynolds numbers of Figures 11(a) and (b) are 1500 and 15,000, respectively. In the case of Re = 1500, the sonic line fluctuations are slightly observed compared with those in Figure 9(a) and the
 (a)
(a)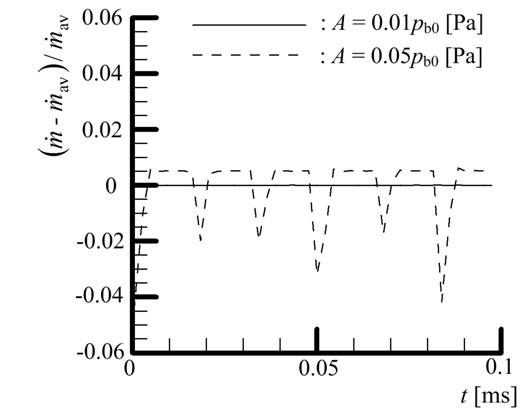 (b)
(b)
Figure 8. Time histories of at point P (f = 60 [kHz]). (a) Re = 1500; (b) Re = 15,000.
 (a)
(a)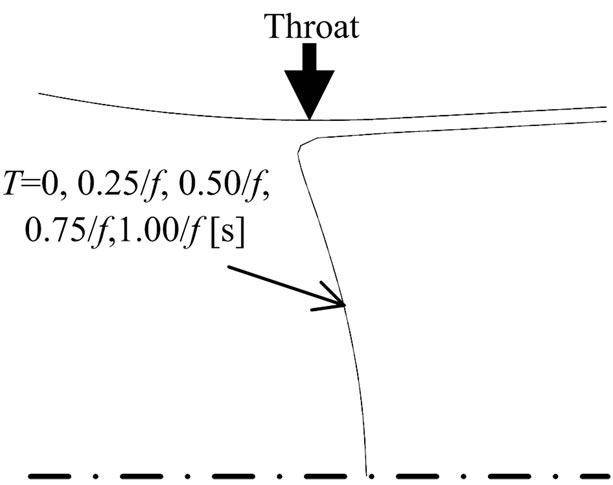 (b)
(b)
Figure 9. Time-dependent sonic line near nozzle throat (f = 30 [kHz], A = 0.01pb0 [Pa]). (a) Re = 1500; (b) Re = 15,000.
 (a)
(a)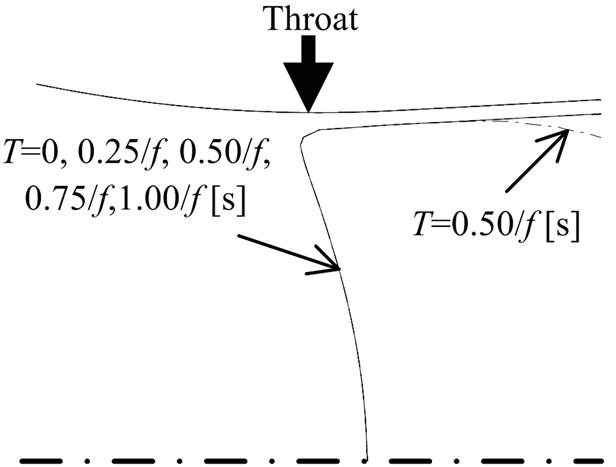 (b)
(b)
Figure 10. Time-dependent sonic line near nozzle throat (f = 30 [kHz], A = 0.05pb0 [Pa]). (a) Re = 1500; (b) Re = 15,000.
 (a)
(a)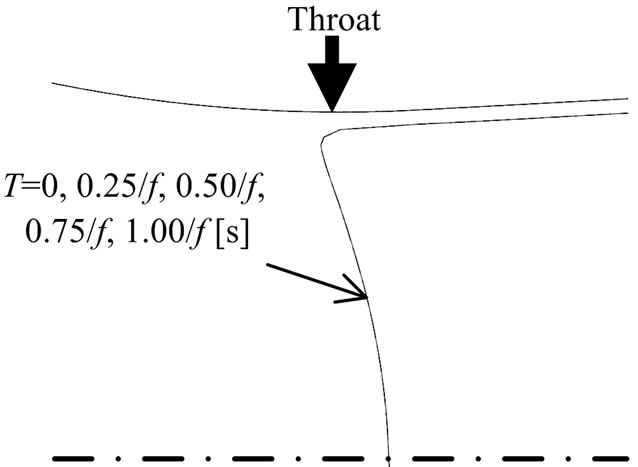 (b)
(b)
Figure 11. Time-dependent sonic line near nozzle throat (f = 60 [kHz], A = 0.01pb0 [Pa]). (a) Re = 1500; (b) Re = 15,000.
fluctuations of the sonic line can not be observed for Re = 15,000.
Figures 12(a) and (b) show time-dependent sonic lines for Re = 1500 and Re = 15,000, respectively. The frequency f and amplitude A are 60 kHz and 0.05pb0 Pa,
 (a)
(a) (b)
(b)
Figure 12. Time-dependent sonic line near nozzle throat (f = 60 [kHz], A = 0.05pb0 [Pa]). (a) Re = 1500; (b) Re = 15,000.
respectively. As is evident from these results, increase of frequency and amplitude induces large variation for sonic lines in the range close to the nozzle throat compared with cases with low frequency and low amplitude. Further, it is considered that the variations of non-dimensional mass flow rate (Figures 7 and 8) are due to the fluctuations of sonic line in the range close to the nozzle throat.
4. Conclusions
In the present study, numerical simulations were conducted to investigate the effect of pressure fluctuations on hydrogen gas flow through a critical nozzle. The results obtained are as follows:
1) For low Reynolds number, the pressure fluctuations downstream could propagate upstream of the nozzle throat.
2) The propagation of the pressure fluctuations affects mass flow rate through the critical nozzle.
3) For low Reynolds number, the sonic lines in the range close to the nozzle throat fluctuate with time.
4) The pressure fluctuations may affect measurement of mass flow rate depending on combinations of frequency, amplitude and Reynolds number.
REFERENCES
- S. P. Tang and J. B. Fenn, “Experimental Determination of the Discharge Coefficients for Critical Flow through an Axisymmetric Nozzle,” The American Institute of Aeronautics and Astronautics Journal, Vol. 16, No. 1, 1978, pp. 41-46. doi:10.2514/3.60854
- S. Nakao, Y. Yokoi and M. Takamoto, “Development of a Calibration Facility for Small Mass Flow Rates of Gas and Uncertainty of a Sonic Venturi Transfer Standard,” Flow Measurement and Instrumentation, Vol. 7, No. 2, 1996, pp. 77-83. doi:10.1016/S0955-5986(97)00006-X
- S. Nakao, T. Irayama and M. Takamoto, “Relations between the Discharge Coefficients of the Sonic Venturi Nozzle and Kind of Gases,” Journal of the Japan Society of Mechanical Engineers, Series B, Vol. 66, No. 642, 2000, pp. 438-444.
- R. C. Johnson, “Real Gas Effects in Critical-Flowthrough Nozzles and Tabulated Thermodynamic Properties,” NASA TN D-2565, 1965.
- R. D. McCarty and L. A. Weber, “Thermophysical Properties of Parahydrogen from the Freezing Liquid Line to 5000R for Pressures to 10,000 Psia,” NBS TN 617, 1972.
- R. D. McCarty, J. Hord and H. M. Roder, “Selected Properties of Hydrogen (Engineering Design Data),” NBS MN 168, 1981.
- R. D. McCarty, “Hydrogen Technological Surveythermophysical Properties,” NASA SP 3089, 1975.
- H. D. Kim, J. H. Kim, K. A. Park, T. Setoguchi and S. Matsuo, “Computational Study of the Gas Flow through a Critical Nozzle,” Proceedings of the Institution of Mechanical Engineers. Part C, Journal of Mechanical Engineering Science, Vol. 217, No. 10, 2003, pp. 1179- 1189.
- H. D. Kim, K. Matsuo, S. Kawagoe and T. Kinoshita, “Flow Unsteadiness by Weak Normal Shock Wave/Turbulent Boundary Layer Interaction in Internal Flow,” JSME International Journal. Series 2, Fluids Engineering, Heat Transfer, Power, Combustion, Thermophysical Properties, Vol. 34, No. 4, 1991, pp. 457-465.
- K. Matsuo, Y. Miyazato and H. D. Kim, “Shock Train and Pseuedo-Shock Phenomena in Internal Gas Flows,” Progress in Aerospace Sciences, Vol. 35, No. 1, 1999, pp. 33-100. doi:10.1016/S0376-0421(98)00011-6
- E. Von Lavante, A. Zachcizl, B. Nath and H. Dietrich, “Unsteady Effects in Critical Nozzles Used for Flow Metering,” Measurement, Vol. 29, No. 1, 2001, pp. 1-10. doi:10.1016/S0263-2241(00)00021-X
- H. D. Kim, J. H. Kim, K. A. Park, T. Setoguchi and S. Matsuo, “Study of the Effects of Unsteady Downstream Conditions on the Gas Flow through a Critical Nozzle,” Proceedings Institution of Mechanical Engineers. Part C: Journal of Mechanical Engineering Science, Vol. 218, No. 10, 2004, pp.1163-1173.
- J. Nagao, S. Matsuo, T. Setoguchi and H. D. Kim, “Effect of Unsteady Downstream Conditions on the Gas Flow through a Supersonic Nozzle,” International Journal of Turbo and Jet Engines, Vol. 27, No. 2, 2009, pp.95-108. doi:10.1515/TJJ.2010.27.2.95
- J. Nagao, M. Mamun, S. Matsuo, T. Hashimoto, S. Toshiaki and H. D. Kim, “Numerical Study of Air Gas Flow through a Critical Nozzle,” International Journal of Turbo and Jet Engines, Vol. 26, No. 4, 2009, pp.223-234. doi:10.1515/TJJ.2009.26.4.223
- B. E. Launder and D. B. Spalding, “The Numerical Computation of Turbulent Flows,” Computer Methods in Applied Mechanics and Engineering, Vol. 3, No. 2, 1974, pp. 269-289. doi:10.1016/0045-7825(74)90029-2
- S. Sarkar and L. Balakrishnan, “Application of a Reynolds Stress Turbulence Model to the Compressible Shear Layer,” NASA CR 182002, 1990.
- D. C. Wilcox, “Turbulence Modeling for CFD,” 3rd Edition, DCW Industries, Inc., La Canada, 2006.
- H. C. Yee, “A Class of High-Resolution Explicit and Implicit Shock Capturing Methods,” NASA TM-89464, 1989.
- ISO 9300, “Measurement of Gas Flow by Means of Critical Flow Venturi Nozzles,” 1990.
- S. Nakao, “A Study on the Conversion Factor of Sonic Venturi Nozzles,” AIST Bulletin of Metrology, Vol. 1, No. 2, 2002, pp. 387-405.
NOTES
*Corresponding author.