Open Journal of Veterinary Medicine
Vol.08 No.08(2018), Article ID:87061,21 pages
10.4236/ojvm.2018.88014
Effect of Dietary Urea Molasses Multi-Nutrient Cake (UMMC) on Productive and Reproductive Performance of Rabbit
Mohammad Ruknuzzaman1, Abdul Gaffar Miah2, Sabbir Hosen Sobuz2, Mohammad Abdul Hamid2, Mohammad Asaduzzaman2, Ummay Salma1*
1Department of Animal Science and Nutrition, Hajee Mohammad Danesh Science and Technology University, Dinajpur, Bangladesh
2Department of Genetics and Animal Breeding, Hajee Mohammad Danesh Science and Technology University, Dinajpur, Bangladesh

Copyright © 2018 by authors and Scientific Research Publishing Inc.
This work is licensed under the Creative Commons Attribution International License (CC BY 4.0).
http://creativecommons.org/licenses/by/4.0/


Received: October 31, 2017; Accepted: August 28, 2018; Published: August 31, 2018
ABSTRACT
Two experiments were carried out to investigate the effect of dietary supplementation of urea molasses multi-nutrient cake (UMMC) on productive and reproductive performances of rabbit. In Experiment-I, 80 rabbit does (age 24 weeks) were randomly assigned into four dietary treatment groups (T0, T1, T2 and T3) to investigate the effect of UMMC on the reproductive performances whereas in Experiment-II, 112 young rabbits (age 5 weeks) were also randomly assigned into another four dietary treatment groups to investigate the effect of UMMC on the productive performance. The rabbits of four dietary treatment groups (T0, T1, T2 and T3) in both experiments were fed 0%, 4%, 6% and 8% urea containing UMMC, respectively. The results revealed that the dietary supplementation of UMMC increased (P < 0.05) live weight of pregnant does, conception rate, litter size, and litter weight and individual kit weight at weaning. On the other hand, UMMC supplementation reduced (P < 0.05) the kit mortality, though it did not affect the gestation period, litter size, litter weight and individual kit weight at birth. Dietary UMMC supplementation also improved (P < 0.05) the productive performances of growing rabbits in terms of live weight gain, feed conversion ratio and performance index by almost same amount of feed intake. On the contrary, blood parameters (Hb, PCV and ESR) were not affected by the UMMC except for red blood cell and white blood cell counts, but were within their normal range indicating the safe use of UMMC. UMMC also increased (P < 0.05) the fecal bacterial population. Production cost of UMMC was around 0.19 USD less in each kg of feed than the commercial pellet. In both of the experiments rabbits fed 6% urea containing UMMC showed best result than control and other treatment groups as well.
Keywords:
Rabbit, Dietary UMMC, Productive and Reproductive Performances, Blood Parameters, Faecal Parameters

1. Introduction
World food productions are consistently lower than human population growth especially in the developing countries [1] . It is an established fact that high quality animal protein in the form of milk, meat and eggs is extremely important for the proper physical and mental growth of this population [2] . The ever increasing human population and poor performance of the available livestock is some of the major factors limiting the supply of animal protein in the developing countries [3] . Available protein sources are unable to meet up the protein demand in Bangladesh. In order to maximize food production and meet protein requirements, variable options need to be explored and evaluated [4] . So, it is crying need to explore and invent new alternatives of protein sources that will be convenient in both productive and economic aspects and able to meet up the protein requirement in Bangladesh. From this point of view, the use of fast growing livestock species such as, rabbit may play a vital role in producing animal protein, self-employment and poverty alleviation in Bangladesh.
Although rabbit farming has a great potential to be used as a source of protein and to contribute to the economy of Bangladesh, it has a limitation of the high price of concentrate feed as pellet form and low performance in the poor diet [5] . Therefore, finding of alternative feed ingredients becomes the main focus of most of the animal nutritionists [6] .
Mini-blocks may be a complete feed for rabbits by including a source of forage in the formulation [7] . Binh et al. [8] showed that UMMC based on molasses could be fed successfully as a substitute for cereal-based concentrates for rabbits during all stages of production. Although rabbit is a monogastric animal, it is capable of utilizing urea as a non-protein nitrogenous source because of cecal fermentation due to the presence of urease activity similar to that of ruminants, transfer of blood urea to caecum [9] [10] [11] and cecotrophy (ingestion of cecal contents) [12] .
However, a little number of researches has been conducted in attempting the preparation of MNB or multi nutrient cake for rabbit by using locally available ingredients and urea, but they were not succeeded to draw a satisfactory conclusion about its uses. Beside this, those researches are not clearly identified the optimum level of urea to be incorporated in the multi nutrient cake and its effect on blood and faecal parameters of rabbit. Therefore, the present study was designed to study the effects of urea molasses multi-nutrient cake (UMMC) on productive and reproductive performances of rabbit and to determine the economic potency of using UMMC instead of commercial pellet.
2. Materials and Methods
2.1. Experimental Site and Animals
The present study was conducted with two experiments at Rabbit Research Farm of Hajee Mohammad Danesh Science and Technology University (HSTU), Dinajpur, Bangladesh. All experimental procedures were approved by the Ethics Committees of HSTU.
2.2. Experimental Design and Dietary Treatments
In Expt. I, 80 New Zealand adult does were randomly assigned into four dietary treatment groups under a completely randomized design (CRD), so that there were 20 rabbits in each group. In Expt. II, 112 weaned rabbits from Expt. I were randomly assigned into 4 dietary treatment groups in a completely randomized design (CRD) having 28 rabbits in each group. The control group was fed UMMC without urea and other dietary groups were fed UMMC containing three different levels of urea (4%, 6% and 8%). Does of Expt. I, was supplied with UMMC @ 30 g twice daily whereas growing rabbits of Expt. II were fed with UMMC according to their age (15 g size cake provided twice daily during 1st month of experiment, 20 g size cake provided during 2nd month of the experiment and then up to 5 month of experimental period, and 30 g size cake was supplied twice daily). The experimental layout was as follows:
T0 = UMMC containing 0% urea + Napier grass
T1 = UMMC containing 4% urea + Napier grass
T2 = UMMC containing 6% urea + Napier grass
T3 = UMMC containing 8% urea + Napier grass
2.3. Preparation of UMMC
The required feed ingredients were purchased from local market and UMMC were prepared as followed by the steps according to the Table 1. At first according to the Table 1, all ingredients were weighed and kept in separate containers. Solid urea was grinded and added with limestone, cement and 1/2 of the common salt in a container and mixed thoroughly to prepare the Mixture-1. Grinded Mustard oil cake added with the broken maize, soybean meal (48), wheat bran and rest 1/2 of the common salt and mixed thoroughly to prepare Mixture-2. Then Mixture-1 and mixture-2 were mixed in another separate container.
Gradually molasses was added and mixed thoroughly to prepare a homogenous final mixture of the ingredients. Then the final mixture was entered into a metal tube of 60 cm length and 5 cm diameter. Hammer and rod valve were used to apply pressure in the mixture within the tube so that the mixture can be compact to form a better consistency of the cake. After entering the mixture into the metal tube the screws (beside the tube) were tightened and sundried for 2 - 3 days. After that the tubes were opened by loosening the screws and the hardened mass was cut into several pieces by a knife to prepare required size cake (20, 40,

Table 1. Ingredient and nutrient composition of UMMC.
N.B. 1 g urea is equivalent to 2.88 g CP. (FAO’s Animal Feed Resources Information System. 1991-2002).
50 and 60 g). Finally the prepared UMMC was kept in the container to be used for the experiment.
2.4. General Management
Each rabbit was kept in a separate steel-iron made cage (2 × 2 feet) equipped with feeder and waterer. Each experimental rabbits were earmarked with the permanent marker as well as with particular tags in front of their cages. The rabbits of the different groups were supplied with the same amount of Napier grass. All adult does of the Expt. I was supplied with 300 g Napier grass/doe/day and weaned rabbits under the Expt. II were supplied with 200 g during the 1st month of experiment and later months with 300 g Napier grass/rabbit/day. All rabbits were kept under same management practices with providing 16 h:8 h light and dark cycle. Good hygienic and sanitary condition was maintained during the study period. All data were recorded carefully throughout the experiment.
2.5. Parameters Studied
2.5.1. Parameters of Doe
1) Gestation period
The duration of pregnancy is also called the gestation period. The gestation period was recorded for each doe during the experimental period from October to December 2015.
2) Live weight gain of does (LWGD)
It was calculated by deducting the initial weight at mating from the final weight at 28 days after mating.
3) Conception rate
The conception rate was calculated for each treatment by dividing the number of pregnant does by the total number of mated does and multiplied by 100.
4) Litter size, Litter weight, individual kit weight and kit mortality
The litter size (total, alive and dead) was recorded at birth and at each week up to weaning. The litter weight and individual kit weight were recorded with the help of digital balance at birth, 7, 14, 21 and 28 days of age. Kit mortality was recorded from birth to weaning.
2.5.2. Parameters of Growing Rabbits
1) Live weight (LW) and live weight gain of rabbit
Rabbits were individually weighed to the nearest gram in the early morning before providing any food and water at the initial weight and weekly during the experimental period. Live weight gain was measured by deducting initial weight from final weight and divided by total days experiment.
2) Feed intake (FI) and feed conversion ratio (FCR)
Feed intake per doe was calculated for each doe by sum of the daily consumption for 28 days of age from 1st day of mating. Feed conversion ratio was calculated according to the formula of Ensmingar [13]
3) Performance index (PI)
The PI of the growing period was weekly calculated according to the equation described by North [14] .
2.5.3. Hematological and Faecal Parameters
Hemoglobin concentration, packed cell volume (PCV), erythrocyte sedimentation rate (ESR) red blood cells (RBC’s) count and White blood cells (WBC) count of experimental rabbit’s blood was determined by using the method described by Lamberg and Rothstein [15] . Faecal parameter such as faecal bacterial count was determined by using total viable count (TVC) method.
2.5.4. Statistical Analysis
Both the experiments were designed by using Completely Randomized Design (CRD). The collected data under this study were analyzed and presented using simple statistical techniques. The raw data were entered and sorted into MS Excel spread sheet, then analyzed using analytical software Statistical Package for the Social Sciences (SPSS, version 16) for descriptive analysis. All data were expressed as mean ± SEM. Differences were considered significant at 5% level of significance.
3. Results
3.1. Gestation Period
Dietary effect of UMMC containing different levels of urea on gestation period of rabbit does are presented in Figure 1. It shows that, average gestation periods were 31.00 days in rabbit does fed 0% urea containing UMMC (control group, T0) while it was 32.50, 31.40, 32.00 days in rabbit does fed 4% (T1), 6% (T2) and 8% (T3) urea containing UMMC, respectively. Although highest gestation period was observed in the does fed 4% urea containing UMMC (T1), still the average values were not differed significantly (P > 0.05) among the does of different groups.
3.2. Live Weight Gain of Does during Gestation Period
Significant differences (P > 0.05) in live weight gain of the does during gestation period were observed between the rabbit groups fed 0% (Control group, 7.74 g/day) and 6% urea containing UMMC (10.26 g/day) (Figure 2). Although, live weight gain was slightly higher in the rabbit does fed 4 and 8% urea containing UMMC (8.79 and 8.89 g/day, respectively), but were not significantly differed (P > 0.05) with the control group (7.74 g/day).
3.3. Conception Rate
Conception rate was significantly (P < 0.05) differed between the does fed UMMC without urea (80%) and the does fed 6% urea containing UMMC (100%) (Figure 3). However, there was no significant difference (P < 0.05) among the recorded conception rates (80% in each group) in the rabbits fed 0%, 4% and 8% urea containing UMMC.
3.4. Litter Size at Birth and Weaning
It was observed that litter size at birth was not significantly differed (P > 0.05) among the groups (Figure 4). Rabbit does fed 0%, 4%, 6% and 8% urea containing UMMC had 4.00, 4.25, 4.00 and 3.75 litter size, respectively and highest litter size was observed in does fed 6% urea containing UMMC. Litter size at weaning was significantly (P < 0.05) differed between the control group (2.75) and the dietary group (6% urea containing UMMC, 3.40). Although rabbit does fed 4%
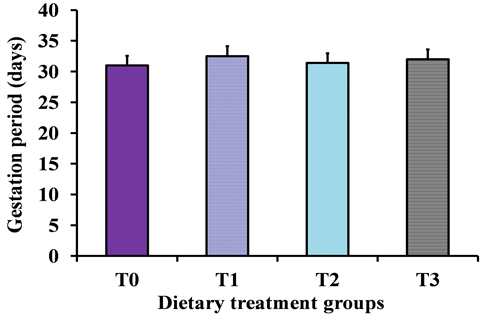
Figure 1. Effect of UMMC containing different levels of urea on gestation period of rabbit does (T0, UMMC containing 0% urea; T1, UMMC containing 4% urea; T2, UMMC containing 6% urea and T3, UMMC containing 8% urea). Each bar with error bar represents Mean ± SEM value. Differences were not significant at 5% level of significance (P > 0.05).

Figure 2. Effect of UMMC containing different levels of urea on live weight gain of rabbit does (g/doe/day) during gestation period (T0, UMMC containing 0% urea; T1, UMMC containing 4% urea; T2, UMMC containing 6% urea and T3, UMMC containing 8% urea). Each bar with error bar represents Mean ± SEM value. Differences were significant at 5% level of significance (P < 0.05).
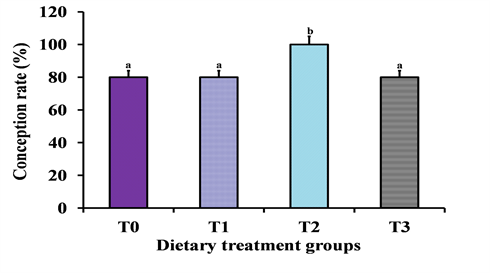
Figure 3. Effect of UMMC containing different levels of urea on conception rate of rabbit does (T0, UMMC containing 0% urea; T1, UMMC containing 4% urea; T2, UMMC containing 6% urea and T3, UMMC containing 8% urea). Each bar with error bar represents Mean ± SEM value. Differences were significant at 5% level of significance (P < 0.05).
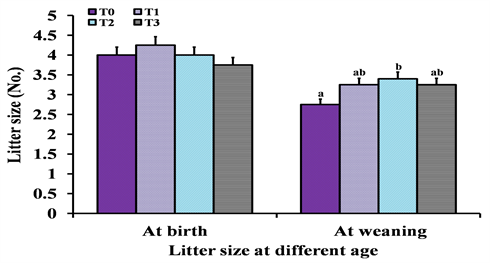
Figure 4. Effect of UMMC containing different levels of urea on litter size at birth and weaning of rabbit does (T0, UMMC containing 0% urea; T1, UMMC containing 4% urea; T2, UMMC containing 6% urea and T3, UMMC containing 8% urea). Each bar with error bar represents Mean ± SEM value. Differences were significant at 5% level of significance (P < 0.05).
and 8% urea containing UMMC (T1) showed a little higher litter size (3.25 and 3.25, respectively) but not significantly differed (P > 0.05) with the control group (2.75).
3.5. Litter Weight from Birth to Weaning
At birth and at 7th days, litter weight was not significantly differed (P > 0.05) among the rabbit does (Table 2). However, at 14th, 21st and 28th day of kindling litter weight was significantly differed (P < 0.05) between the does of control group and the dietary group (6% urea containing UMMC), but the rabbits fed 4 and 8% urea containing UMMC showed no significant (P > 0.05) variation with the control group.
3.6. Individual Kit Weight
There was not any significant differences (P > 0.05) in individual kit weight from birth to 21st days among the does of the different groups (Table 3), but significant differences (P < 0.05) in individual kit weight were observed at the 28 days of birth between the does of control group (210 g) and the group fed 6% urea containing UMMC (293 g). Although rabbit does fed 4% and 8% urea containing UMMC showed a little higher individual kit weight (279 g and 291 g, respectively) but not significantly differed (P > 0.05) with the control group (234 g).
3.7. Mortality Rate of Kits
Mortality rate was significantly (P < 0.01) differed among the rabbit groups fed 0%, 4% and 8% urea containing UMMC (31.25%, 23.52% and 13.30%, respectively) (Figure 5). Does fed 6% urea containing UMMC showed significant differences (P < 0.05) in mortality rate (20.00%) with the control group, but was not significant (P > 0.05) with other groups. Highest (31.25%) and lowest (20.00%) mortality rates were observed in the rabbit group fed 0% and 8% urea containing UMMC, respectively.
Table 2. Effect of UMMC containing different levels of urea on litter weight from birth to weaning of rabbit does.
a,b Mean values with different superscripts within the same row differed significantly; NS = Non significant (P > 0.05), * = Significant (P < 0.05). Values are expressed as Mean ± SEM. Here, T0, UMMC containing 0% urea; T1, UMMC containing 4% urea; T2, UMMC containing 6% urea and T3, UMMC containing 8% urea.
Table 3. Effect of UMMC containing different levels of urea on individual kit weight from birth to weaning of rabbit does.
a,b Mean values with different superscripts within the same row differ significantly; NS = Non significant (P > 0.05), * = Significant (P < 0.05). Values are expressed as Mean ± SEM. Here, T0, UMMC containing 0% urea; T1, UMMC containing 4% urea; T2, UMMC containing 6% urea and T3, UMMC containing 8% urea.
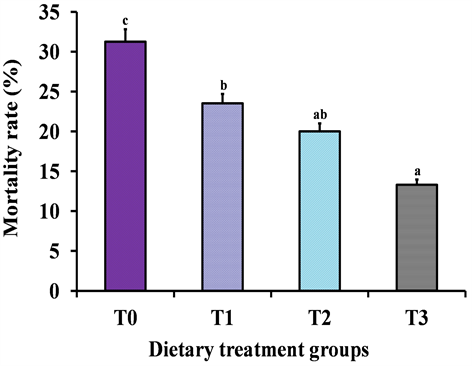
Figure 5. Effect of UMMC containing different levels of urea on mortality rate of kits of the does (T0, UMMC containing 0% urea; T1, UMMC containing 4% urea; T2, UMMC containing 6% urea and T3, UMMC containing 8% urea). Each bar with error bar represents Mean ± SEM value. Differences were significant at 1% level of significance (P < 0.05).
3.8. Live Weight Gain of Growing Rabbits
Effect of dietary UMMC supplementation on average weight gain of growing rabbits of Expt. II during the 20 weeks of experimental period is shown in Table 4. Result of this experiment revealed that average weight gain of young rabbits did not differed significantly (P > 0.05) among the rabbit groups up to 3 weeks of the experimental period. But from 4th week to 20th week of the experiment significant (P < 0.05) differences were observed among the rabbit groups. This study also showed that from the 4th week of the experiment consistently higher growth rate was observed in the rabbit group fed 6% urea containing UMMC (T2) than the rabbit group fed 0 (T0), 4 (T1) and 8% (T3) urea containing UMMC. At the end of the experiment highly significant (P < 0.001) weight gain was observed among the rabbit groups and it was 8.10, 9.11, 10.73 and 10.10 g/rabbit/day in the rabbit groups fed 0 (T0), 4 (T1), 6 (T2) and 8% urea (T3) containing UMMC, respectively.
3.9. Grass and UMMC Intake of Growing Rabbits
Grass intake of growing rabbit was not significantly (P > 0.05) differed among the rabbit groups (Figure 6). Grass intake was 133.10, 134.30, 135.40 and 133.60 g/day/rabbit in the rabbit groups fed 0 (T0), 4 (T1), 6 (T2) and 8% urea (T3) containing UMMC, respectively. Average daily UMMC intake of growing rabbits of Expt. II during the experimental period is shown in Figure 7. Average daily UMMC intake of growing rabbit was not significantly (P > 0.05) differed among the rabbit groups. UMMC intake was 49.1, 49.6, 50.0 and 49.0 g/day/rabbit in rabbit group fed 0 (T0), 4 (T1), 6 (T2) and 8% urea (T3) containing UMMC, respectively.
3.10. Feed Conversion Ratio (FCR) of Growing Rabbit
Results showed that FCR was significantly differed (P < 0.05) between the rabbits of control group (6.06) and rabbit fed 6% (4.63) and 8% (4.85) urea containing UMMC (Figure 8). Although rabbit fed 4% urea containing UMMC had showed slightly lower FCR (5.44) but was not significantly differed (P > 0.05) with the control group (6.06) (Figure 9).
3.11. Hemoglobin (g/dl) of Growing Rabbit Blood
Results of the hemoglobin content (g/dl) of growing rabbit blood of the Expt. II are shown in Table 5. No significant (P > 0.05) trend was detected for the hemoglobin of blood among the experimental rabbit groups. However, a rise in hemoglobin content were observed in the rabbit groups fed urea containing UMMC (11.65, 11.92 and 11.75 g/dl of blood in 4%, 6% and 8% urea containing UMMC fed rabbit group, respectively) compare to the control group (11.41 g/dl).
3.12. Packed Cell Volume (PCV)
Packed cell volume (PCV) of growing rabbit blood of Expt. II is presented in
Table 4. Effect of UMMC containing different levels of urea on live weight gain of growing rabbits.
a,b,c Mean values with different superscripts within the same row differ significantly (P < 0.05); NS = Non significant (P > 0.05), * = Significant (P < 0.05), ** = Significant (P < 0.01). Values are expressed as Mean ± SEM. Here, T0, UMMC containing 0% urea; T1, UMMC containing 4% urea; T2, UMMC containing 6% urea and T3, UMMC containing 8% urea.
Table 5. Effect of UMMC containing different levels of urea on hematological (blood cellular elements) parameters of rabbits.
a,b Mean values with different superscripts within the same row differ significantly (P < 0.05); NS = Non significant (P > 0.05), * = Significant (P < 0.05). Values are expressed as Mean ± SEM. Here, T0, UMMC containing 0% urea; T1, UMMC containing 4% urea; T2, UMMC containing 6% urea and T3, UMMC containing 8% urea.
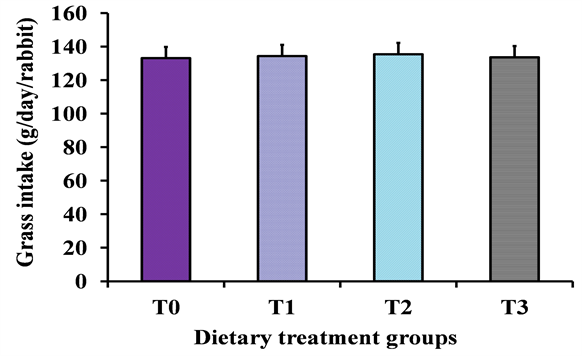
Figure 6. Effect of UMMC containing different levels of urea on grass intake of growing rabbits (T0, UMMC containing 0% urea; T1, UMMC containing 4% urea; T2, UMMC containing 6% urea and T3, UMMC containing 8% urea). Each bar with error bar represents Mean ± SEM value. Differences were not significant at 5% level of significance (P > 0.05).

Figure 7. UMMC intake of growing rabbits (T0, UMMC containing 0% urea; T1, UMMC containing 4% urea; T2, UMMC containing 6% urea and T3, UMMC containing 8% urea). Each bar with error bar represents Mean ± SEM value. Differences were not significant at 5% level of significance (P > 0.05).

Figure 8. Effect of UMMC containing different levels of urea on feed conversion ratio of growing rabbits (T0, UMMC containing 0% urea; T1, UMMC containing 4% urea; T2, UMMC containing 6% urea and T3, UMMC containing 8% urea). Each bar with error bar represents Mean ± SEM value. Differences were significant at 5% level of significance (P < 0.05).

Figure 9. Effect of UMMC containing different levels of urea on performance index of growing rabbits (T0, UMMC containing 0% urea; T1, UMMC containing 4% urea; T2, UMMC containing 6% urea and T3, UMMC containing 8% urea). Each bar with error bar represents Mean ± SEM. Differences were significant at 5% level of significance (P < 0.05).
Table 5. It was observed that no significant (P > 0.05) differences were observed in the blood PCV values among the groups. Highest PCV was observed in the rabbit group fed 6% urea containing UMMC (38.05%) while it was 35.24%, 36.41% and 35.78% in rabbit group fed 0 (T0), 4 (T1) and 8% urea (T3) containing UMMC, respectively.
3.13. Erythrocyte Sedimentation Rate (mm/h)
The values of ESR were not significantly (P > 0.05) differed among the groups (Table 5). However, it was also observed that rabbit group fed different level of urea containing UMMC had a somewhat higher ESR value than the control rabbit group. The highest ESR was recorded in rabbit group fed 8% urea containing UMMC group (T3) (2.56 mm/h) and lowest in control group (2.07 mm/h). Rabbit group fed 4 (T1) and 6% urea (T2) urea containing UMMC also showed a higher ESR value (2.35 and 2.51 mm/h, respectively) than the control group (T0).
3.14. Red Blood Cell Count (×106/μl)
RBC count was significantly differed (P < 0.05) between rabbits of the control group (6.05 × 10⁶/μl blood) the rabbit fed 4% (6.45 × 10⁶/μl blood) and 8% (6.49 × 10⁶/μl blood) urea containing UMMC (Table 5). Rabbit fed 6% urea containing UMMC showed a higher RBC count (6.27 × 10⁶/μl blood) but was not significantly differed with the control group. Highest RBC was counted in rabbit group fed 8% urea containing UMMC (6.49 × 10⁶/μl blood) and lowest value was in control group (6.05 × 10⁶/μl blood).
3.15. White Blood Cells Count (×103/μl)
White blood cells count (WBC) of growing rabbit blood of Expt. II is shown in Table 5. It was observed that WBC count of experimental rabbit blood was significantly (P < 0.05) differed between the rabbits of the control group (7.13 × 10³/μl blood) and the rabbit fed 6% urea containing UMMC (8.69 × 10⁶/μl blood). Though rabbit fed 4% (7.81 × 10³/μl blood) and 8% (7.58 × 10³/μl blood) urea containing UMMC showed a higher WBC count, but was not significantly differed (P > 0.05) with the control group. Highest WBC count was recorded in rabbit group fed 6% urea containing UMMC (8.69 × 10³/μl blood) and lowest value was in control group (7.13 × 10³/μl blood).
3.16. Fecal Bacterial Count (×103 cfu/g)
Effect of dietary UMMC supplementation on the fecal bacterial count of growing rabbit of Expt. II is presented in Figure 10. Number of fecal bacteria was significantly (P < 0.05) differed between the rabbits of control group (1.77 × 10³ cfu/g of feces) and the rabbits group fed 6% urea containing UMMC (2.51 × 10³ cfu/g of feces). However, rabbits fed 4% (2.12 × 10³ cfu/ g of feces) and 8% (2.38 × 10³ cfu/g of feces) urea containing UMMC showed a higher fecal bacterial count but not significantly differed (P < 0.05) with the control group.
3.17. Preparation Cost of UMMC
Cost of UMMC preparation is presented in Table 6. It was found that cost of 1 Kg. UMMC preparation is significantly lower (P < 0.05) then the price of available commercial pellet. For the preparation of 1 kg UMMC containing 0 (T0), 4 (T1), 6 (T2) and 8% (T3) urea required 0.34, 0.34, 0.33 and 0.33 USD, respectively while 1kg local commercial pellet price is 0.53 USD.
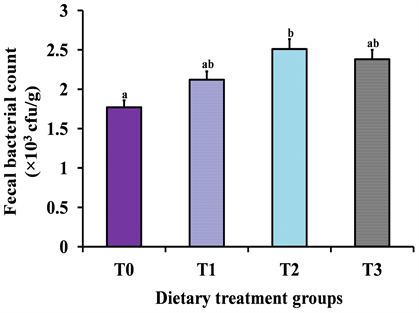
Figure 10. Effect of UMMC containing different levels of urea on fecal bacterial count of rabbit (T0, UMMC containing 0% urea; T1, UMMC containing 4% urea; T2, UMMC containing 6% urea and T3, UMMC containing 8% urea). Each bar with error bar represents Mean ± SEM value. Differences were significant at 5% level of significance (P < 0.05).
Table 6. Preparation cost of UMMC in different dietary treatment groups and their comparison with the available pellet price.
a,b Mean values with different superscripts within the same row differ significantly (P < 0.05); NS = Non significant (P > 0.05), * = Significant (P < 0.05). Values are expressed as Mean ± SEM. Here, T0, UMMC containing 0% urea; T1, UMMC containing 4% urea; T2, UMMC containing 6% urea and T3, UMMC containing 8% urea.
4. Discussion
Dietary effect of UMMC on gestation period of rabbit does observed in the Expt. I was not differed among the groups which were ranged from 31.40 to 32.00. The result indicates that UMMC has no effect on the gestation period of rabbit does. Present findings are somewhat similar to the findings of Salma et al. [16] , they found a gestation period 31.60 - 32.30 days in rabbit does supplied with different levels of protein. Rashwan et al. [17] also reported that rabbit does normally kindled in 31.00 - 33.00 days after natural mating or artificial insemination.
UMMC increased live weight gain of does during gestation period between the rabbit groups fed 0% urea containing UMMC (Control group, 7.74 g/day) and 6% urea containing UMMC (10.26 g/day). This differences in live weight gain of does during gestation period was observed most probably due to the higher level of non-protein nitrogen in the rabbit diet supplied by the addition of urea into the UMMC, which increased the protein level of rabbit and caused higher live weight gain. Partridge and Allan [18] and Adams [19] , determined that rabbit needs higher protein (around 20%) to optimize reproductive performances than those needed for growth. UMMC contains urea, the most important source of non-protein nitrogen. This non-protein nitrogen improved the body protein level and helps to meet up the protein requirement of does during gestation period resulted higher live weight gain of the does.
Effect of UMMC on conception rate was differed between the does of control group (80%) and the group fed 6% urea containing UMMC (100%). But no differences in conception rate were observed among other groups (T0, T1 and T3). Conception rate of the present study was almost similar to the previous findings of Yono et al. [20] , where they found a variation in conception rate ranged between 82% - 96% by feeding the does with or without urea supplementation. Variation in conception rate may be due to the differences in the levels of urea supplementation to the does. Reproductive events, like follicular development, ovulation and fertilization are depend on dietary nutrition especially on dietary protein. To support these events of conception, optimum protein is required which might be supplied in the rabbits fed 6% urea containing UMMC, as a result it showed better conception rate (100%) than the other rabbit groups. In spite of higher level of urea (8%) containing UMMC fed by the rabbits, comparatively lower conception rate (80%) was observed than the rabbit fed 6% urea containing UMMC (100%) and it was occurred might be due to the alteration of uterine and vaginal pH by high blood urea nitrogen contributed by the higher levels of urea (8%) containing UMMC. Optimal vaginal and uterine pH to maintain sperm viability and motility for conception ranges from 7.0 to 8.5 [21] . Reduction in sperm motility was seen at a vaginal pH of less than 6.0 which may reduce the conception rate [22] [23] . When blood urea nitrogen is increased vaginal and uterine pH is decreased [24] .
Present study revealed that UMMC have effect on litter size at weaning though have no effect at birth. This differences in litter size of the rabbit does fed urea containing UMMC were due to the increased protein level by the addition of urea which caused a more protein balance in the rabbit milk and also caused more milk production, as a result kits of the does supplied with UMMC had a higher survivability and caused higher litter size. However, this result was little higher than that of Hasanat et al. [25] , they found a litter size 2.50 - 3.25 at birth and 1.37 - 2.37 at weaning in rabbits supplied with the same concentrate supplement used in this study except addition of urea.
Litter weight from birth to weaning was not differed among the groups up to 7 day of kindling but it was differed at 14, 21 and 28 days between the does of control group and the group fed 6% urea containing UMMC. Urea increases the protein level of does and higher protein level causes higher milk production [26] [27] and higher intake by the kits of the rabbits fed UMMC, as a result litter weight was higher at 14, 21 and 28 days after kindling. Present study supports the result of Hasanat et al. [25] they also found a higher litter weight from birth to weaning (180.3 g vs. 137.1 g in concentrate supplemented and non-supplemented group of rabbits, respectively).
Differences in individual kit weight at 28 days between the does of control group (210.4 g) and the group fed 6% urea containing UMMC (292.6 g) may be due to the higher amount of protein enriched milk consumption of kits of the does supplied with urea containing UMMC. Yono et al. [20] observed that providing urea along with low crude protein diet increased the individual kit weight at birth (58.6 g vs. 63.8 g).
Mortality rates of rabbits were lowest in the rabbits fed 8% urea containing UMMC (13.30%) and highest in the rabbits fed UMMC without urea (control group, 31.25%). Until 18 - 19 days of age, kits are entirely depends on the milk of their mother [28] . Therefore, early livability performances of litter are closely related to the quantity and quality of the milk ingested [26] [27] [29] [30] [31] . UMMC increased the protein level of does, higher protein level in the rabbit diet increased milk production [32] which in turn caused more milk ingestion by the kits resulting increased survivability and decreased mortality in the rabbit groups fed UMMC. Present findings are the agreement to the findings of Salma et al. [16] and Yono et al. [20] .
Live weight of growing rabbit was not differed from the 1st to 6th weeks of the experiment, but it was differed from the 7th to 20th week of the experimental period among the rabbit groups. Higher weight was observed in 4% and 8% urea containing UMMC than the rabbits fed 0% urea containing UMMC and live weight was highest in the rabbits group fed 6% urea containing UMMC. This significant difference in live weight gain of growing rabbits supplied with urea containing UMMC was due to the high blood protein level of rabbit contributed by the non-protein nitrogen (urea). This higher level of protein helped in the body formation of growing rabbits which caused more live weight gain in the rabbits fed UMMC then the rabbits fed UMMC without urea. Using MNBs as a feed supplement, Ramchurn et al. [33] also found a higher live weight in the treatment group.
Live weight gain of growing rabbits differed among the groups from 4th week to 20th week of the experiment. At the end of the experiment, higher growth rate was found in the rabbit groups fed UMMC. This may be due to the high protein level contributed by the urea which helps in the body building of growing rabbits. Ramchurn et al. [33] has also found that MNB supplementation has an effect in weight gain of rabbits (14.8 ± 5.82 g/head/day) in control group was less than the rabbits supplied with MNB containing 15% and 30% cement (23.4 ± 3.50 and 26.4 ± 6.30 g/head/day, respectively). However, many researchers observed that weanling rabbits did not showed any remarkable response in their growth performance by feeding urea supplements with low protein diets [34] [35] .
UMMC supplementation had no effect on the grass intake and UMMC intake of growing rabbits. However, Feed conversion ratio (FCR) in growing rabbit was differed among the rabbits of control group (6.06) and rabbit fed 6% (4.63) and 8% (4.85) urea containing UMMC. It was occurred most probably due to the increasing live weight gain of urea containing UMMC treated rabbit groups. Present result supports the result of Rahman et al. [36] , they also found differences in feed conversion ratio (16.23, 19.28, 25.65) by using 1% urea, 2.5% bentonite and 1% urea + 2.5% bentonite against the control group (19.28).
Performance index (PI) of growing rabbit was differed among the groups. Better performance of the growing rabbit supplied with UMMC was may be due to the efficient utilization of urea by the cecal microbes and converting it into the body protein.
UMMC did not alter the blood parameters including ESR, Hb and PCV% of the experimental rabbits and there values were within the normal range (10.67 to 12.60 g/dl) recorded by Njidda et al. [37] and Njidda and Isidahomen [38] which indicates that up to 8% urea in the UMMC is safe for rabbit and had no negative impact on its health status. However, slightly higher Hb level in the rabbits fed UMMC indicates that the experimental UMMC helped in maintaining good nutritional status of rabbit because hematological parameters especially PCV and Hb are positively correlated with the nutritional status of the animal [39] . Present findings are agreement with the findings of the Mandour et al. [40] they also did not found any differences in the Hb level of rabbit blood due to the feeding of urea. Present results of PCV were also close to the range of 31.00% to 38.00% reported by Shah et al. [41] . PCV is a blood toxicity reduction index and its abnormal level point to the presence of a toxic factor which has a drastic effect on blood formation [42] . This suggests that detoxification of urea processing was good enough as demonstrated in the normal PCV range of values observed for rabbits on diets containing urea.
Erythrocyte sedimentation rate (ESR) was not differed among the rabbit groups. Slightly increased ESR in the treatment group may be due to the increased blood urea as well as protein level which causes a slightly heavier weight of the RBC to sediment in a less time than the RBC of control group of rabbits. This also indicates that use of UMMC do not causes basic alteration in the normal physiological value of blood parameters as well as normal physiological condition of rabbit. Present findings was within the normal range 1.18 - 3.16 mm/h reported by Chineke et al. [43] .
On the other hand, red blood cell (RBC) counts differed between the rabbits of the control group and the rabbit fed 4% and 8% urea containing UMMC. The values were within the normal range 3.8 to 7.9 × 10⁶/mm3 reported by Njidda and Isidahomen [38] . Rabbit groups fed urea containing UMMC had a higher protein levels which is needed for the RBC formation as a result higher RBC count in the rabbits fed urea treated UMMC. Present result supports the results of the Mandour et al. [40] , they also found a differences in the RBC count of rabbit blood due to the feeding of different levels of urea. Present WBC count results were close to the range of 5 to 13 × 103/μl reported by Njidda and Isidahomen [38] . Normal WBC values are the indication of non-allergic conditions, free parasitism or absence of foreign body in circulating system [44] .
Fecal bacterial count was differed between the rabbits of control group and the rabbits fed 6% urea containing UMMC. Highest fecal bacterial count was observed at rabbits fed 6% urea containing UMMC (2.51 × 10³ cfu/ ml) and lowest bacterial count was observed at the control group (1.77 × 10³ cfu/ ml). Adding urea to rabbit feed provide adequate levels of ammonia in the cecum for continuous growth of cecal microbes [36] . Rabbits fed urea containing UMMC supplied more urea to the rabbit which is absorbed and presented to the caecum. More urea in the caecum is utilized by the cecal microbes and produces more ammonia nitrogen which is the potential substrates that allows the growth of microorganisms. As a consequence, increased microbes in the caecum caused increased bacterial count in the fecal contents. Present finding supports the findings of the Carabaño et al. [45] , they found that an increase of the nitrogen flow into the caecum could favour the changes in microbial growth as a result more microbial population in the caecum as well as feces.
UMMC not only improved the productive and reproductive performances of rabbits, but it was also cheaper than the available commercial pellet used as rabbit concentrates and its cost was 0.19 USD less than the commercial pellet in each kg, which showed more economic efficiency of using UMMC over other concentrate supplements.
5. Conclusion
UMMC has significant effects in improving both productive and reproductive performances of rabbit, and the addition of 6% urea in preparing UMMC is the best level for rabbit production without any adverse effect. Limitation of unavailability of commercial concentrate supplement of rabbit and their high price may also be overcome by using UMMC. These findings may suggest and encourage the farmers for rabbit production by using UMMC with locally available green grass, which may contribute to meet up the national protein demand as well as develop the economy of Bangladesh.
Acknowledgements
The author expresses his thankful gratitude to the HEQEP/UGC/World Bank for the financial support for conducting the research work.
Conflicts of Interest
The authors declare that there is no conflict of interest in conducting and publishing this research work.
Cite this paper
Ruknuzzaman, M., Miah, A.G., Sobuz, S.H., Hamid, M.A., Asaduzzaman, M. and Salma, U. (2018) Effect of Dietary Urea Molasses Multi-Nutrient Cake (UMMC) on Productive and Reproductive Performance of Rabbit. Open Journal of Veterinary Medicine, 8, 146-166. https://doi.org/10.4236/ojvm.2018.88014
References
- 1. Onwuka, C.F.I., Egbe D.W. and Udoh, B.I. (1995) Milk Production Potential of Holstein Friesian Cattle in the derived Savannah Zone. Nigerian Journal of Animal Production, 21, 24-31.
- 2. Fielding, D. (1993) Rabbit. Macmillan Education Ltd., Lon-don and Basingstoke, 1-101.
- 3. Peters, J.A., Hales, T.G. and Lambert, J.J. (1988) Divalent-Cations Modulate 5-HT3 Receptor-Induced Currents in N1E-115 Neuroblastoma Cells. European Journal of Pharmaceutical Science, 151,491-495. https://doi.org/10.1016/0014-2999(88)90550-X
- 4. Owen, O.J., Alawa, J.P., Wekhe, S.N., Isirimah, N.O., Chukuigwe, E.C., Aniebo, A.O., Ngodigha, E.M. and Amakiri, A.O. (2008) Incorporating Poultry Litter in Animal Feed: A Solid Waste Management Strategy. Egyptian Journal of Animal Production, 7, 520-528. (In press)
- 5. Bhatt, R.S., Bhasin, V. and Bhatia, D.R. (2010) Growth Patterns in Soviet Chinchilla Rabbit. Asian-Australian Journal of Animal Science, 12, 213-3278.
- 6. Ojebiyi, O.O., Farinu, G.O., Babatunde, G.M. and Aderinola, O.A. (2008) Evaluation of the Nutritive Potential of Cassava (Manihot esculenta crantz) Peels Blood Meal Mixture on the Performance Characteristics of Female Growing Rabbits in the Derived Savannah Zone of Nigeria. 9th World Rabbit Congress, Verona, 10-13 June 2008, 769-773.
- 7. Perez, R., (1990) Manual de Crianza: conejos. Ministerio del Azúcar, Havana, Cuba, 101.
- 8. Dinh Binh, V., Chinh Bui, V. and Preston, T.R. (1991) Molasses-Urea Blocks as Supplements for Rabbits. Livestock Research for Rural Development, 3, 27-59.
- 9. Marounek, M., Vovk, S.J. and Skfiivanova, V. (1995) Distribution of Activity of Hydrolytic Enzymes in the Digestive Tract of Rabbits. British Journal of Nutrition, 73, 463-469. https://doi.org/10.1079/BJN19950048
- 10. Oluokun, J.A. (2001) Performance of Growing Rabbits Fed a Low Protein Diet Supplemented with Urea or Roasted Soybean Meal. Journal of Animal Production Research, 17, 89-99
- 11. Makkar, H.P.S. and Singh, B. (1987) Enzymatic Profile of Rabbit Cecum and the Rumen. Journal of Applied Rabbit Research, 10, 172-174.
- 12. Houpt, T.R. (1967) Urea Metabolism in the Rabbit. Federation Proceedings, 20, 349.
- 13. Ensmingar, M.E. (1980) Poultry Science. 2nd Edition, The Interstates Printers & Publishers, INC, Danville, Illinois, USA
- 14. North, M.O. (1983) Commercial Chicken Production Manual. 2nd Edition, AVI Publishing Company Inc., New York.
- 15. Lamberg, S.L. and Rothstein, R. (1977) Laboratory Manual of Hematology and Urinalysis. Avi Publishing Company, Inc., West Port, Connecticut, USSR.
- 16. Salma, U., Miah, A.G., Khandaker, Z.H. and Reza, A. (2002) Effect of Different Levels of Protein Supplementation on Reproductive Performance of Rabbit Does Under Tropical Conditions. Pertanika Journal of Tropical Agricultural Science, 25, 93-97.
- 17. Rashwan, A.A., Szendro, Z., Matics, Z., Szalai, A., Biro-Nemeth, E., Szendro, E. and Nagy, I. (2003) Effect of the Time of Insemination and the Litter Size on the Gestation Length of Rabbits. World Rabbit Science, 11, 75-85.
- 18. Partridge, G.G. and Allan, S.J. (1982) The Effects of Different Intakes of Crude Protein on Nitrogen Utilization in the Pregnant Lactating Rabbit. Animal Production, 35, 145-155. https://doi.org/10.1017/S000335610000091X
- 19. Adams, C.E. (1983) Repro-ductive Performance of Rabbits on a Low Protein Diet. Laboratory Animal, 17, 340-345. https://doi.org/10.1258/002367783781062244
- 20. Yono, C.R., Cheeke, P.R. and Patton, N.M. (1986) Growth and Reproductive Performance of Rabbits on a Moderately Low Crude Protein Diet with or without Methionine or Urea Supplementation. Journal of Animal Science, 63, 795-803. https://doi.org/10.2527/jas1986.633795x
- 21. Kelly, K.G. (1990) Tests on Vaginal Discharge. In: Walker, H.K., Hall, W.D. and Hurst, J.W., Eds., Clinical Methods: The History, Physical, and Laboratory Examinations, 3rd Edition, Butterworths, Boston, 833-835.
- 22. Makler, A., David, R. and Blumenfeld, Z. (1981) Factors Affecting Sperm Motility. VII. Sperm Viability as Affected by Change of pH and Osmolality of Semen and Urine Specimens. Fertility and Sterility, 36, 507-511. https://doi.org/10.1016/S0015-0282(16)45802-4
- 23. Peek, J.C. and Matthews, C.D. (1986) The pH of Cervical Mucus, Quality of Semen, and Outcome of the Post Coital Test. Clinical Reproduction and Fertility, 4, 217-225.
- 24. Butler, W. (2005) Relationships of Dietary Protein and Fertility. Department of Animal Science, Cornell University, Ithaca.
- 25. Hasanat, M.S., Hossain, M.E., Mostari, M.P. and Hossain, M.A. (2006) Effect of Concentrate Supplementation on Growth and Reproductive Performance of Rabbit under Rural Condition. Bangladesh Journal Veterinary Medicine, 4, 129-132.
- 26. McNitt, J. and Moody, G.L. (1988) Milk Intake and Growth Rates of Suckling Rabbits. Journal of Applied Rabbit Research, 11, 117-119.
- 27. Fraga, M.J., Lorente, M., Carabano, M. and Blas, J.C. (1989) Effect of Diet and of Remating Interval on Milk Production and Milk Composition of the Doe Rabbit. Animal Production, 48, 459-466. https://doi.org/10.1017/S0003356100040460
- 28. Maertens, L. and Groote de, G. (1990) Comparison of Feed Intake and Milk Yield of Does under Normal and High Ambient Temperature. Journal of Applied Rabbit Research, 13, 159-162.
- 29. Lebas, F. (1969) Alimentation lactée et croissance pondérée du lapin avant sevrage. Annales de Zootechnie, 18, 197-208. https://doi.org/10.1051/animres:19690207
- 30. Lebas, F. (1976) Mesure quantitative de la production laitière chezla lapine. Annales de Zootechnie, 17, 169-182. https://doi.org/10.1051/animres:19680204
- 31. Szendrö, Z.S. and Maertens, L. (2001) Maternal Effect during Pregnancy and Lactation in Rabbits (A Review). Acta Agraria Kaposváriensis, 5, 1-21.
- 32. Pontes, P.M., Lleonart, R.F., Castello, L.J.A. and Mestres, D.F. (1995) Effect of Dietary Protein and Amino Acid Level on Milk Production of Doe-Rabbits. Annales De Zootechnie, 29, 436.
- 33. Ramchurn, R., Dullul, Z.B., Ruggoo, A. and Ruggoo, J. (2000) Effects of Feeding Star Grass (Cynodon plectostacyus) on Growth and Digestibility of Nutrients in Domestic Rabbit. Livestock Research for Rural Development, 12, 31-37.
- 34. Lebas, F. and Colin, M. (1973) Effect of Adding Urea to a Low Protein Diet for Growing Rabbits. Annales de Zootechnie, 23, 577. (In French) https://doi.org/10.1051/animres:19740411
- 35. Lang, J. (1981) The Nutrition of the Commercial Rabbit. Physiology, Digestibility and Nutrient Requirements. Nutrient Abstract Revised, 51, 197-225.
- 36. Abdl-Rahman, M.A., Saleh Sohair, Y., Zaki Amal, A. and Abd El-Hamid Safaa, S. (2011) Growth Performance, Cecal Fermentation and Blood Biochemistry of Rabbits Fed Diet Supplemented with Urea-Bentonite Combination. Journal of Agricultural Science, 3, 124-129. https://doi.org/10.5539/jas.v3n1p14
- 37. Njidda, A.A., Igwebuike, J.U. and Isidahomeh, C.E. (2006) Haematological Parameters and Carcass Characteristic of Weanling Rabbits Fed Graded Levels of Molasses. Global Journal of Agricultural Science, 5, 167-172.
- 38. Njidda, A.A. and Isidahomen, C.E. (2011) Hematological Parameters and Carcass Characteristics of Weanling Rabbits Fed Sesame Seed Meal (Sesamum indicum) in a Semi-Arid Region. Pakistan Veterinary Journal, 31, 35-39.
- 39. Adejumo, D.O. (2004) Performance, Organ Development and Hematological Indices of Rats Fed Sole Diets of Graded Levels of Cassava Flour and Soybean Flour (Soygari) as Substitutes for Energy and Protein Concentrates. Tropical Journal of Animal Science, 7, 57-63.
- 40. Mandour, M.A., Al-Shami, S.A. and Hossein, Y.A. (2012) Effect of Feeding Graded Levels of Urea on Growing New Zealand Rabbit Performance. Global Vet, 9, 761-768.
- 41. Shah, M.K., Khan, A., Rizvi, F., Siddique, M. and Rehman, S. (2007) Effect of Cypermethrin on Clinico Haematological Parameters in Rabbits. Pakistan Veterinary Journal, 27, 171-175.
- 42. Oyawoye, E.O. and Ogunkunle, M. (1998) Chemical Analysis and Biochemical Effects of Raw Jack Beans on Broiler. Nigerin Society of Animal Production, 23, 141-142.
- 43. Chineke, C.A., Ologun, A.G. and Ikeobi, C.O.N. (2006) Haematological Parameters in Rabbit Breeds and Crosses in Humid Tropics. Pakistan Journal of Biological Science, 9, 2102-2106. https://doi.org/10.3923/pjbs.2006.2102.2106
- 44. Lehninger, A.L., Nelson, D.L. and Cox, M.M. (1993) Principal of Biochemistry. 2nd Edition, CBS Pub., New Delhi.
- 45. Carabaño, R., Villamide, M.J., García, J., Nicodemus, N., Llorente, A., Chamorro, S., Menoyo, D., García-Rebollar, P., García-Ruiz, A.I. and Blas de, J.C. (2011) New Concepts and Objectives for Protein-Amino Acid Nutrition in Rabbits. Nutrition and Digestive Physiology, 6, 88-94.