Advances in Microbiology
Vol.3 No.6A(2013), Article ID:37928,11 pages DOI:10.4236/aim.2013.36A004
Vertical Heterogeneity of Genotypic Structure and Toxic Potential within Populations of the Harmful Cyanobacterium Microcystis aeruginosa
1Clermont Université, Université Blaise Pascal, LMGE, Clermont-Ferrand, France
2CNRS, UMR 6023, LMGE, Aubiere, France
3Laboratoire des Processus de Transferts et d’Echanges dans l’Environnement (PROTEE EA 3819), Equipe Ecologie et Biologie des Milieux Aquatiques, Université du Sud-Toulon-Var, La Garde Cedex, France
Email: *ben.misson@hotmail.com
Copyright © 2013 Benjamin Misson, Delphine Latour. This is an open access article distributed under the Creative Commons Attribution License, which permits unrestricted use, distribution, and reproduction in any medium, provided the original work is properly cited.
Received July 5, 2013; revised August 5, 2013; accepted August 15, 2013
Keywords: Cyanobacteria; Microcystis aeruginosa; Genetic Structure; Toxic Potential; Vertical Heterogeneity
ABSTRACT
We investigated the vertical variability of toxic potential (i.e. proportions of cells containing microcystin genes) and genotypic structure within different populations of Microcystis aeruginosa that developed in deep artificial reservoirs on the Loire River (France). We demonstrated that a great qualitative vertical heterogeneity could exist within a single bloom of this cyanobacterium in deep lakes. Indeed, we observed important vertical shifts of both toxic potential and genotypic structure, whatever the bloom magnitude. These variations occurred mainly within the euphotic zone and proved to occur independently from abundance vertical shifts. One of the most striking results of this study is that the genotypic structure of a population of M. aeruginosa was more variable between different depths sampled at a single site than between different sites of the same reservoir sampled on top of the water column. In the same way the proportion of potentially toxic cells was sometimes more variable vertically than horizontally. The occurrence of such vertical heterogeneity in three different blooms suggests that this could be a frequent pattern within populations of M. aeruginosa.
1. Introduction
Microcystis aeruginosa is a widespread cyanobacterium that can proliferate in freshwater ecosystems to form dense blooms in surface waters. These blooms can cause many ecological, socio-economical and health hazards, especially when M. aeruginosa cells produce the microcystin, a potent hepatotoxin [1-3]. Many comprehensive studies have therefore been realized in order to explain the ecological success of this cyanobacterium and to unravel the complex set of factors driving both its dynamics and its toxicity. Such previous studies mainly dealt with the genetic diversity of M. aeruginosa’s populations [4-7], the toxic potential of M. aeruginosa [8-12], and the determinism of the different steps of M. aeruginosa’s life cycle [13-16].
From these numerous investigations, it was demonstrated that the toxic potential in M. aeruginosa’s blooms resulted from the abundance of cells carrying microcystin genes, the expression of these genes, the various production rates of microcystin by the various toxic strains present in the bloom, the fate of the microcystins produced and the microcystin variants that were produced [10, 17-21]. All these toxic-potential-related parameters could be regulated by different intracellular or environmental factors (both biotic and abiotic), resulting in a high temporal variability [8,22,23] and the impossibility to predict the toxicity of a bloom.
Concerning the dynamics of M. aeruginosa’s populations, although the growth control by resources availability and climate is quite well known [24], the drivers of the temporal succession of different genotypes leading to bloom development and decay [23,25,26] still remain to be elucidated. Moreover, temporal shifts of the genotypic structure at a given sampling point can be accompanied by significant variations of the toxic potential of a bloom and can occur within two weeks [8,27]. Understanding the regulation of this temporal genotypic succession is thereafter of major importance. Several putative driving forces have already been proposed: fitness-related selection during the growth period [23,25], contribution from other sites within the ecosystem, through horizontal transport [25,28] or selective interactions with the benthic compartment [14,15,29]. However, such contribution relies on a heterogeneous spatial distribution that is yet to be further characterized within natural populations of M. aeruginosa.
To date, the spatial heterogeneity within a single population of M. aeruginosa has only been demonstrated in the horizontal dimension, on top of the water column [25,28]. However, because of water column mixing events, of the continuous sedimentation of some colonies of M. aeruginosa throughout the bloom period [29], and of the ability of the colonies to migrate in the water column [30], the colonies of M. aeruginosa are observed throughout the water column. Then the question arises whether this vertical distribution could result in a vertical structuration of natural populations of M. aeruginosa, regarding their genetic structure and toxic potential. Through water column mixing, one can expect a homogeneous vertical distribution of the main genotypes constituting a population. On the contrary, considering that colonies can migrate more or less deep and more or less fast depending on their size [30], and considering that different genotypes may present various tolerances to deep environments conditions, one could predict a vertical heterogeneity within a population. Considering these hypotheses, such a vertical heterogeneity could represent another source of genotypic succession observed on top of the water column.
In order to provide a first qualitative assessment of the vertical structure within natural populations of M. aeruginosa, we investigated three different blooms, differing in their magnitude and sampled in two different freshwater reservoirs. In relation to physicochemical assessment allowing characterizing the stability of the water column, we studied the vertical variations of abundance, toxic potential and genetic structure of M. aeruginosa’s populations.
2. Material and Methods
2.1. Site Description, In-Situ Measurements and Sampling
Sampling was carried out in lakes Grangent and Villerest, two artificial dam reservoirs established on the Loire River, in France (Figure 1). On September 7th 2009, three sites of the Grangent reservoir and one site of the Villerest reservoir were investigated (for more information on the sampling stations, see Table 1). At each sampling station, water was sampled at −0.5 m, −2.5 m, −5 m, −7.5 m, −10 m, −15 m, −20 m, −25 m and −30 m depending on the maximal depth of the sampling sites.
In 2010, sampling was completed by investigating Villerest reservoir on September 6th and 22nd. For this second year, and according to the results obtained for the year 2009, sampling depths were modified as follows: surface scum, −0.5 m, −1.5 m, −2.5 m, −5 m, −7.5 m,
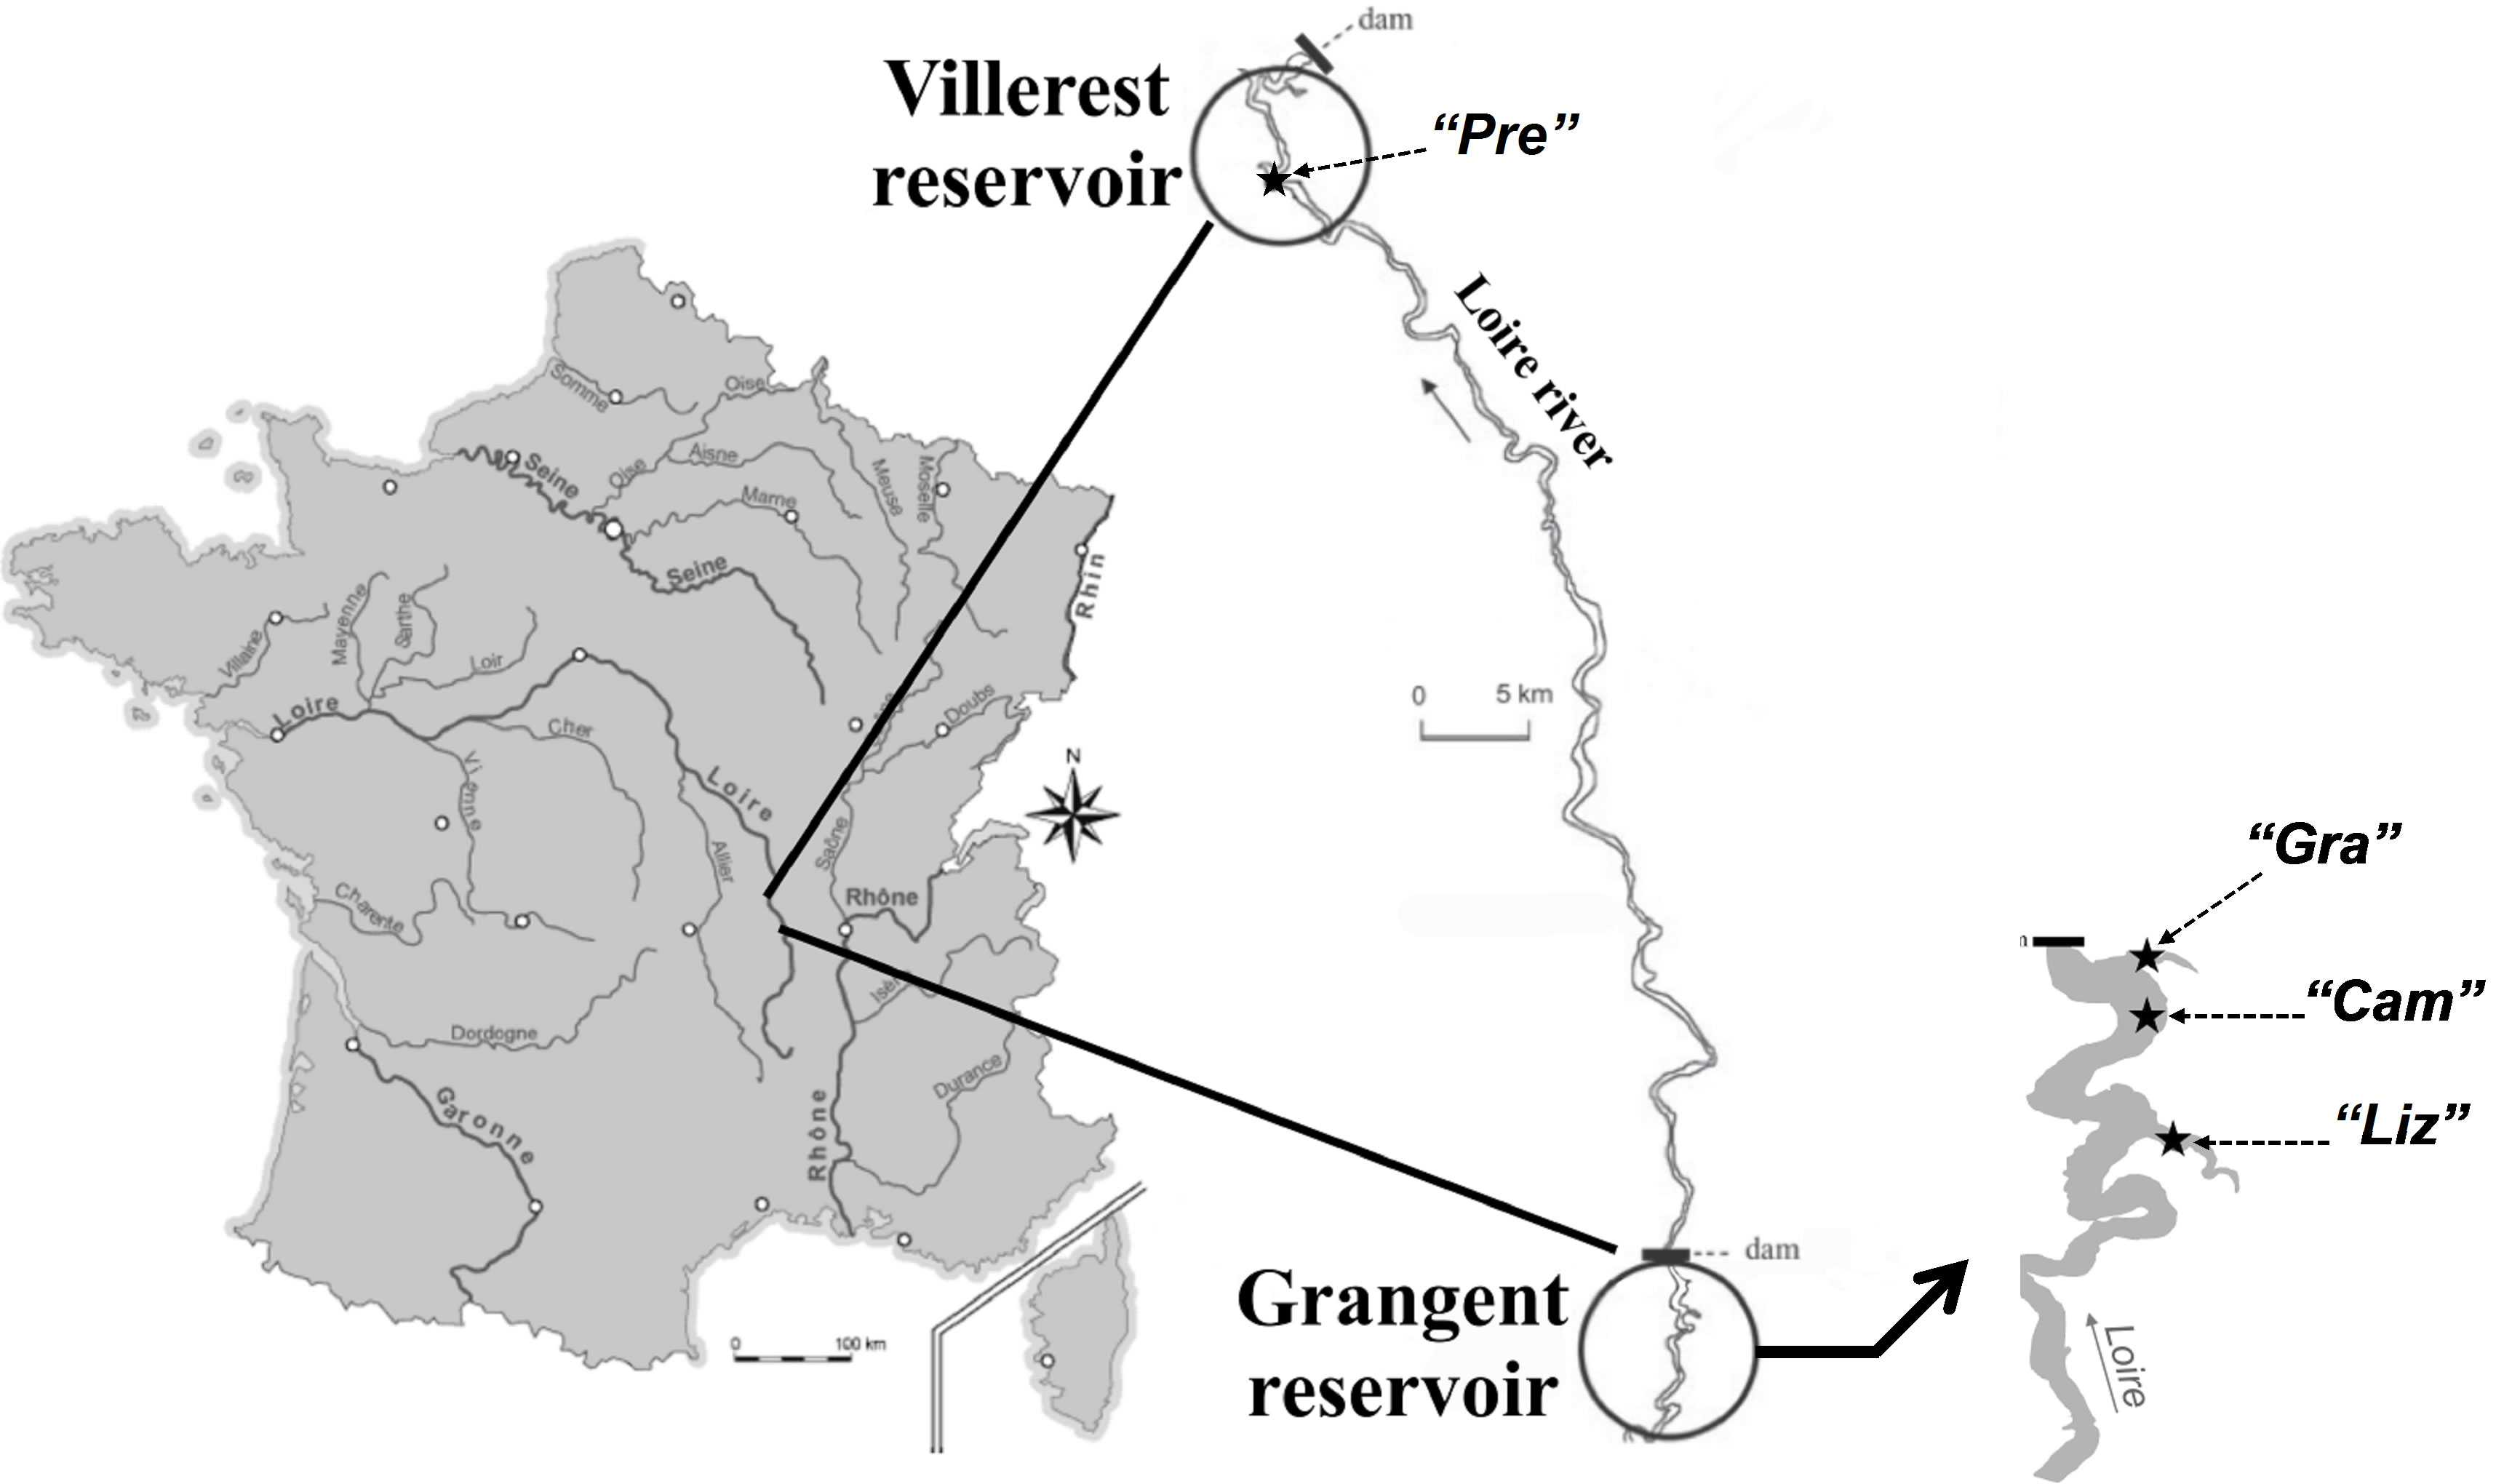
Figure 1. Geographical location of the two French reservoirs studied and sampling locations in each reservoir.
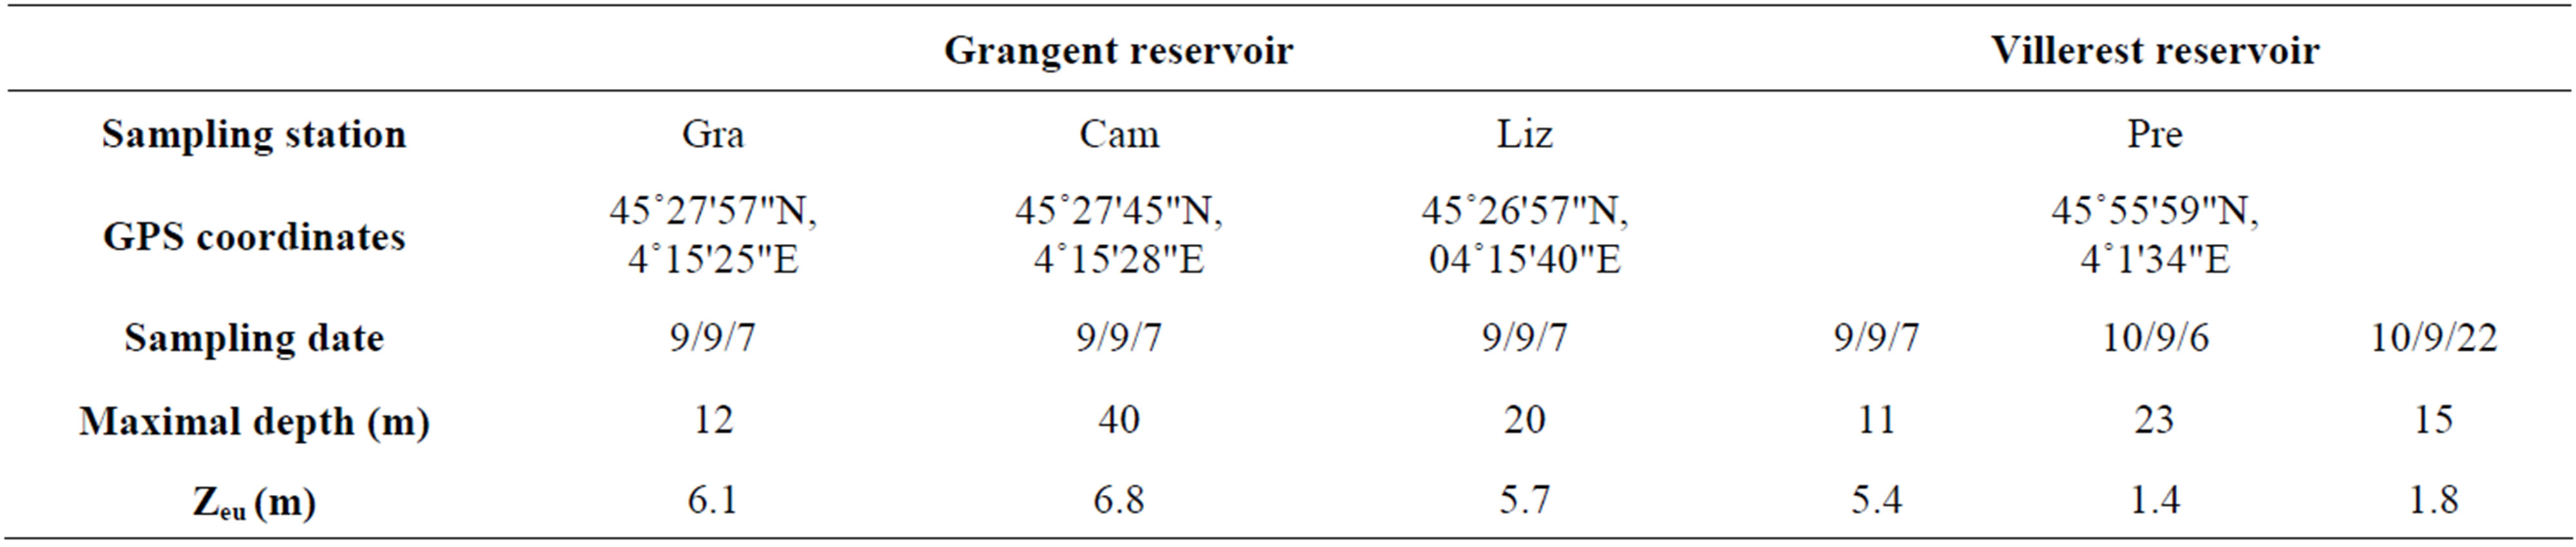
Table 1. Main characteristics of the study sites at each sampling date. Zeu: lower limit of the euphotic zone, calculated from Secchi disk measurements.
−10 m, and −12.5 or −15 m depending on the maximal depth at the sampling site.
According to the cyanobacterial biomass, between 2 and 150 L of water were sampled using either a Van Doorn bottle or a filtrating pump as described in [31], and then concentrated on a 25 µm mesh to a final volume of 1 L. Surface scum samples did not need to be concentrated on 25 µm because of their high cyanobacterial biomass.
In parallel, vertical profiles of temperature and oxygen concentration were performed with a multiparameter probe ProOdOTM (Ysi, Germany). Water transparency was measured with Secchi disk, and the depth of the euphotic zone (Zeu) estimated as described by [32]:
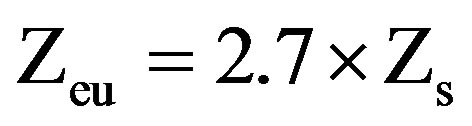
where Zs is the depth at which the Secchi disc disappears.
Back to the lab, each concentrated water sample was used as follows: 3 mL were stored at −20˚C in methanol (75% final concentration) prior to microcystin extraction, 960 µL were fixed with glutaraldehyde (1% final concentration) for future cell enumerations, and 50 to 150 mL were filtrated on 1.2 µm polycarbonate filters (Millipore, Billerica, MA, USA) prior to DNA extraction.
2.2. Cell Enumerations
Rapid disruption (<1 min) of the colonial structure was produced by low-power ultrasonic vibration (20 kHz) [33,34]. Isolated cells of M. aeruginosa were then counted under a microscope (Carl Zeiss, Oberkochen, Germany) at ×400 magnification with a Thoma counting chamber.
2.3. DNA Extraction and Molecular Analyses
DNA extraction was performed as previously described [35]. Briefly, cyanobacteria collected on filters were subjected to a chemical lysis by the use of lysosyme (2.5 mg) and SDS (1% final), prior to a phenol-chloroform purification and ethanol precipitation of DNA. The extracted DNA was stored in water at −20˚C until used.
The toxic potential of the studied blooms of M. aeruginosa was assessed at every sampled depth by quantitative PCR (qPCR) assays using the ΔCt method adapted for Microcystis [25], as described previously [15]. This method allowed us to estimate the proportion of potentially toxic cells of M. aeruginosa, i.e. cells carrying the mcyB gene, one of the 10 genes of the mcy cluster responsible for the synthesis of the microcystin. Such cells are further referred to as mcyB+ cells in the manuscript.
The genotypic structure within the M. aeruginosa’s populations studied was measured at every sampled depth by PCR and capillary electrophoresis single-strand conformation polymorphism (CE-SSCP). The 16S-23S ITS region was amplified by PCR as described previously [7,11]. The size of the PCR products (around 250 bp) was checked on 1% ethidium bromide stained agarose gel, with Hyperladder I. PCR products were then diluted between 20 and 100 fold, depending on the band intensity on the gel, and CE-SSCP was performed as described in [36]. DNA extracted from water sampled at −10 m at “Pre” station in 2009 could not be amplified through PCR and could not consequently be analyzed through CE-SSCP.
2.4. Data Analysis
Raw SSCP data were analyzed with the R package (version 2.10.1). Statfingerprints (version 2.0) was used to align CE-SSCP profiles with the internal standard (GeneScan ROX) and to normalize the entire area of CE-SSCP patterns prior to calculate Simpson’s diversity index (−log(D)) for each sample [37]. Normalized data were used to calculate Euclidian distances between the different samples using XLStat (version 2010.3.03, Addinsoft, Paris, France).
XLStat was also used for every other statistical analysis, with a level of significance set at 5%. Correlation between variables consisted of Spearman’s correlation test when n < 30 and Pearson’s correlation test when n > 30. The proportion of mcyB+ cells was compared between the different depths of each vertical profile through Kruskal-Wallis’ test or analysis of variance (ANOVA), depending on the result of previous homoscedasticity analyzes by Bartlett’s test.
3. Results
3.1. Physical Conditions within the Water Column
The water temperature on top of the water column was very similar at every sampling site and date, ranging between 21.0˚C and 23.3˚C. Among the different sampling sites we prospected, the “Cam” station of the Grangent reservoir was the only one where a thermal stratification of the water column could be observed, with a thermocline located between 23 and 26 m depth (Figure 2). In the epilimnion at this sampling site, and all along the water column of every other sampling site, the water
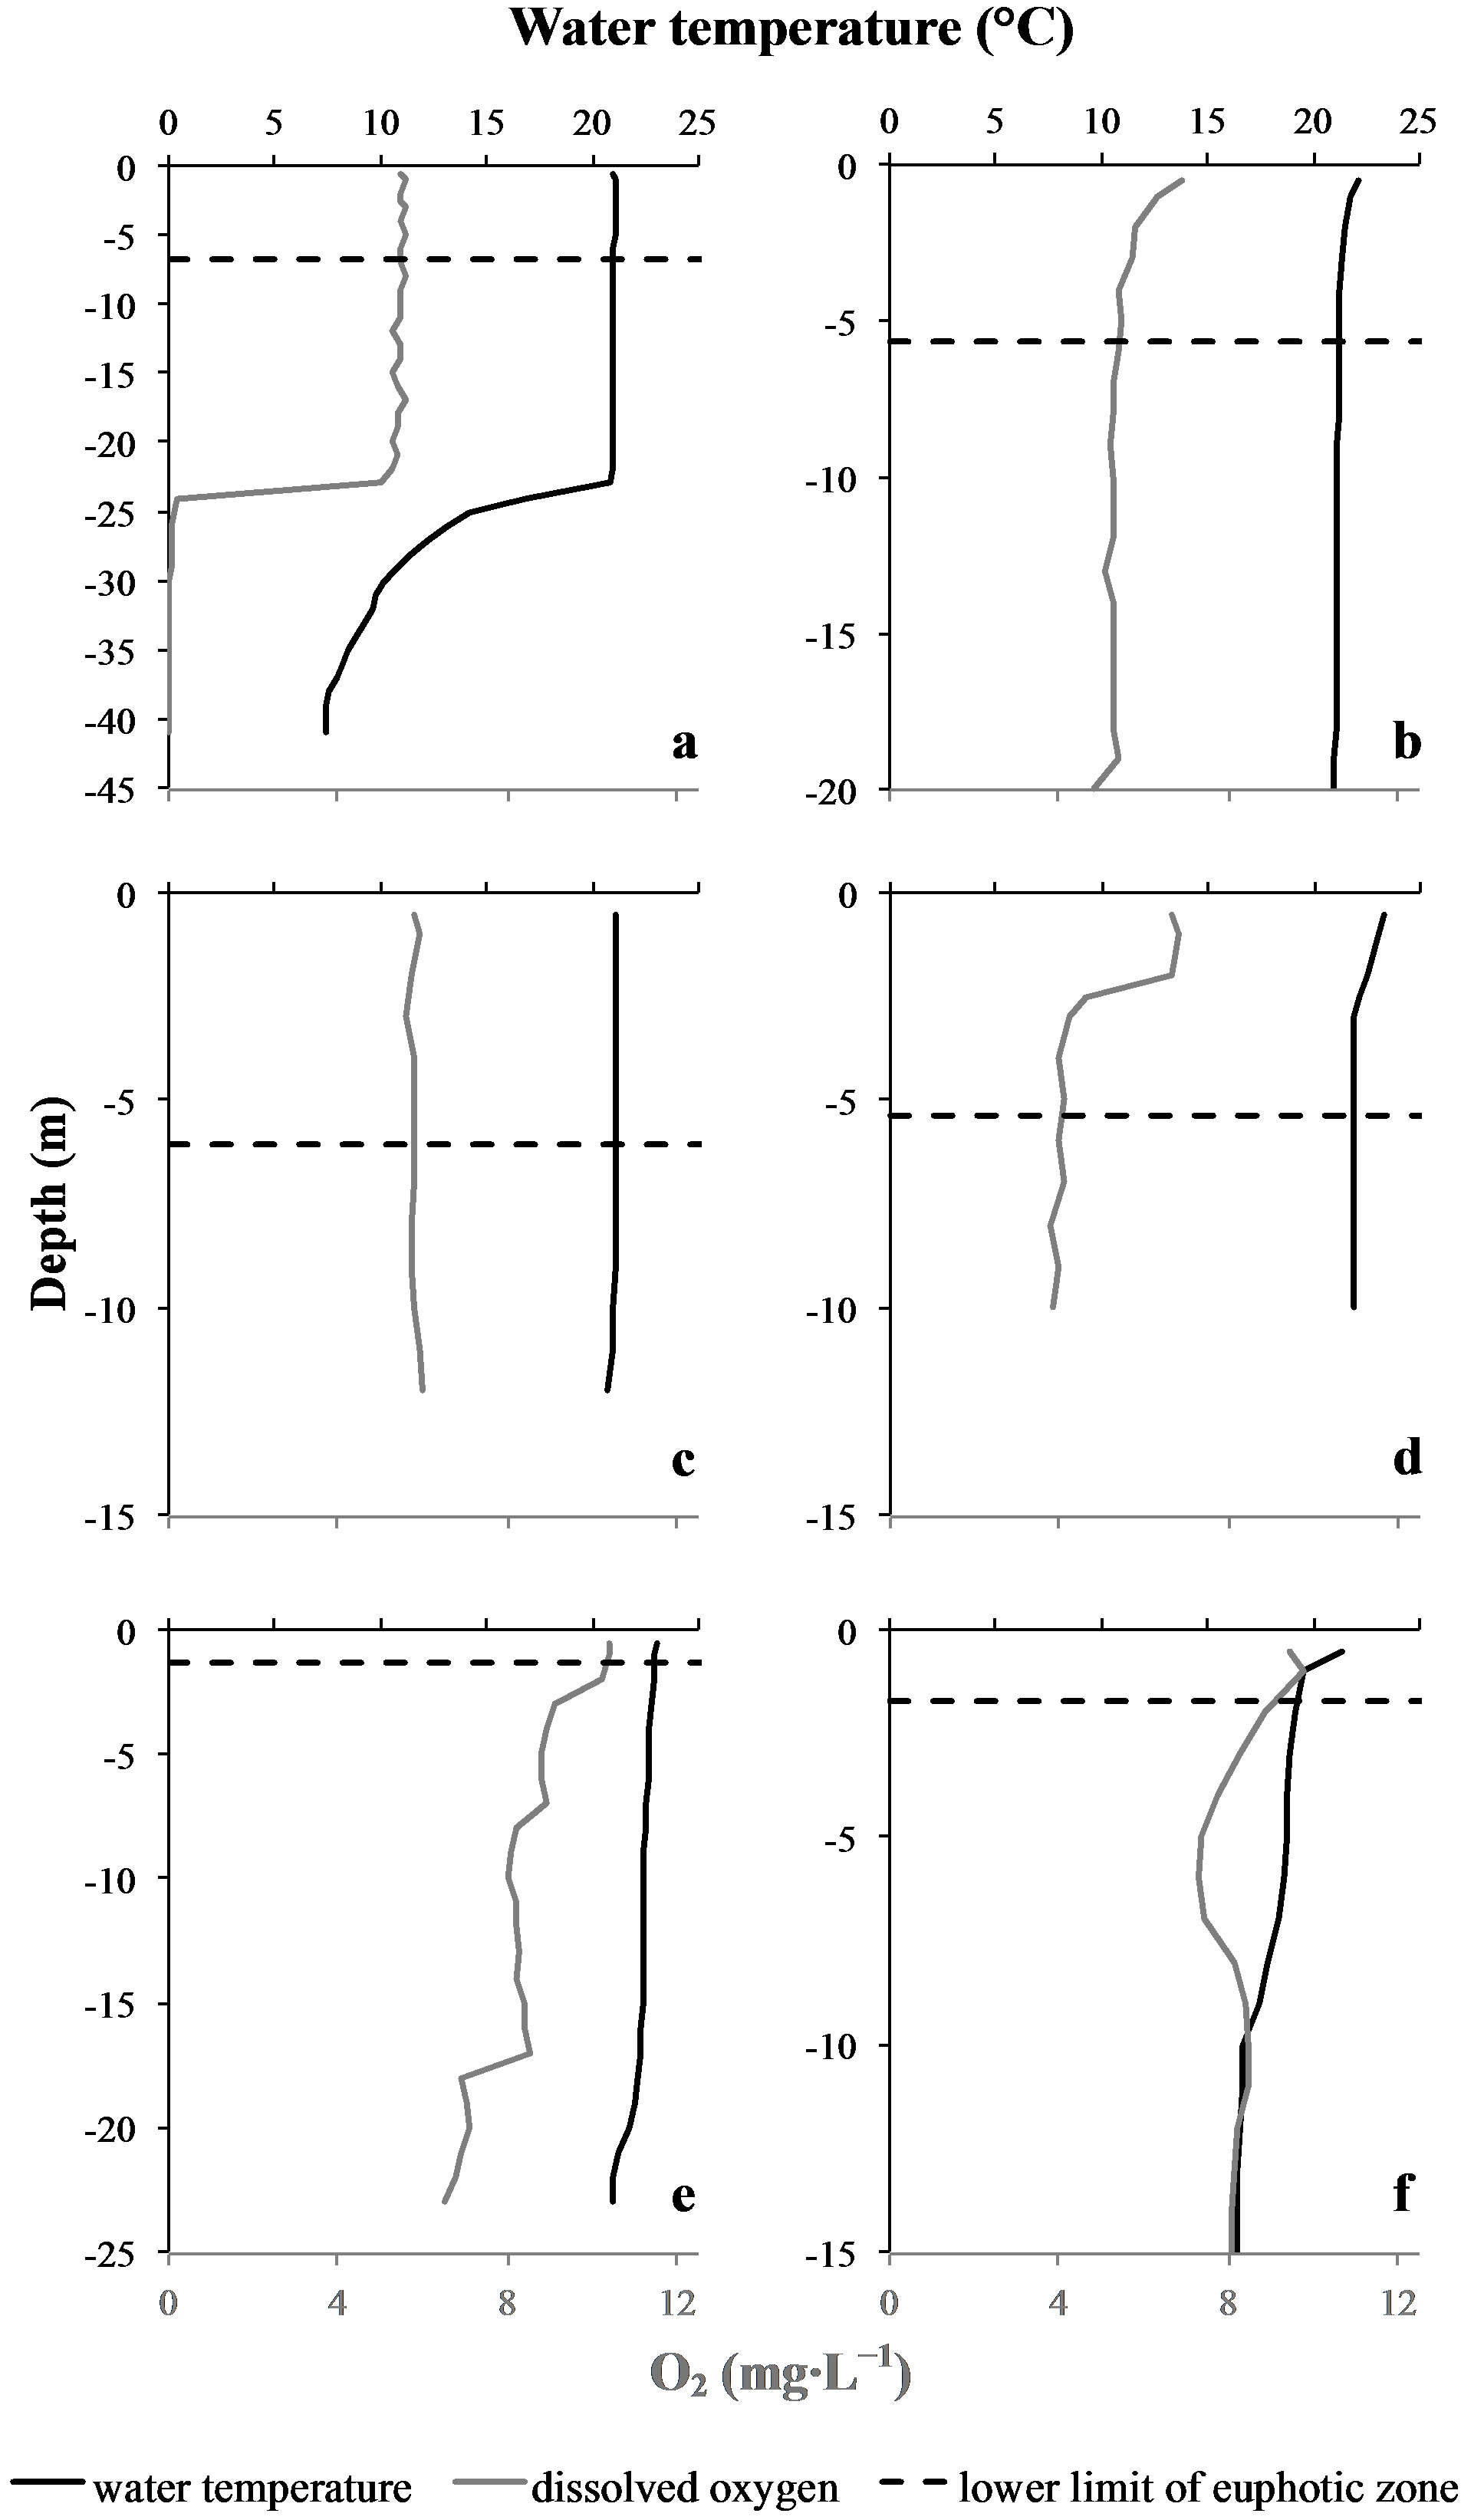
Figure 2. Lower limit of the euphotic zone (Zeu), temperature and oxygen vertical profiles at the different sampling sites and dates. Upper graphs correspond to Grangent reservoir, lower graphs correspond to Villerest reservoir. (a): “Cam” station. (b): “Liz” station. (c): “Gra” station. (d): “Pre” station on September 7th 2009. (e): “Pre” station on September 6th 2010. (f): “Pre” station on September 22nd 2010.
temperature appeared to be quite homogeneous. This homogeneity was confirmed by vertical profiles of dissolved oxygen concentrations (Figure 2).Concerning light penetration within the water column, the euphotic layer appeared to be quite thick at the sampling stations prospected in 2009 (Zeu ranging from 5.4 to 6.8 m depth), whereas it was more restricted in 2010 (Zeu < 1.8 m; Table 1).
3.2. Vertical Variations of M. aeruginosa’s Cells Concentration
Whatever the sampling site or date, the maximal cell concentration was always recorded on top of the water column (Figure 3). Then, the magnitudes of the different
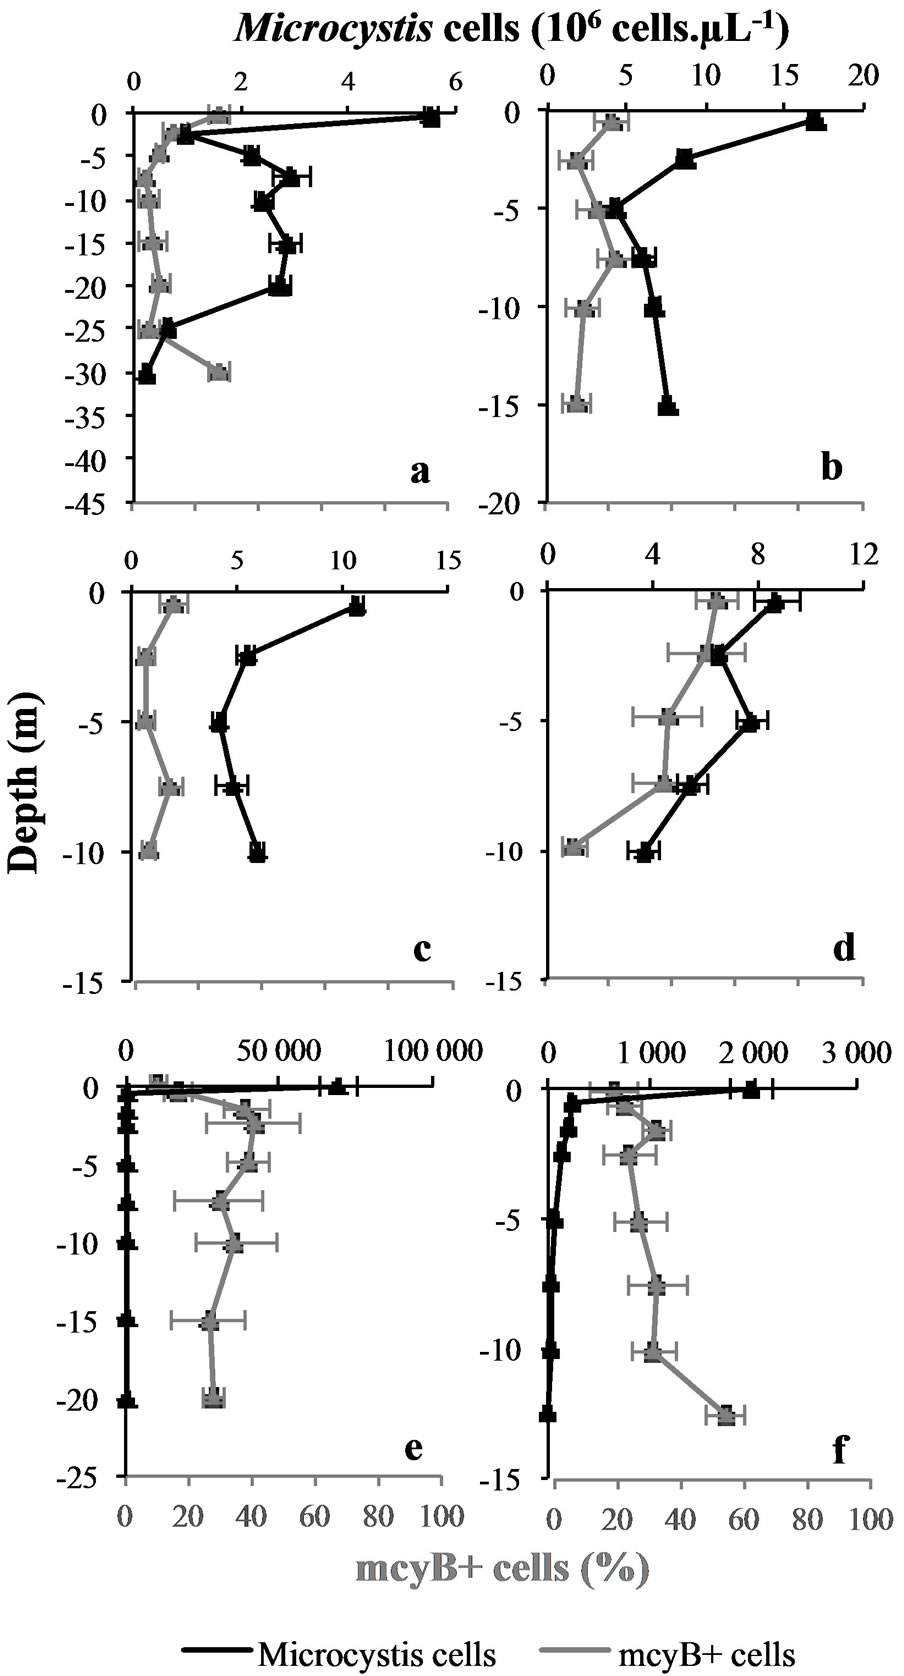
Figure 3. Vertical variations in Microcystis cells concentrations and proportions of potentially toxic cells (mcyB+ cells) at the different sampling sites and dates. Mean values (± SD) of measurement replicates. Upper graphs correspond to Grangent reservoir, lower graphs correspond to Villerest reservoir. (a): “Cam” station. (b): “Liz” station. (c): “Gra” station. (d): “Pre” station on September 7th 2009. (e): “Pre” station on September 6th 2010. (f): “Pre” station on September 22nd 2010.
blooms appeared to be very different: quite low cell concentrations were observed in both reservoirs in 2009 (from 5.6 to 16.9 × 10⁶ cells∙L−1 at 0.5 m depth), whereas the bloom of 2010 in Villerest reservoir produced a thick scum containing 69.4 × 10⁹ cells∙L−1 (Figure 3).
Along with the various magnitudes of the different blooms studied, the accumulation of M. aeruginosa’s cells on top of the water column varied between sampling sites and dates: there was 385 times more cells in the scum than at −1.5 m depth in September 6th 2010 in Villerest reservoir, whereas no scum was observed in 2009 in Grangent reservoir where there was only 1 to 6 times more cells at −0.5 m depth than at −2.5 m depth (Figure 3).
3.3. Vertical Heterogeneity of Genotypic Structure and Genetic Diversity within a Population of M. aeruginosa
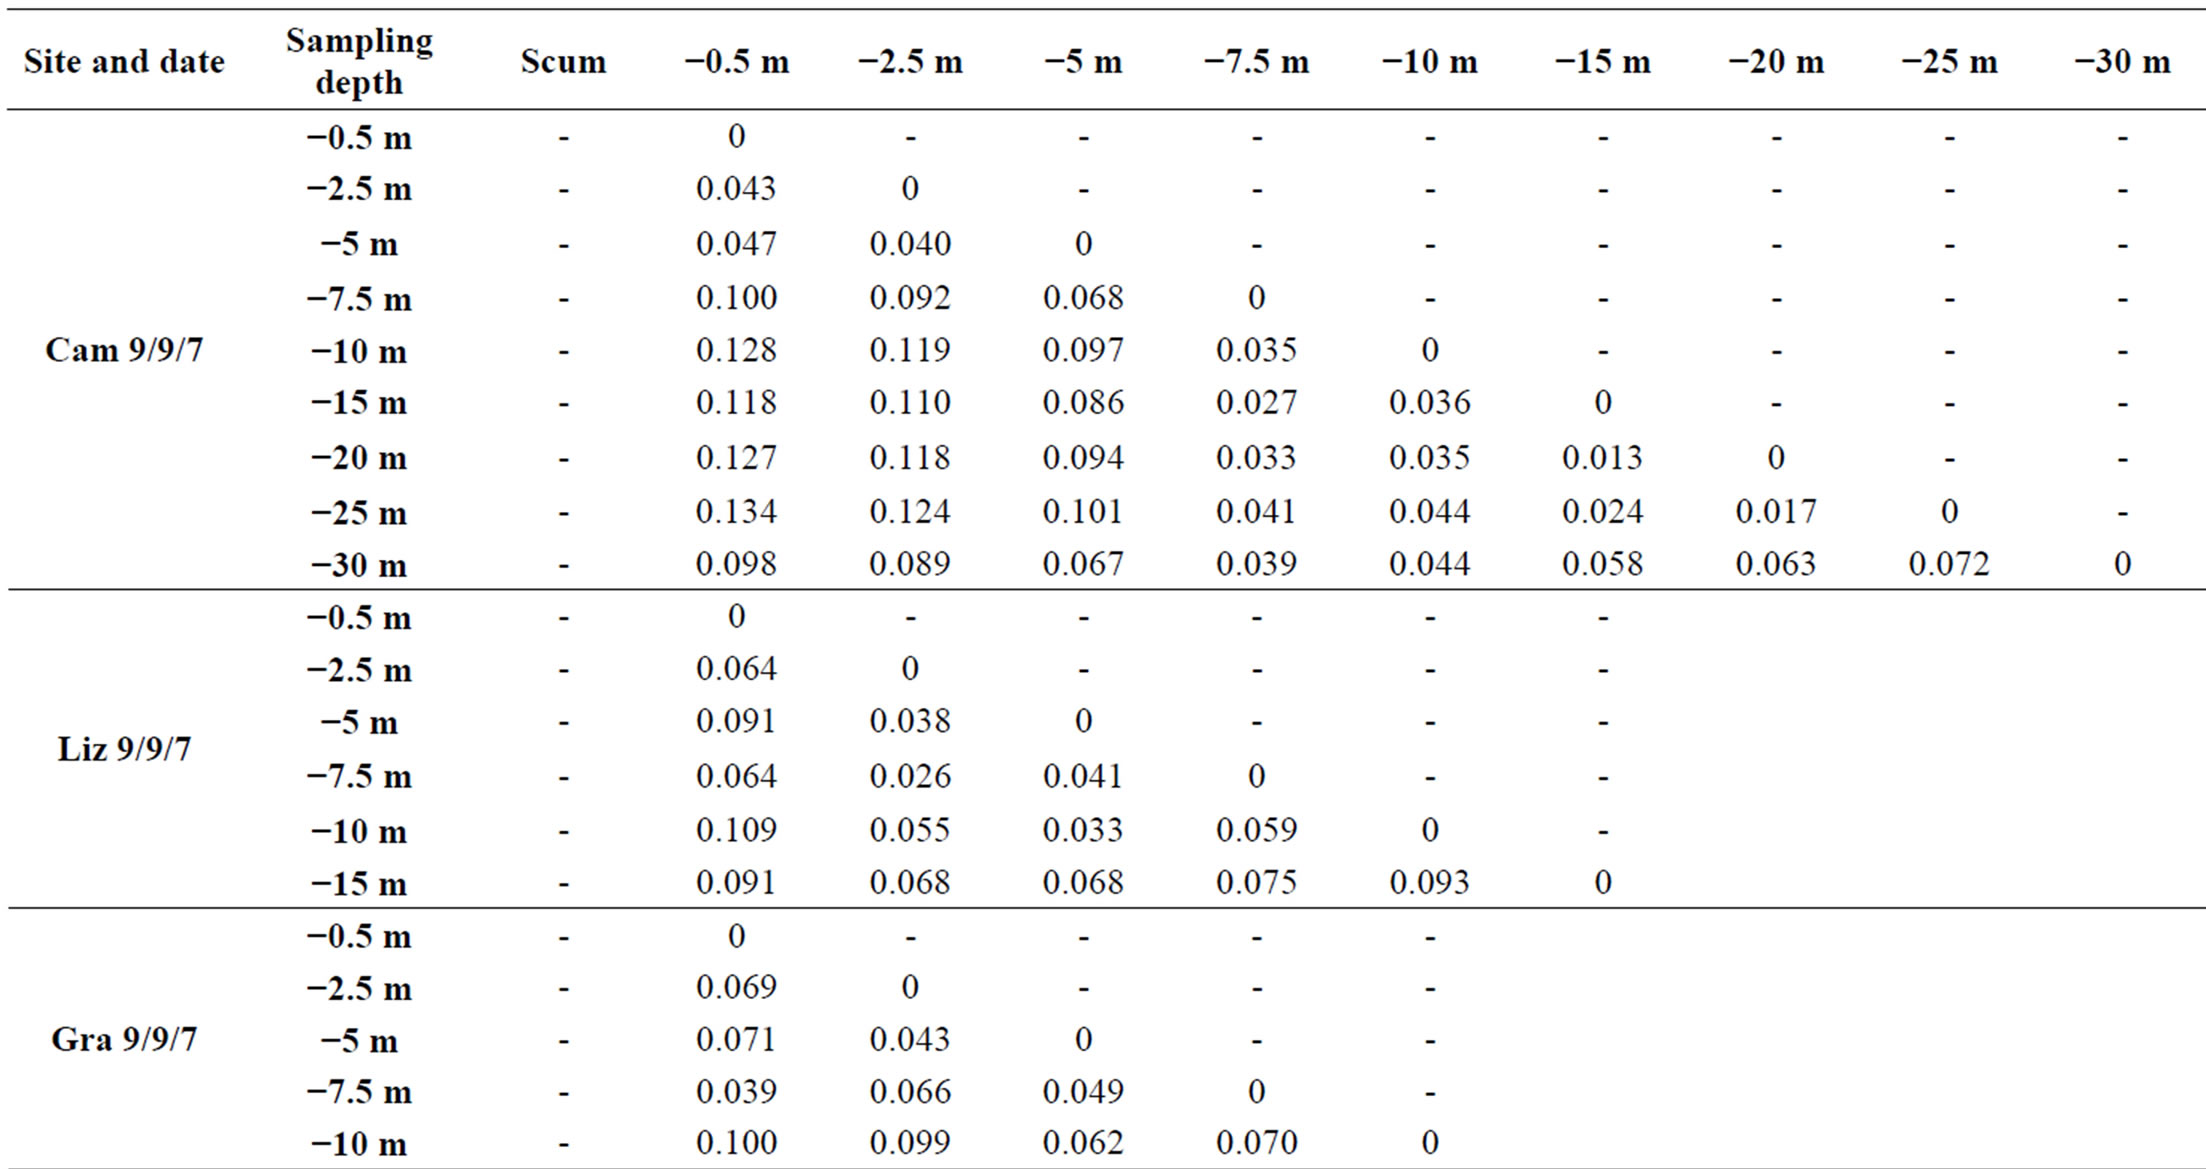
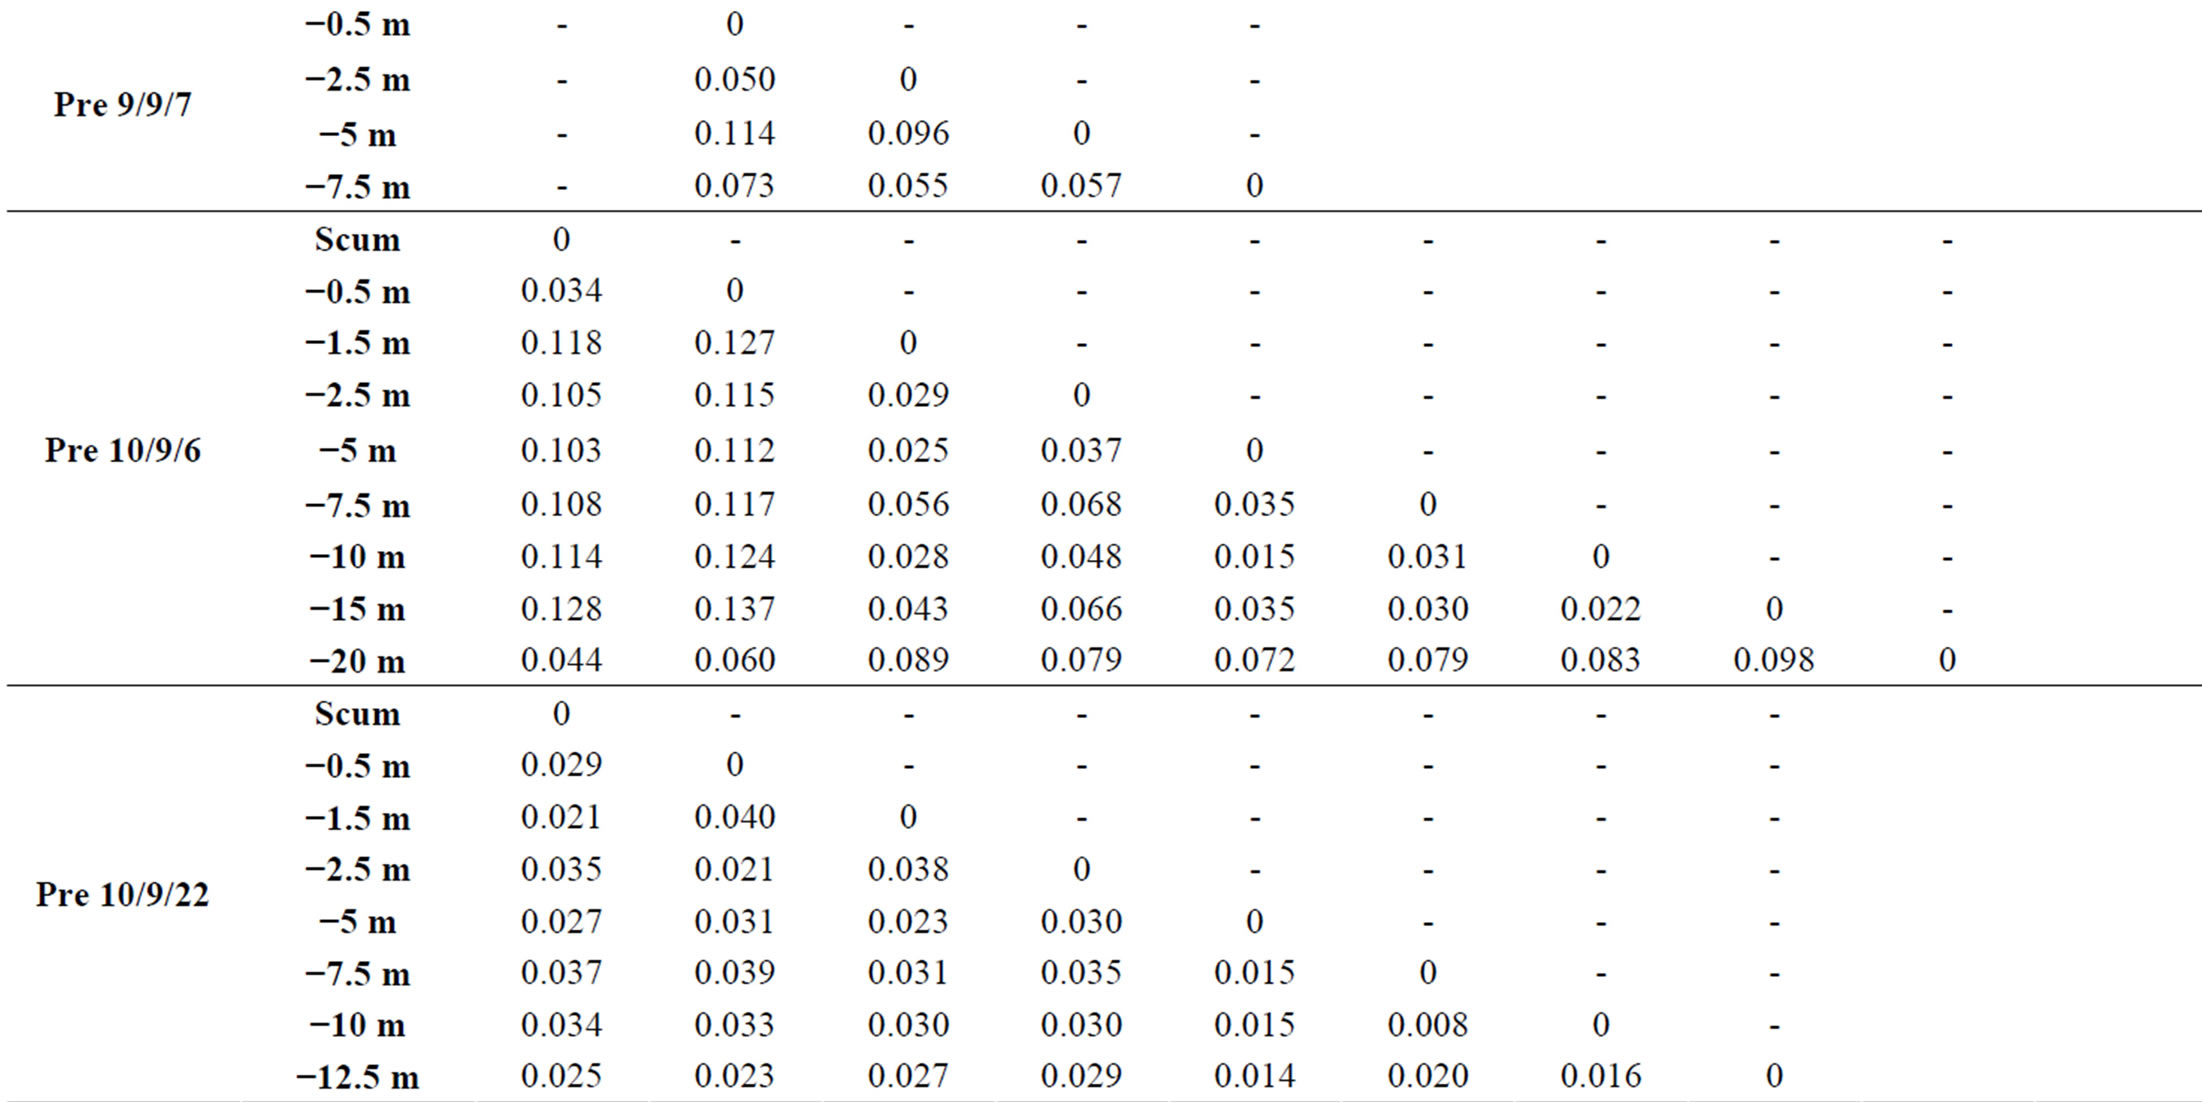
At each sampling site and each sampling date, we observed vertical variations within the genotypic structure of M. aeruginosa’s populations. Such vertical variations consisted in changes in the number or the identity of dominants peaks on CE-SSCP spectra (Figure 4), which can be interpreted as changes in the number or the identity of dominants genotypes. These changes generally led to increased Euclidian distances between different depths (Table 2) and/or were sometimes accompanied by im-portant variations of Simpson’s diversity index (Figure 5). For example, in Villerest reservoir on September 6th 2010, quite similar and rich CE-SSCP spectra were obtained from samples originating from scum and −0.5 m, with Simpson’s diversity indexes that reached 4.6 and 3.4, respectively. A small Euclidian distance of 3.4% was calculated between those two samples. On the other hand, the sample originating from −1.5 m presented a very different and simplified CE-SSCP spectrum when compared to scum and −0.5 m samples. As a consequence, Simpson’s diversity index dropped to 0.9, and the Euclidian distance between −1.5 and −0.5 m rose to 12.7%.
The sampling campaign of 2009 revealed that those vertical variations appeared to be mainly restricted to the surface layers of the water column, i.e. to the first five meters. This observation was confirmed in 2010, with major changes occurring between 0.5 and 1.5 m (Figure 4).
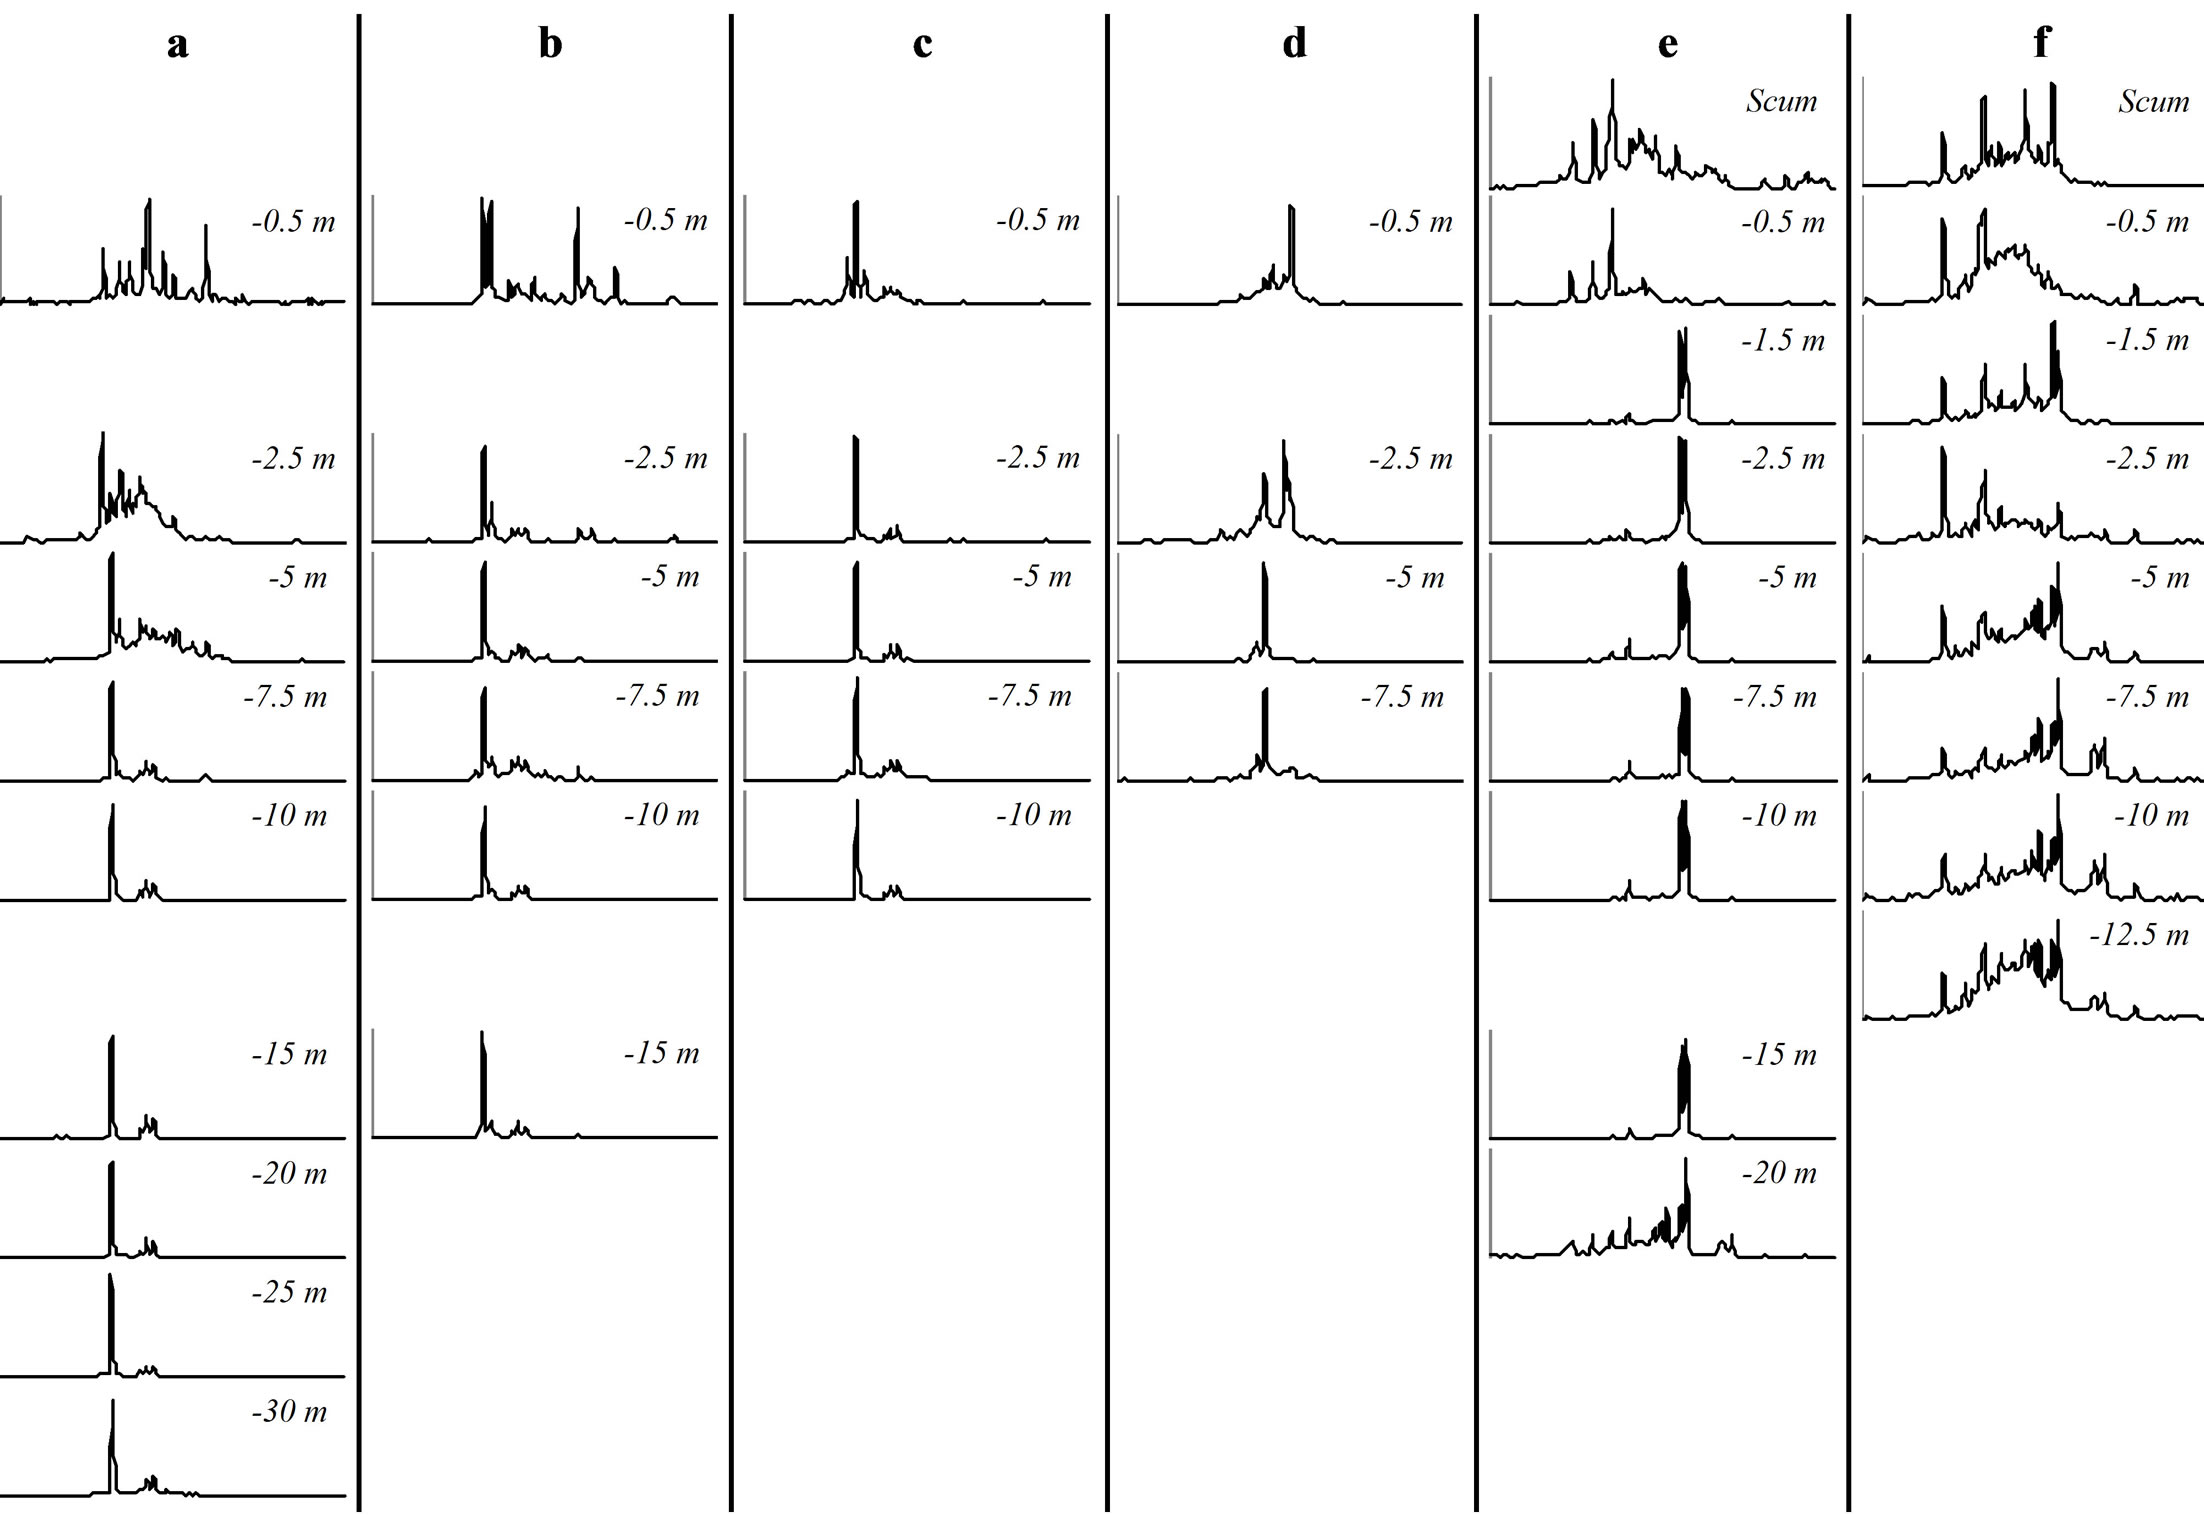
Figure 4. CE-SSCP profiles of Microcystis blooms sampled at different depths. All profiles were aligned using the same internal standards. (a): “Cam” station. (b): “Liz” station. (c): “Gra” station. (d): “Pre” station on September 7th 2009. (e): “Pre” station on September 6th 2010. (f): “Pre” station on September 22nd 2010.
 (a)
(a)  (b)
(b)
Table 2. Euclidian distances between the CE-SSCP spectra. (a): between different depths within each station. (b): between the three stations of Grangent reservoir at −0.5 m.
Hence, in both years, most part of the vertical variations occurred within or at the bottom of the euphotic zone.
On the other hand, a great homogeneity of genotypic structure was observed between deep samples of a same sampling station, with a only few number of genotypes that were highly dominant from 1.5 - 5 m depth to the
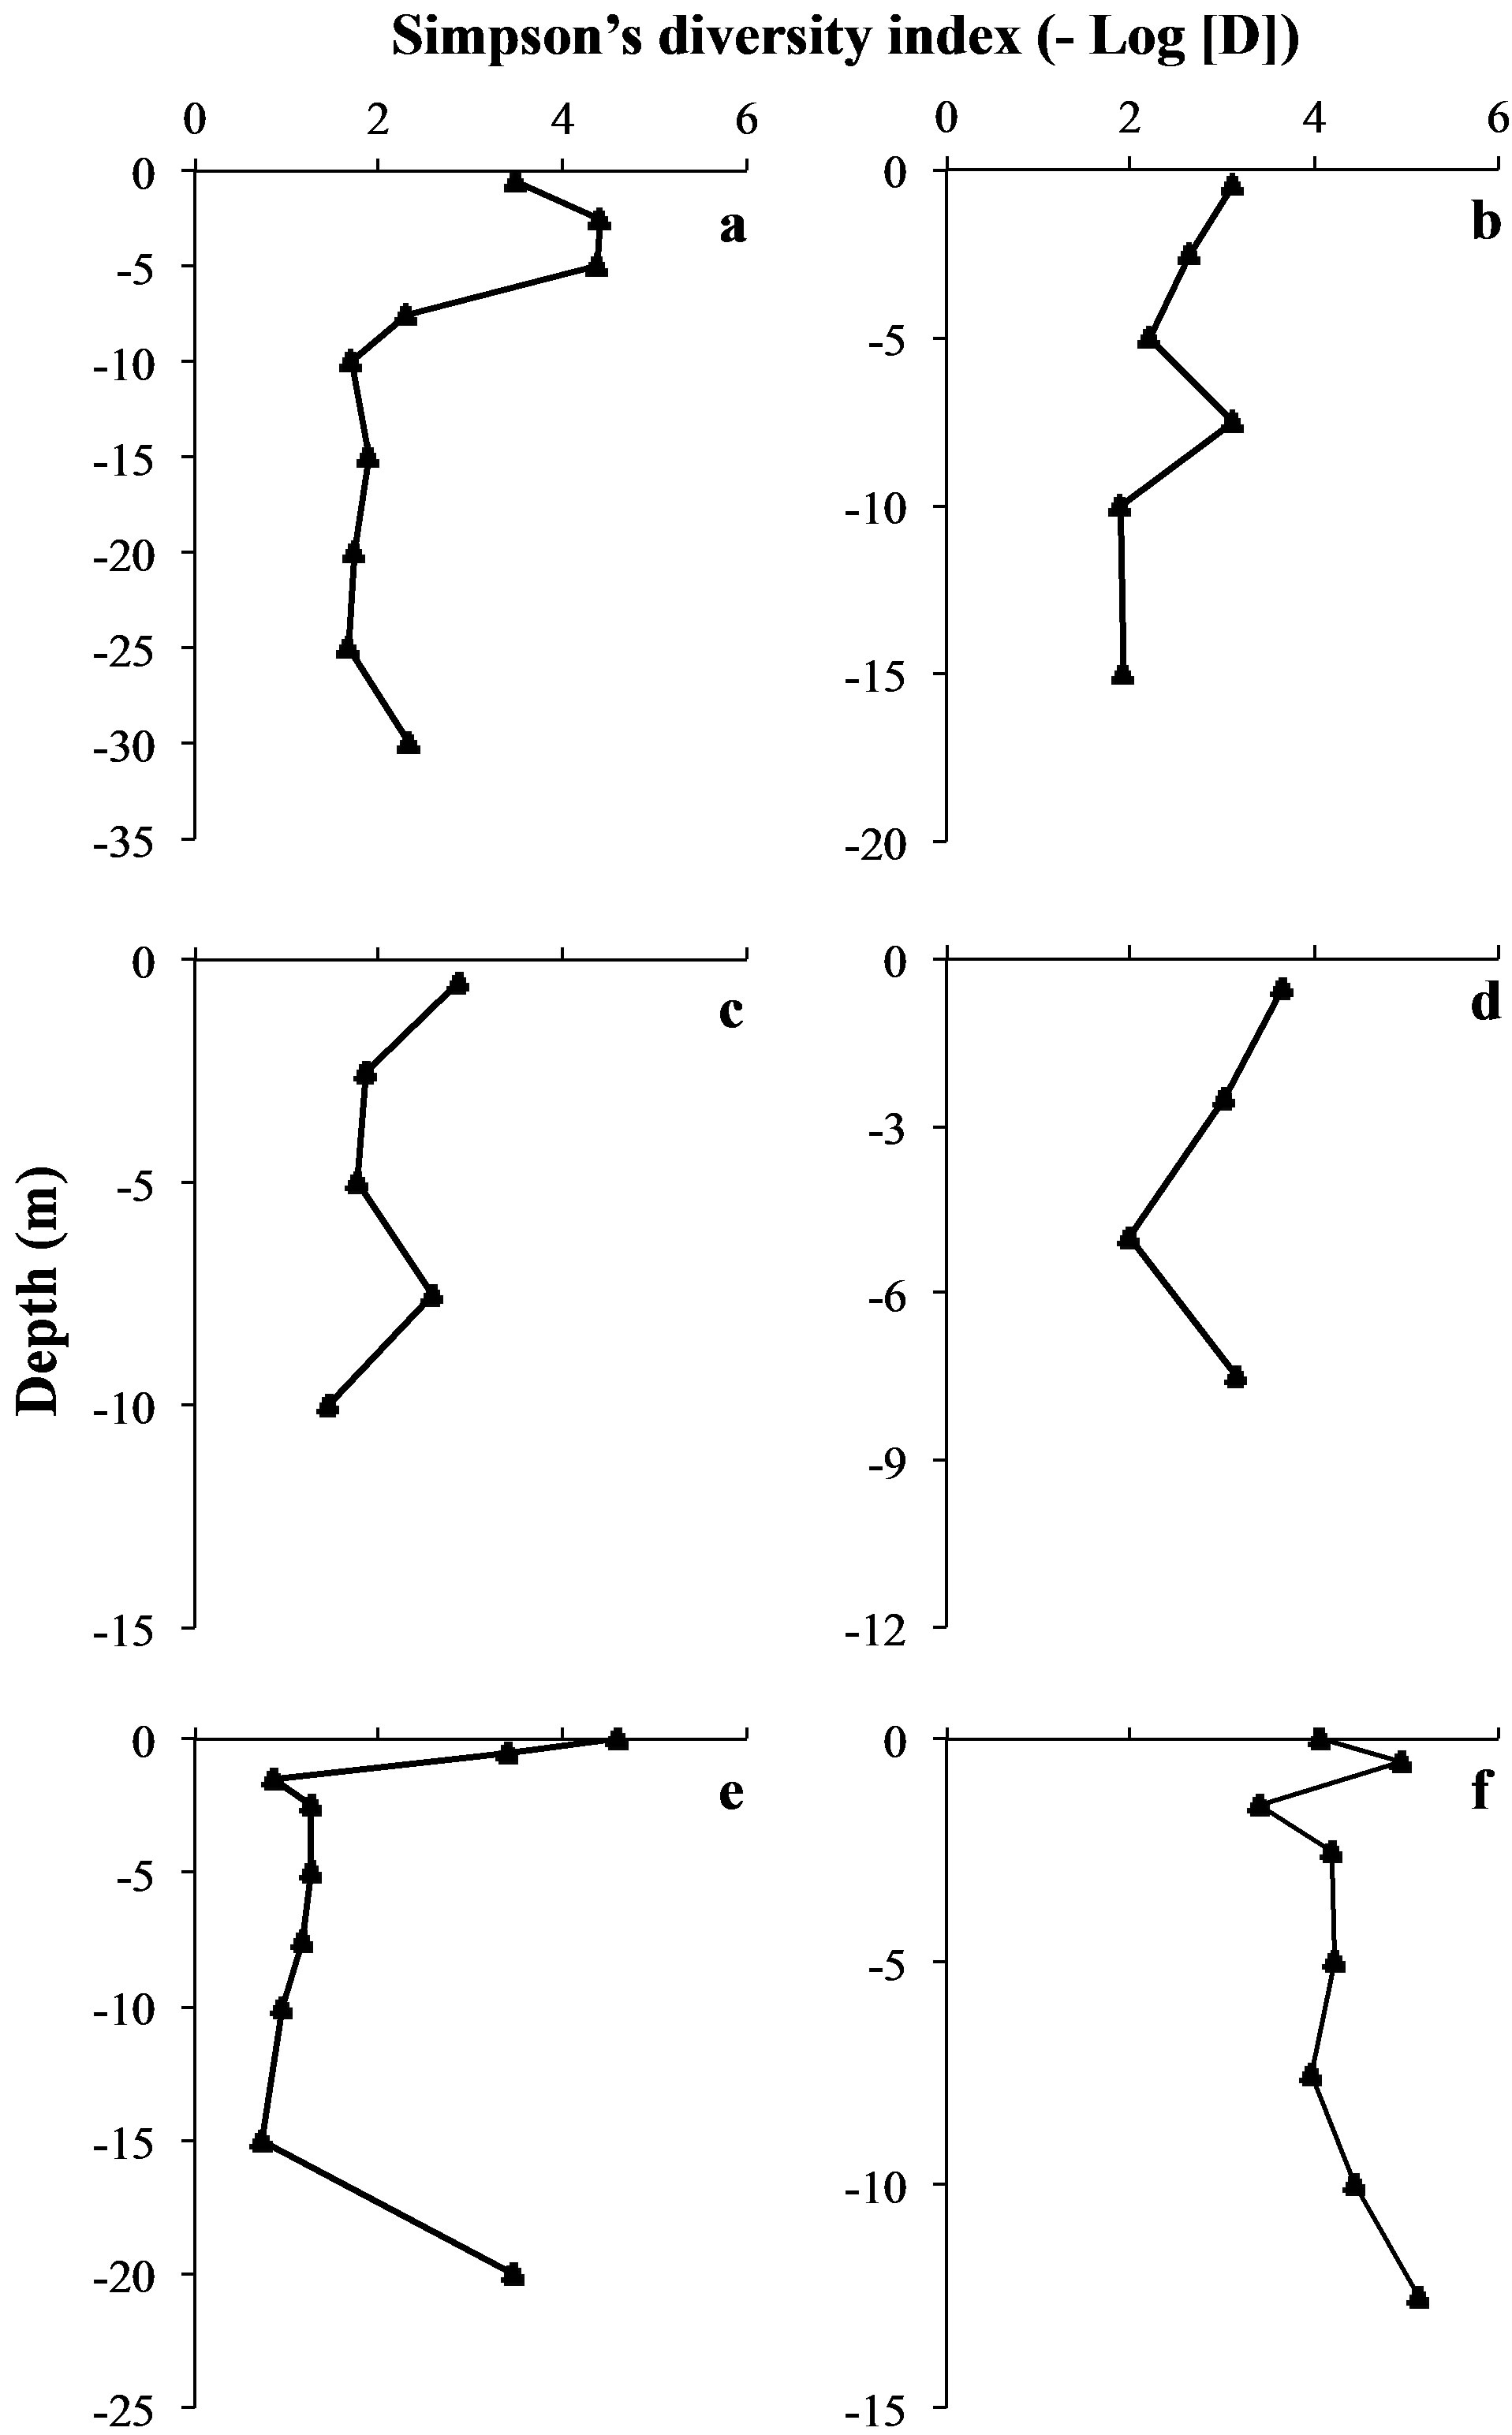
Figure 5. Vertical variations of Simpson’s diversity index. (a): “Cam” station. (b): “Liz” station. (c): “Gra” station. (d): “Pre” station on September 7th 2009. (e): “Pre” station on September 6th 2010. (f): “Pre” station on September 22nd 2010.
bottom of the water column (Figure 4). This homogeneity in deep water layers resulted in smaller values of Simpson’s diversity index and in little Euclidian distances between the deep samples (Table 2 and Figure 5).
One vertical profile, harvested from Villerest reservoir on September 22nd 2010, appeared to contradict this trend. Indeed, in this vertical profile, the most different CESSCP spectra differed only from 4%, and no major shift of diversity was observed.
Although major shifts of genotypic structure appeared to occur mainly in the euphotic zone, no obvious link between depth and the diversity (estimated by Simpson’s diversity index) could be observed, neither when considering all the vertical samples together (Pearson’s correlation test, n = 41, p > 0.05), nor when considering each vertical profile separately (Spearman’s correlation tests, n ≤ 9, p > 0.05).
3.4. Vertical Fluctuations of M. aeruginosa’s Toxic Potential
The proportions of mcyB+ cells in Grangent reservoir in 2009 were quite low, ranging from 4% to 28%. This range was higher in Villerest reservoir, with extreme values of about 10% and 55% for both 2009 and 2010 (Figure 3).
Whatever the sampling site or date, the degree of thermal homogeneity of the water column, or the abundance of M. aeruginosa, we observed significant changes of the proportions of mcyB+ cells along the water column in each vertical profile we established (Kruskal-Wallis’ tests with Dunn’s pairwise comparisons or ANOVA with Tukey’s pairwise comparisons, p < 0.05). Proportions of mcyB+ cells could either increase in deep water layers as in “Pre” station in 2010, or on the contrary decrease in deep water layers as in “Cam” and “Pre” stations in 2009, or even vary in a more chaotic way without any particular trend as in “Gra” and “Liz” stations in 2009 (Figure 3).
These results thereby confirmed the vertical heterogeneity of the studied blooms of M. aeruginosa, as demonstrated with genotypic structure analyses. Moreover, the main changes of toxic potential were observed at similar depths (in the euphotic zone) that the major shifts in genotypic structure. Some rare exceptions were observed in the deepest water layers where significant changes of toxic potential occurred independently from any major shift in genotypic structure (Figures 3 and 4).
3.5. Comparison of Vertical and Horizontal Heterogeneity
Sampling the same day at three stations of the Grangent reservoir in 2009 allowed us to compare horizontal heterogeneity on top of the water column to vertical heterogeneity. The genetic diversity appeared to vary in a higher range on the vertical dimension at each sampling station (maximal differences of Simpson’s diversity index ranging from 1.2 to 2.8) than between the three sites when compared at −0.5 m (maximal difference of 0.6, Figure 6(a)). In the same way, higher divergences of genotypic structure were observed vertically with maximal Euclidian distances exceeding 10%, whereas the maximal Euclidian distance between the three sites at −0.5 m was 7.5% (Figure 6(b)).
A similar pattern was observed for the toxic potential of this population of Grangent reservoir in 2009, although less obvious. Indeed, the range between the maximal and the minimal proportion of mcyB+ cells between different depths at the “Cam” station reached 23.7%, whereas it was not higher than 15.6% at −0.5 m between the three stations of the reservoir. However, the vertical range of proportions of mcyB+ cells at “Gra” and
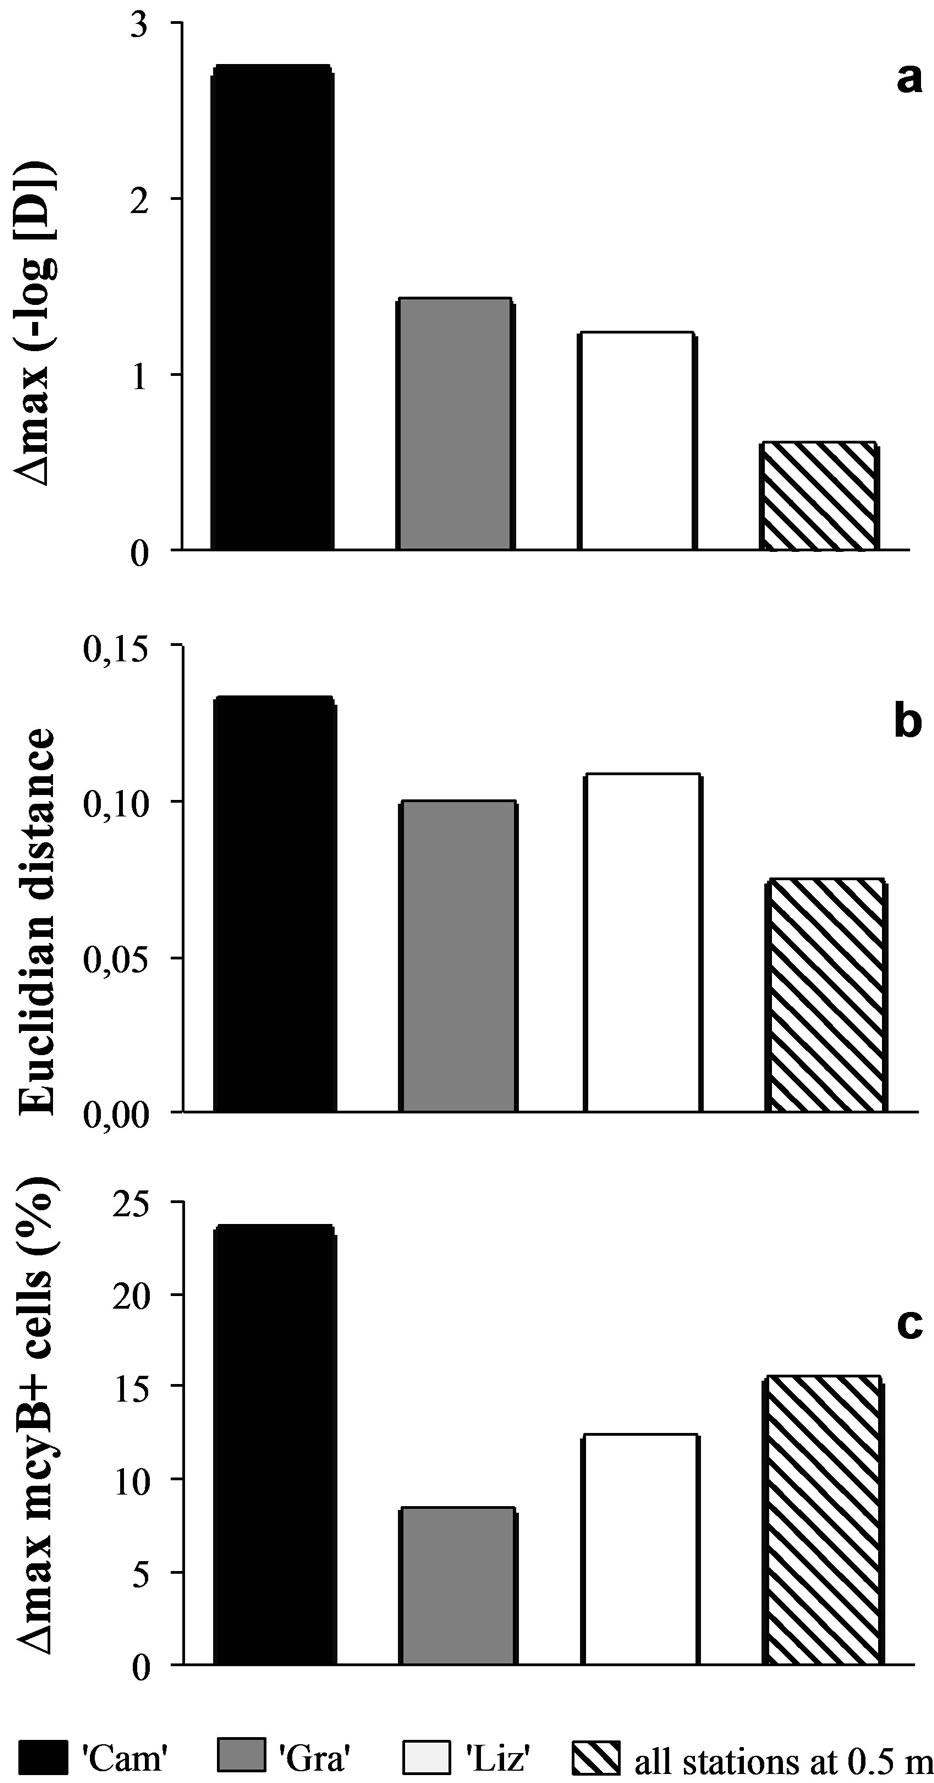
Figure 6. Comparison of vertical vs. horizontal heterogeneity in Grangent reservoir in 2009. Maximal differences (∆max) between the proportions of mcyB+ cells (a), maximal Euclidian distances between SSCP spectra (b), and maximal differences (∆max) between Simpson’s diversity indexes (c) were calculated from vertical profiles of “Cam” station (black bars), “Gra” station (grey bars), “Liz” station (white bars) and from measurements in samples originating from −0.5 m at the three stations (hatched bars).
“Liz” stations did not exceed 12.4% (Figure 6(c)).
4. Discussion
By studying the genotypic structure and the toxic potential of natural populations of M. aeruginosa at different depths, we demonstrated that a great qualitative vertical heterogeneity could exist within a single bloom of this cyanobacterium in deep lakes. To the best of our knowledge, this is the first time that such a vertical characterization is performed within natural blooms of M. aeruginosa. However, since a vertical heterogeneity was observed in three different blooms, this could be a frequent pattern within populations of this cyanobacterium. Moreover, both small and dense blooms presented heterogeneous genotypic structures and heterogeneous distributions of potentially toxic cells on the vertical dimension, in spite of unstratified water columns. Vertical qualitative shifts were recorded whereas no or little abundance variations could be observed. On the other hand, the most important vertical abundance shifts did not result in any significant variation of toxic potential or of genotypic structure. So, both the toxic potential and the genotypic structure of M. aeruginosa’s bloom can vary on the vertical dimension independently from abundance variations.
Until now, the heterogeneity in M. aeruginosa’s blooms had been demonstrated on a horizontal dimension on top of the water column. Indeed, at the same time, important differences of biomass can be observed at different sites of a same lake as the result of either different growth rates (because of local variations of resources availability), or current-induced local accumulations [7, 25,28]. Such horizontal heterogeneity had already been proven to sometimes result in spatial variations of genotypic structure and toxic potential [25,28]. Our study corroborates this result since both these parameters differed between the different sampling sites we prospected in Grangent reservoir in 2009. Associated to the dynamics resulting from growth and decay, horizontal heterogeneity was hence supposed to be one of the main drivers of the high temporal variability of toxic potential and genotypic structure that were frequently reported in blooms of M. aeruginosa [4,8,22,23,25,26,38,39]. Now, the vertical heterogeneity we observed through this study represents a third part to consider in order to fully understanding the temporal dynamics of genetic diversity and toxin production in M. aeruginosa’s blooms. Indeed, one of the most striking results of this study is that both the genotypic structure and the toxic potential of a population of M. aeruginosa could be more variable between different depths sampled at a single site than between different sites of the same reservoir sampled at the same depth, on top of the water column. Thereafter, this surprising observation sheds the light on the potential influence of this vertical heterogeneity on the temporal dynamics observed on top of the water column. Hence, through water column mixing, deep genotypes could replace surface dominant genotypes, thereafter inducing a potential shift in the toxic potential observed at the water surface. Therefore, future investigations are now needed to decipher the relative influences of horizontal and vertical heterogeneities onto the temporal qualitative and quantitative dynamics of M. aeruginosa’s blooms that can be observed on top of the water column.
According to the literature, several factors could potentially drive such a vertical heterogeneity by influencing the distribution of the colonies of M. aeruginosa into the water column: 1) interactions with the benthic compartment, by recruiting benthic colonies or by the continuous sedimentation of planktonic ones [29,40]; 2) vertical migration of the colonies, which can regulate their position in the water column by balancing their internal stock of gas vacuoles and carbon reserves [13,30,41,42]; and 3) fitness-related natural selection, which could allow some particular genotypes or phenotypes to better survive or develop at a specific depth because of particular conditions such as light intensity, nutrients availability or benefits of microcystin production [10,23,43-45]. Since the qualitative shifts we observed were mainly restricted to the surface water layers of the deep reservoirs we studied, the influence of the interactions with the benthic compartment through recruitment or sedimentation can be minimized. Moreover, more work is needed to determine to what extent recruitment and sedimentation processes could lead to qualitative shifts in the planktonic compartment. Then, both vertical migration and fitness-related vertical differentiation could be two major causes of vertical heterogeneity in response to vertical stratification of physico-chemical parameters, classically occurring during summer in deep lakes. Since in our case study, no thermal stratification was observed, a physical stratification of the water column cannot explain the vertical heterogeneity that we observed in M. aeruginosa’s populations. Moreover, nitrogen and phosphorus are not limiting resources in surface water layers of Grangent and Villerest reservoir (D. Latour, personal communication). Thereafter, we suppose that light attenuation in the water column may be the main driving factor. Indeed, light is a key control factor of the buoyancy of M. aeruginosa [41], thus regulating the vertical migration of the colonies in natural ecosystems [46]. Moreover, different strains of M. aeruginosa can present different critical light intensities [47], and recent findings demonstrated the link between light intensity and microcystin production by toxic strains [10,45]. Finally, the major part of the qualitative vertical variations we observed through this study was localized into the surface water layers, within or at the lower limit of the euphotic zone. Therefore, we hypothesize that light penetration could be a critical factor determining the vertical heterogeneity within blooms of M. aeruginosa.
5. Conclusion
Through this study, we demonstrated that blooms of M. aeruginosa could be heterogeneous in the vertical dimension: both the toxic potential and the genotypic structure of the three blooms we investigated were concerned. From an ecological point of view, the vertical heterogeneity in these cyanobacterial populations may be involved in bloom development and sustainability, as well as in genetic diversity and toxic potential modulation. Deciphering the precise causes and consequences of such vertical heterogeneity will provide interesting features of the ecology of this harmful cyanobacterium with regard to its increasing capacity to form dense and toxic blooms worldwide. This vertical heterogeneity is also of prime importance for the sanitary monitoring of water pieces with drinking and/or recreational uses. Indeed, in order to deliver the most adapted recommendations for users, such vertical heterogeneity should be taken into considerations as often as possible by sampling the entire water layer into which the cyanobacteria are distributed or, at least, the entire euphotic zone, where most of the heterogeneity seems to be located.
6. Acknowledgements
B.M. was supported by a Ph.D. fellowship from the French Ministère de l’Enseignement Supérieur et de la Recherche. This work was also partly funded by Electricité de France Research and Development (EDF R&D).
We thank Pierre Souvignet and Antoine Thouvenot for their support during the field sampling. We are also grateful to Jean-Jacques Godon, Valerie Bru-Adan and Jérôme Hamelin for their help in CE-SSCP analysis.
REFERENCES
- S. M. Azevedo, W. W. Carmichael, E. M. Jochimsen, K. L. Rinehart, S. Lau, G. R. Shaw and G. K. Eaglesham, “Human Intoxication by Microcystins during Renal Dialysis Treatment in Caruaru-Brazil,” Toxicology, Vol. 181-182, 2002, pp. 441-446. http://dx.doi.org/10.1016/S0300-483X(02)00491-2
- P. J. Oberholster, J. G. Myburgh, D. Govender, R. Bengis and A. M. Botha, “Identification of Toxigenic Microcystis Strains after Incidents of Wild Animal Mortalities in the Kruger National Park, South Africa,” Ecotoxicology and Environmental Safety, Vol. 72, No. 4, 2009, pp. 1177- 1182. http://dx.doi.org/10.1016/j.ecoenv.2008.12.014
- L. Giannuzzi, D. Sedan, R. Echenique and D. Andrinolo, “An Acute Case of Intoxication with Cyanobacteria and Cyanotoxins in Recreational Water in Salto Grande Dam, Argentina,” Marine Drugs, Vol. 9, No. 11, 2011, pp. 2164-2175. http://dx.doi.org/10.3390/md9112164
- M. Sabart, D. Pobel, D. Latour, J. Robin, M.-J. Salençon and J.-F. Humbert, “Spatiotemporal Changes in the Genetic Diversity in French Bloom-Forming Populations of the Toxic Cyanobacterium Microcystis aeruginosa,” Environmental Microbiology Reports, Vol. 1, No. 4, 2009, pp. 263-272. http://dx.doi.org/10.1111/j.1758-2229.2009.00042.x
- Y. Tanabe and M. M. Watanabe, “Local EXPANSION of a Panmictic Lineage of Water Bloom-Forming Cyanobacterium Microcystis aeruginosa,” PloS one, Vol. 6, No. 2, 2011, Article ID: e17085. http://dx.doi.org/10.1371/journal.pone.0017085
- I. van Gremberghe, F. Leliaert, J. Mergeay, P. Vanormelingen, K. Van der Gucht, A. E. Debeer, G. Lacerot, L. De Meester and W. Vyverman, “Lack of Phylogeographic Structure in the Freshwater Cyanobacterium Microcystis aeruginosa Suggests Global Dispersal,” PloS one, Vol. 6, No. 5, 2011, Article ID: e19561. http://dx.doi.org/10.1371/journal.pone.0019561
- D. Pobel, J. J. Godon, J.-F. Humbert and J. Robin, “HighFrequency Monitoring of the Genetic Diversity and the Potential Toxicity of a Microcystis aeruginosa Bloom in a French Shallow Lake,” FEMS Microbiology Ecology, Vol. 79, No. 1, 2012, pp. 132-141. http://dx.doi.org/10.1111/j.1574-6941.2011.01203.x
- M. Sabart, D. Pobel, E. Briand, B. Combourieu, M.-J. Salençon, J.-F. Humbert and D. Latour, “Spatiotemporal Variations in Microcystin Concentrations and in the Proportions of Microcystin-Producing Cells in Several Microcystis aeruginosa Populations,” Applied and Environmental Microbiology, Vol. 76, No. 14, 2010, pp. 4750-4759. http://dx.doi.org/10.1128/AEM.02531-09
- V. Vasconcelos, J. Morais and M. Vale, “Microcystins and Cyanobacteria Trends in a 14 Years Monitoring of a Temperate Eutrophic Reservoir (Aguieira, Portugal),” Journal of Environmental Monitoring, Vol. 13, No. 3, 2011, pp. 668-672. http://dx.doi.org/10.1039/c0em00671h
- Y. Zilliges, J. C. Kehr, S. Meissner, K. Ishida, S. Mikkat, M. Hagemann, A. Kaplan, T. Börner and E. Dittmann, “The Cyanobacterial Hepatotoxin Microcystin Binds to Proteins and Increases the Fitness of Microcystis under Oxidative Stress Conditions,” PloS one, Vol. 6, No. 3, 2011, Article ID: e17615. http://dx.doi.org/10.1371/journal.pone.0017615
- B. Misson, F. Donnadieu-Bernard, J. J. Godon, C. Amblard and D. Latour, “Shortand Long-Term Dynamics of the Toxic Potential and Genotypic Structure in Benthic Populations of Microcystis,” Water Research, Vol. 46, No. 5, 2012, pp. 1438-1446. http://dx.doi.org/10.1016/j.watres.2011.11.011
- B. Misson, M. Sabart, C. Amblard and D. Latour, “Benthic Survival of Microcystis: Long-Term Viability and Ability to Transcribe Microcystin Genes,” Harmful Algae, Vol. 13, 2012, pp. 20-25. http://dx.doi.org/10.1016/j.hal.2011.09.010
- J. M. H. Verspagen, E. Snelder, P. M. Visser, J. Huisman, L. R. Mur and B. W. Ibelings, “Recruitment of Benthic Microcystis (Cyanophyceae) to the Water Column: Internal Buoyancy Changes or Resuspension?” Journal of Phycology, Vol. 40, No. 2, 2004, pp. 260-270. http://dx.doi.org/10.1111/j.1529-8817.2004.03174.x
- K. Schöne, S. Jaenichen, T. Ihle, F. Ludwig and J. Benndorf, “Arriving in Better Shape: Benthic Microcystis as Inoculum for Pelagic Growth,” Harmful Algae, Vol. 9, No. 5, 2010, pp. 494-503. http://dx.doi.org/10.1016/j.hal.2010.03.005
- B. Misson, M. Sabart, C. Amblard and D. Latour, “Involvement of Microcystins and Colony Size in the Benthic Recruitment of the Cyanobacterium Microcystis (Cyanophyceae),” Journal of Phycology, Vol. 47, No. 1, 2011, pp. 42-51. http://dx.doi.org/10.1111/j.1529-8817.2010.00943.x
- B. Misson and D. Latour, “Influence of Light, Sediment Mixing, Temperature and Duration of the Benthic Life Phase on the Benthic Recruitment of Microcystis,” Journal of Plankton Research, Vol. 34, No. 2, 2012, pp. 113- 119. http://dx.doi.org/10.1093/plankt/fbr093
- M. Watanabe, K. Kaya and N. Takamura, “Fate of the Toxic Cyclic Heptapeptides, the Microcystins, from Blooms of Microcystis (Cyanobacteria) in a Hypertrophic Lake,” Journal of Phycology, Vol. 28, No. 6, 1992, pp. 761-767. http://dx.doi.org/10.1111/j.0022-3646.1992.00761.x
- K. Sivonen and G. Jones, “Cyanobacterial Toxins,” In: I. Chorus and J. Bartram, Eds., Toxic Cyanobacteria in Water: A Guide to Their Public Health Consequences, Monitoring and Management, E&FN Spon, London, 1999, pp. 44-111.
- M. Kaebernick, B. A. Neilan, T. Börner and E. Dittmann, “Light and the Transcriptional Response of the Microcystin Biosynthesis Gene Cluster,” Applied and Environmental Microbiology, Vol. 66, No. 8, 2011, pp. 3387- 3392. http://dx.doi.org/10.1128/AEM.66.8.3387-3392.2000
- M. Kaebernick and B. A. Neilan, “Ecological and Molecular Investigations of Cyanotoxin Production,” FEMS Microbiology Ecology, Vol. 35, No. 1, 2001, pp. 1-9. http://dx.doi.org/10.1111/j.1574-6941.2001.tb00782.x
- E. Carrillo, L. M. Ferrero, C. Alonso-Andicoberry, A. Basanta, A. Martin, V. Lopez-Rodas and E. Costas, “Interstrain Variability in Toxin Production in Populations of the Cyanobacterium Microcystis aeruginosa from Water-Supply Reservoirs of Andalusia and Lagoons of Donana National Park (Southern Spain),” Phycologia, Vol. 42, No. 3, 2003, pp. 269-274. http://dx.doi.org/10.2216/i0031-8884-42-3-269.1
- R. Kurmayer, G. Christiansen and I. Chorus, “The Abundance of Microcystin-Producing Genotypes Correlates Positively with Colony Size in Microcystis sp. and Determines Its Microcystin Net Production in Lake Wannsee,” Applied and Environmental Microbiology, Vol. 69, No. 2, 2003, pp. 787-795. http://dx.doi.org/10.1128/AEM.69.2.787-795.2003
- W. E. A Kardinaal, I. Janse, M. Kamst-van Agterveld, M. Meima, J. Snoek, L. R. Mur, J. Huisman, G. Zwart and P. M. Visser, “Microcystis Genotype Succession in Relation to Microcystin Concentrations in Freshwater Lakes,” Aquatic Microbial Ecology, Vol. 48, No. 1, 2007, pp. 1- 12. http://dx.doi.org/10.3354/ame048001
- H. W. Paerl and J. Huisman, “Climate—Blooms Like It Hot,” Science, Vol. 320, No. 5872, 2008, pp. 57-58. http://dx.doi.org/10.1126/science.1155398
- E. Briand, N. Escoffier, C. Straub, M. Sabart, C. Quiblier and J.-F. Humbert, “Spatiotemporal Changes in the genetic Diversity of a Bloom-Forming Microcystis Aeruginosa (Cyanobacteria) Population,” ISME Journal, Vol. 3, No. 4, 2009, pp. 419-429. http://dx.doi.org/10.1038/ismej.2008.121
- M. Sabart, B. Misson, A. Descroix, E. Duffaud, B. Combourieu, M.-J. Salençon and D. Latour, “The Importance of Small Colonies in Sustaining Microcystis Population Exposed to Mixing Conditions: An Exploration through Colony Size, Genotypic Composition and Toxic Potential,” Environmental Microbiology Reports, 2013. http://dx.doi.org/10.1111/1758-2229.12077
- C. S. Bozarth, A. D. Schwartz, J. W. Shepardson, F. S. Colwell and T. W. Dreher, “Population Turnover in a Microcystis Bloom Results in Predominantly Nontoxigenic Variants Late in the Season,” Applied and Environmental Microbiology, Vol. 76, No. 15, 2010, pp. 5207-5213. http://dx.doi.org/10.1128/AEM.00001-10
- A. M. Hotto, M. F. Satchwell and G. M. Boyer, “Molecular Characterization of Potential Microcystin-Producing Cyanobacteria in Lake Ontario Embayments and Nearshore Waters,” Applied and Environmental Microbiology, Vol. 73, No. 14, 2007, pp. 4570-4578. http://dx.doi.org/10.1128/AEM.00001-10
- L. Wörmer, S. Cirés and A. Quesada, “Importance of Natural Sedimentation in the Fate of Microcystins,” Chemosphere, Vol. 82, No. 8, 2011, pp. 1141-1146. http://dx.doi.org/10.1016/j.chemosphere.2010.11.024
- S. Rabouille and M.-J. Salencon, “Functional Analysis of Microcystis Vertical Migration : A Dynamic Model as a Prospecting Tool. II: Influence of Mixing, Thermal Stratification and Colony Diameter on Biomass Production,” Aquatic Microbiol Ecology, Vol. 39, No. 3, 2005, pp. 281-292. http://dx.doi.org/10.3354/ame039281
- D. Latour, H. Giraudet and M.-J. Salençon, “Sampling Method Adapted for Colonial Cyanobacteria in a Lake Environment. Case Study of Microcystis aeruginosa in the Grangent Reservoir (Loire, France),” Comptes Rendus Biologie, Vol. 327, No. 2, 2004, pp. 105-113. http://dx.doi.org/10.1016/j.crvi.2003.12.005
- C. S. Reynolds, “The Ecology of Freshwater Phytoplankton,” Cambridge University Press, Cambridge, 1984, 384 p.
- D. Latour, M.-J. Salencon, J. L. Reyss and H. Giraudet, “Sedimentary Imprint of Microcystis aeruginosa (Cyanobacteria) Blooms in Grangent Reservoir (Loire, France),” Journal of Phycology, Vol. 43, No. 3, 2007, pp. 417-425. http://dx.doi.org/10.1111/j.1529-8817.2007.00343.x
- C. Reynolds and G. Jaworski, “Enumeration of Natural Microcystis Populations,” British Phycological Journal, Vol. 13, No. 3, 1978, pp. 269-277. http://dx.doi.org/10.1080/00071617800650331
- J.-F. Humbert and B. Le Berre, “Genetic Diversity in Two Species of Freshwater Cyanobacteria, Planktothrix (Oscillatoria) rubescens and P. agardhii,” Archive für Hydrobiology, Vol. 150, No. 2, 2001, pp. 197-206.
- B. Sen, J. Hamelin, V. Bru-Adan, J. J. Godon and T. S. Chandra, “Structural Divergence of Bacterial Communities from Functionally Similar Laboratory-Scale Vermicomposts Assessed by PCR-CE-SSCP”, Journal of Applied Microbiology, Vol. 105, No. 6, 2008, pp. 2123- 2132. http://dx.doi.org/10.1111/j.1365-2672.2008.03911.x
- P. Loisel, B. Haegeman, J. Hamelin, J. Harmand and J. J. Godon, “A Method for Measuring the Biological Diversity of a Sample,” European Patent, 2009, Patent No. EP20553401.
- M. Welker, H. Von Döhren, H. Täuscher, C. E. W. Steinberg and M. Erhard, “Toxic Microcystis in Shallow Lake Müggelsee (Germany): Dynamics, Distribution, Diversity,” Archiv für Hydrobiologie, Vol. 157, No. 2, 2003, pp. 227-248. http://dx.doi.org/10.1127/0003-9136/2003/0157-0227
- T. W. Davis, D. L. Berry, G. L. Boyer and C. G. Gobler, “The Effects of Temperature and Nutrients on the Growth and Dynamics of Toxic and Non-Toxic Strains of Microcystis during Cyanobacteria Blooms,” Harmful Algae, Vol. 8, No. 5, 2009, pp. 715-725. http://dx.doi.org/10.1016/j.hal.2009.02.004
- J. M. H. Verspagen, E. Snelder, P. M. Visser, K. D. Johnk, B. W. Ibelings, L. R. Mur and J. Huisman, “Benthic-Pelagic Coupling in the Population Dynamics of the Harmful Cyanobacterium microcystis,” Freshwater Biology, Vol. 50, No. 5, 2005, pp. 854-867. http://dx.doi.org/10.1111/j.1365-2427.2005.01368.x
- R. H. Thomas and A. E. Walsby, “Buoyancy Regulation in a Strain of Microcystis,” Journal of General Microbiology, Vol. 131, No. 4, 1985, pp. 799-809. http://dx.doi.org/10.1099/00221287-131-4-799
- P. M. Visser, B. W. Ibelings and L. R. Mur, “Automnal sedimentation of Microcystis spp. as Result of an Increase in Carbohydrate Ballast at Reduced Temperature,” Journal of Plankton research, Vol. 17, No. 5, 1995, pp. 919-933. http://dx.doi.org/10.1093/plankt/17.5.919
- R. R. Phelan and T. G. Downing, “A Growth Advantage for Microcystin Production by Microcystis PCC7806 under High Light,” Journal of Phycology, Vol. 47, No. 6, 2011, pp. 1241-1246. http://dx.doi.org/10.1111/j.1529-8817.2011.01056.x
- E. Briand, M. Bormans, C. Quiblier, M.-J. Salençon and J.-F. Humbert, “Evidence of the Cost of the Production of Microcystins by Microcystis aeruginosa under Differing Light and Nitrate Environmental Conditions,” PLoS ONE, Vol. 7, No. 1, 2012, Article ID: e29981. http://dx.doi.org/10.1371/journal.pone.0029981
- S. Meissner, J. Fastner and E. Dittmann, “Microcystin Production Revisited: Conjugate Formation Makes a Major Contribution,” Environmental Microbiology, Vol. 15, No. 6, 2013, pp. 1810-1820. http://dx.doi.org/10.1111/1462-2920.12072
- A. Walsby and G. Mcallister, “Buoyancy Regulation by Microcystis in Lake Okaro,” New Zeal Journal of Marine and Freshwater Research, Vol. 21, No. 3, 1987, pp. 521- 524. http://dx.doi.org/10.1080/00288330.1987.9516249
- K. Hesse and J. G. Kohl, “Effects of Light and Nutrient Supply on Growth and Microcystin Content of Different Strains of Microcystis aeruginosa,” In: I. Chorus, Ed., Cyanotoxins: Occurrence, Causes, Consequences, SpringerVerlag, Berlin, 2001, pp. 104-114.
NOTES
*Corresponding author.