American Journal of Analytical Chemistry
Vol.08 No.11(2017), Article ID:80292,16 pages
10.4236/ajac.2017.811053
Traceability of Active Compounds of Essential Oils in Antimicrobial Food Packaging Using a Chemometric Method by ATR-FTIR
Andrea Carolina Solano Valderrama1, Gante Cecilia Rojas De2*
1Department of Biotechnology and Food Engineering, Tecnológico de Monterrey, Campus Monterrey, Monterrey, México
2Department of Bioengineering, Tecnológico de Monterrey, Campus Ciudad de México, Mexico City, México

Copyright © 2017 by authors and Scientific Research Publishing Inc.
This work is licensed under the Creative Commons Attribution International License (CC BY 4.0).
http://creativecommons.org/licenses/by/4.0/


Received: July 11, 2017; Accepted: November 11, 2017; Published: November 14, 2017
ABSTRACT
A simple and rapid Fourier Transform infrared (FTIR) spectroscopy method was developed to determine the main essential oil components (carvacrol, thymol and p-cymene) in the antimicrobial LDPE films incorporated with oregano (Origanum vulgare) and thyme (Thymus vulgaris) essential oils. The ATR-FTIR spectrum of pure active components (carvacrol, thymol and p-cymene) was characterized, and the ranges between 1125 cm−1 - 1095 cm−1, 1170 cm−1 - 1140 cm−1 and 1050 cm−1 - 1017 cm−1 were respectively used for quantitative estimation. Partial least square (PLS) analysis was used for quantitative analysis. FTIR spectroscopy with chemometrics, using the PLS-1st derivative spectra, could predict the content of active compounds accurate to an r2 greater than 0.99 and a standard error of prediction (SEP) less than 0.7. The developed method was successfully applied to predict the concentration of active compounds: carvacrol, thymol and p-cymene in oregano and thyme essential oils with results compared to those of the GC-MS method. The described non-destructive method can be applied in the industry instead of extraction, distillation and blend processes of the mentioned essential oils and can be extended to detect the content of carvacrol, thymol and p-cymene in active packaging and other commercial products.
Keywords:
Chemometrics, Essential Oils, Antimicrobial Packaging, ATR-FTIR Spectroscopy

1. Introduction
Currently, interest in health benefits, along with the demand for products without chemical substances has driven the food industry and food research towards the search for natural antimicrobial compounds [1] . One of the most abundant groups of natural compounds is represented by the essential oils [2] . Essential oils (EOs) are aromatic oily liquids obtained from plant material. They can extend the shelf life of unprocessed or processed foods by reducing microbial growth rate or viability [3] . Some of these substances are also known to contribute to self-defense of plants against infectious organisms [4] . Essential oils and their constituents have been widely used in food (as flavourings), perfumes (fragrances and aftershaves) and pharmaceuticals (for their functional properties). Essential oils have been shown to possess antibacterial, antifungal, antiviral and antioxidant properties due to their active compounds such as carvacrol, thymol, eugenol and p-cymene [2] .
The composition and structure as well as the functional groups of the oils, play an important role in determining their antimicrobial activity. Usually, compounds with phenolic groups are most effective [5] . Although many studies have demonstrated the antimicrobial effect of essential oils and their active compounds against a broad spectrum of pathogenic bacteria in food [6] [7] [8] , there are very few publications that discuss their incorporation as additives in packaging materials [9] [10] [11] [12] [13] . Given that the US Food and Drug Administration categorizes natural extracts such as essential oils (EOs) and their constituents as generally recognized as safe, packaging manufacturers and demanding consumers consider the incorporation of these natural extracts in plastic films an appealing way of avoiding microbial food spoilage [14] .
Active packages that release active agents have been demonstrated as efficient systems to extend the shelf life or to improve the quality and safety of manufactured packaged food [15] . In such systems, the active agents are supported or adsorbed on a solid matrix from which they are released to the atmosphere and act as food-protecting agents. Antimicrobial packaging, an innovative concept, can be defined as a kind of active packaging in which the package, the product, and the environment interact to reduce, inhibit, or retard the growth rate of microorganisms [11] . In these technologies, researchers are developing food packaging materials such as synthetic films [10] [11] [12] and edible films [16] - [22] with antimicrobial properties. Polymers are effective vehicles for the active substances [23] , giving the possibility to incorporate different antimicrobial additives [1] [24] [25] [26] .
Gas chromatography-mass spectrometry (GC-MS) is the most commonly used method for the determination of essential oil components. Components existing in the essential oil can be identified by comparing their relative retention times and their mass spectra. Alternatively, some spectroscopic methods (NIR, IR and Raman) have been successfully applied to identify the main components of the oil and to distinguish different species/chemotypes of various spice plants [27] [28] . Fourier Transform Raman spectroscopy (FT-Raman) and Fourier Transform Infrared (FT-IR) spectroscopy are techniques mainly used for qualitative determination of components based on their unique spectra. Infrared spectroscopic methods are simple, cost-effective, rapid, and nondestructive and have the potential for routine analysis if proper calibration and validation procedures with data acquisition protocols could be established. The application of chemometrics to analyze the spectra is an important step in spectroscopy. The most commonly used multivariate calibration methods are partial least squares (PLS) [29] [30] [31] and principal components (PCA) [32] . The success of these methods depends upon the choice of proper spectral data and the number of variables employed in the calibration model.
The aim of this study was to develop a direct, rapid, simple and nondestructive spectroscopy method in order to identify and quantify three active compounds (carvacrol, thymol and p-cymene) on active antimicrobial packaging material. The antimicrobial packaging was developed by incorporating known concentrations (w/w) of essentials oils of oregano (Origanum vulgare) and thyme (Thymus vulgaris) into low density polyethylene (LDPE), suitable for use as food packaging material.
2. Materials and Methods (Experimental)
2.1. Materials
Essential oils (EOs) of thyme (Thymus vulgaris) and oregano (Origanum vulgare) were used as the antimicrobial agents. The EOs were obtained from Primavera Life (Sulzberg, Germany) and were selected for their high antimicrobial activity and wide availability. The polymer used in these studies was LDPE (PEMEX 20020X, Monterrey, Mexico); attractive characteristics of this polymer include ease of processing, chemically inertness, and low cost. The following chemical substances were used as standards in the analyses of the GC-MS and ATR-FTIR: carvacrol (>98%, CAS 499-75-2), thymol (>99%, CAS 89-83-8) and p-cymene (>99.5%, CAS 99-87-6) by Fluka (Sigma-Aldrich Co., Distrito Federal, Mexico).
2.2. Development of Antimicrobial Films
Pure essential oils of oregano and thyme were incorporated into plastic polymers. The EOs were incorporated into polyolefin films by using two processing methods that would not compromise the antimicrobial potency of the oils: an ionizing treatment and extrusion [13] .
2.3. Ionizing Treatment
In this process, the EOs were incorporated by deposition on the surface of the film after surface modification by using an ionizing treatment. Initially, LDPE films were produced using a single screw extruder (Kilion Extruders Inc., Verona, NJ, USA) with an L/D ratio screw of 24:1 and an operating speed of 30 rpm. The temperature profile from the first barrel zone to the die was 140/160/190/190˚C. The film surface was ionized by electronic radiation using a Laboratory Corona Treater model BD-20AC (Electro-Technic Products, Inc., IL, USA). The wire electrode was passed back and forth approximately 2.5 cm above each film surface for 2 min at high frequency of 4 - 5 MHz. After the film surface was ionized by electronic radiation, the films were characterized with a sessile drop contact angle measurement in order to determine the change in surface hydrophilicity. Then, samples of the treated films (5 × 5 cm) were taken randomly from an area of 1 m2 and a known volume of each essential oil was placed on each sample. The samples were placed in an incubator (30˚C ± 2˚C) to evaporate the solvents. LDPE films incorporating 1% and 4% (w/w) of EOs and control films without EO were produced.
2.4 Extrusion
The EOs were preblended with LDPE polymer resin into a master batch (Brabender Instruments, Inc., South Hackensack, NJ, USA). Two hundred fifty grams of resin was added to the mixer with 40 ml of EO at 110˚C and 50 rpm for 30 min. The preblended oil resin was then ground in a knife mill to produce 2 mm fragments and finally incorporated with virgin resin pellets in a single screw extruder (Kilion Extruders Inc.) with an L/D ratio screw of 24:1 and an operating speed of 30 rpm. The temperature profile from the fed zone to the die was 120/155/175/175˚C. The extrusion and master batch temperatures of the LDPE (120˚C - 190˚C) were changed to protect the active oil compounds from oxidation. LDPE films incorporating 1% and 4% (w/w) of EOs and control films without EOs were produced.
The antimicrobial packaging materials developed by these processes were immediately wrapped in aluminum foil to minimize the loss of the antimicrobial agent by evaporation and were then stored at room temperature for up to 1 week prior to testing.
2.5. Gas Chromatography-Mass Spectrometric (GC-MS) Analysis
The analysis of the essential oils was taken by using a Agilent 6890 gas chromatograph (Agilent Technologies, México), equipped with a Agilent 5973-mass selective detector and a capillary column HP-5 MS (30 m × 0.25 mm, 0.25 μm film thickness). The column temperature program for the gas chromatography was as follows: initial temperature, 75˚C, followed by gradients of 15˚C/min to 200˚C, then 10˚C/min to 290˚C, which was held for 5 min. The injector temperature was 250˚C; injection was in splitless mode (50:1). The carrier gas was helium (99.999% purity, 1.0 mL/min) supplied by AOC (Monterrey, México). For GC-MS detection an electron ionization system was used with ionization energy of 70 eV. Diluted samples of 0.5 μL (1/100 in acetone) were injected. Identification of the components was based on their relative retention time and their mass spectra in comparison with those observed by the references.
2.6. Attenuated Total Reflectance―Fourier Transform Infrared Spectroscopy (ATR-FTIR) Analysis
Infrared spectra of the chemical references, EOs and antimicrobial packaging were analyzed by using a Perkin-Elmer spectrophotometer (Spectrum One) with a device for attenuated reflectance (ATR) with a diamond crystal universal accessory (Buckinghamshire, U.K). The spectrum of pure chloroform (99.9% purity, Sigma Aldrich) was used as the background and chemical references were dissolved in chloroform and used for ATR-FTIR analysis. Single beam spectra (4000 cm−1 - 600 cm−1) of the samples were obtained, and corrected against the background spectra, to present the spectra in absorbance units at a resolution of 4 cm−1. The ATR crystal was carefully cleaned with pure chloroform between measurements. Spectra were collected in duplicate and used for multivariate analysis.
2.7. Chemometrics: Multivariate Analysis
The characteristic vibration frequencies of functional groups of the pure substances spectrum were used in the statistical model as well as individually to determine the best or significant ranges of the spectra that would provide the best prediction. The selected ranges were then used to estimate the concentration of carvacrol, thymol and p-cymene in EOs and antimicrobial films. XLSTAT2007 software was use for quantitative analysis using PLS method. It was obtained calibration models with the transformed 1st derivate and the original spectra and the optimum number of calibration factors was selected based on the predicted residual sum of squares (PRESS), which was minimized, while maximizing the r2 from regression. The correlation coefficient was determined and the predictability of the models was tested by computing the standard error of calibration (SEC) for the calibration data sets and the standard error of prediction (SEP) for the validation data sets.
2.8. Calibration and Validation Models
Stock solution of 80 g per 100 mL was prepared by dissolving chemical standards in chloroform. This solution was further used to prepare chemical standards of active compounds solutions with appropriate dilutions. Final concentration of chemical standards solutions were in the range between 0 and 800 mg/mL. The content range of all chemical references considered was consistent with the standard content of the EOs analyzed. Twenty different concentrations from the above range (with increments of 10 mg/mL) were used for calibration and eleven for validation.
3. Results and Discussion
The antimicrobial active LDPE films with thyme and oregano EOs was performed by using two different methods. LDPE packaging films with thickness of 23 ± 3 μm were obtained by ionizing treatment and LDPE films with thickness of 27.5 ± 3.5 μm by the extrusion process. In order to incorporate and protect the essential oils, the standard extrusion conditions of LDPE films (120˚C - 190˚C) were modified. Reductions of 20˚C in the first barrel zone and 15˚C in the other zones were used without compromising the structural and mechanical integrity of the film packaging.
The antimicrobial activity of active films was determined quantitatively using the agar plate diffusion method. The zone of inhibition on solid media was used to determine the antimicrobial effects of active films against Escherichia coli 0157:H7, Salmonella typhimurium, and Listeria monocytogenes. The results obtained were reported in a preliminary report [13] (Valderrama-Solano and Rojas de Gante, 2011). The LDPE active films developed by extrusion incorporating 1% and 4% (w/w) of thyme and oregano EOs showed antimicrobial activity against all tested microorganism. LDPE active films developed using the ionizing method incorporating 4% (w/w) of EOs were effective against all tested microorganisms. However, the ionized films incorporating 1% (w/w) of EOs didn’t show antimicrobial activity.
3.1. Vibrational Spectra Analysis of the Pure Active Compounds Carvacrol, Thymol and P-Cymene by ATR-FTIR
Detailed spectra analysis of the investigated oils is based on their spectra vibrational form. Table 1 shows different bands observed in each active compound spectrum with the respective assignment of their bonds corresponding to the mode of vibration. The ATR-FTIR spectra of terpenoid compounds, which are present in the investigated essential oils as active compounds, have been recorded (cf. Figure 1). All of them show some characteristic key absorbance bands, which can be used for discrimination among carvacrol (A), thymol (B) and p-cymene (C).
The spectrum of p-cymene (cf. Figure 1(C)) shows the C=C stretching vibration of the aromatic ring in the range from 1500 to 1400 cm−1, and the isopropyl methyl group symmetric bending vibration is observed at 1381 cm−1. The asymmetric vibration of the same group appears at 1362 cm−1. The para-substituted phenyl is assigned to the band in the range 1055 cm−1 - 1019 cm−1, while the strong double band at 813 cm−1 is assigned to the phenyl nucleus breathing mode. This peak’s shape is probably affected by the different substituents of the para-substituted phenyl [33] [34] .
The ATR-FTIR spectra of carvacrol (cf. Figure 1(A)) and thymol (cf. Figure 1(B)) show the same bands in the range 1600 - 1585 for C=C stretching vibration and bands at 1381 cm−1 and 1362 cm−1 for isopropyl methyl group. Isomeric compounds like thymol and carvacrol show characteristic differences in the fingerprint region. In ATR-FTIR spectra ring vibration of thymol is seen at 807 cm−1, while for carvacrol this corresponding signal appears at 811 cm−1. These bands are usually very intense in FTIR and can be attributed to out-of-plane CH wagging vibrations, which are the most significant signals used in distinguishing different types of aromatic ring substitutions [35] . Furthermore, key characteristic peaks of carvacrol occur at 862, 837, 994, 1116 and 1173 cm−1, whereas absorptions relating to thymol vibrations are found at 877, 945, 1044, 1087, 1153 and 1289 cm−1.
3.2. Spectral Identification of the Individual Active Compounds in the EOs by ATR-FTIR
The analyzed essential oil samples were measured by ATR-FTIR spectroscopy (cf. Figure 2). A comparison of spectral characteristics between essential oils (see Figure 2) and reference standard compound (Figure 1) clearly shows that the major substances occurring in individual essential oils dominate the resulting vibration spectra. Accordingly, the spectra of the individual essential oils exhibit molecular vibration profiles very similar to that of their main components and all the key absorbance bands listed in Table 1 were found for the two types of essential oils.
Those compounds, which are present in essential oils at low concentration, do

Table 1. Functional groups and mode of vibration from the pure active compounds carvacrol, thymol and p-cymene by ATR-FTIR.

Figure 1. ATR-FTIR spectra of pure individual compound: carvacrol (A), thymol (B) and p-cymene (C).
not significantly influence the ATR-FTIR spectrum. As can be seen in Figure 2(A), the spectrum of Oreganum vulgare EO is dominated by strong bands at 811, 994, 1116, 1173 and 1251 cm−1 attributed to its main components, carvacrol. The presence of intense bands at 807, 945, 1087, 1153 and 1289 cm−1 in the ATR-FTIR spectrum of Thymus vulgaris EO (see Figure 2(B)) allows denoting thymol as its main component. To find compounds in low concentration that occur in oregano and thyme oils, we used an additive method by using three know concentrations of each standard and identifying the frequencies sensitive to the concentration changes. The ATR-FTIR spectrum obtained and key absorbance bands identified as sensitive to the concentration change of thymol and p-cymene in oregano are shown in Figure 3 and of carvacrol and p-cymene in thyme are shown in Figure 4.
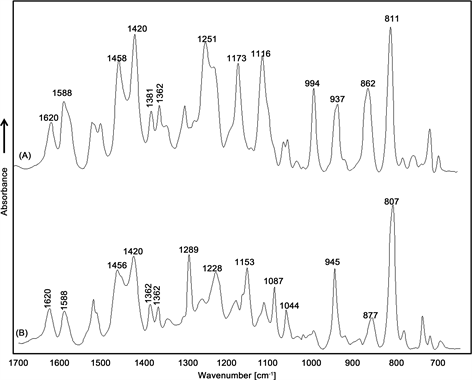
Figure 2. ATR-FTIR spectra of Origanum vulgare (A) and Thymus vulgaris (B) essential oils.

Figure 3. ATR-FTIR spectra of Origanum vulgare essential oil with different concentration of thymol (A) and p-cymene (B).

Figure 4. ATR-FTIR spectra of Thymus vulgaris essential oil with different concentration of carvacrol (A) and p-cymene (B).
The ATR-FTIR spectrum of O. vulgaris EO with added thymol (53, 21 and 7.35% (w/w)) (Figure 3(A)) shows absorbance bands sensitive to the change in thymol concentration at 807, 945, 1059, 1087, 1153, 1228 and 1289 cm−1. The ATR-FTIR spectrum of T. vulgaris EO with added carvacrol (36, 23 and 9% (w/w)) (cf. Figure 4(A)) shows absorption bands sensitive to changes in carvacrol concentrations at 862, 994, 1116, 1173 and 1251 cm−1. Both, the O. vulgare and T. vulgaris EOs presents sensitive bands for the change of p-cymene concentration at 1514, 1056 and 1020 cm−1 (cf. Figure 3(B) and Figure 4(B)).
3.3. Identification of Significant Range of Spectrum for Analysis
Table 2 shows a PLS analysis of different ranges of the spectrum of the active compounds. We determined the spectrum range that could provide the best prediction. For carvacrol, when complete spectrum were used in the range 1300 cm−1 - 900 cm−1, r2 values lower than 0.98 were obtained with their respective SEC and SEP values of 1.514 and 1.742 with four factors in the model. The range at 1300 cm−1 - 1150 cm−1 (containing two strong bands at 1252 cm−1 and 1173 cm−1) gave a
Table 2. Partial least square (PLS) analysis of different regions of the spectra for analysis of carvacrol, thymol and p-cymene.
SEC: standard error of calibration. SEP: standard error of prediction.
higher value of r2, but when the range was used between 1125 cm−1 - 1095 cm−1 the values were lower, the best results were obtained in this range. For thymol and p-cymene, the best results were obtained when spectra were used in the range between 1170 cm−1 - 1140 cm−1 and 1050 cm−1 - 1017 cm−1, respectively.
3.4. Calibration Model for Quantitative Analysis of Active Compounds
The PLS model performance indicators with their original and first derivate spectra as input are shown in Table 3. Values of r2 were greater than 0.99 for the calibration as well as validation data sets and the SEC and SEP estimates were lower than 0.9. The PLS model with 1st derivate gave slightly better results. The factor of analysis for the models obtained using the best range of the spectra identifies above was one, thereby indicating the consistency of prediction. Since the PLS-1st derivate was consistently a better predictor, this technique was used to further validate and test the model. The minimum detection limit for this ATR-FTIR method was found as low as 1 mg/g.
3.5. Determination of the Active Compounds: Carvacrol, Thymol and P-Cymene in Oregano and Thyme Essential Oils by ATR-FTIR Method
Oregano and thyme essential EOs were analyzed by using the calibration model developed and compared with the GC-MS method (Table 4). The presence of carvacrol, thymol and p-cymene was confirmed by GC-MS. The oregano essential oil was characterized by the presence of carvacrol (73.3% (w/w)), thymol
Table 3. Chemometric analysis using the better region of the spectra for carvacrol, thymol and p-cymene determination.
PLS: Partial least square. SEC: standard error of calibration. SEP: standard error of prediction.
Table 4. Comparison between the prediction by ATR-FTIR spectroscopy and the GC-MS method.
Data are expressed as mean ± standard deviation (N = 3).
(7.6% (w/w)) and p-cymene (6.0% (w/w)) as the major constituents with retention times of 9.37, 9.25 and 5.70, respectively. In thyme essential oil the most abundant compounds were thymol (44.4% (w/w)), p-cymene (16.8% (w/w)) and carvacrol (5.12% (w/w)) with retention times of 9.26, 5.70, and 9.41, respectively.
Several authors have found that the inhibitory effect of oregano and thyme EOs was due to the high concentration of phenolic compounds such as carvacrol and thymol [6] [7] . Thyme EO is rich in thymol and carvacrol, which yield considerable antioxidative and antimicrobial effects [36] [37] [38] [39] reported that, thyme essential oil contained mainly carvacrol and thymol, and p-cymene and gamma-terpine. However, only carvacrol and thymol displayed favorable bacteriostatic and bactericidal properties. Carvacrol and thymol (the major components of oregano and thyme EOs) were able to disintegrate the outer membrane of gram-negative bacteria, releasing lipopolysaccharides and increasing the permeability of the cytoplasmic membrane to ATP [2] .
The results obtained by the ATR-FTIR method (Table 4) were found to be slightly higher compared to those of the GC-MS method. Using the GC-MS method as reference, percent prediction error the active compounds in essentials oils analyzed were found to be in the range between 1.4% and 5.1%.
3.6. Traceability of the Active Compounds: Carvacrol, Thymol and P-Cymene in Antimicrobial LDPE Films by ATR-FTIR
The content of active compounds in the antimicrobial LDPE films formulated
Table 5. Traceability of active compounds: carvacrol, thymol and p-cymene in antimicrobial LDPE films by ATR-FTIR.
Data are expressed as mean ± standard deviation (N = 3). LDPE: low-density polyethylene.
was determined by the calibration model. The results obtained by the ATR-FTIR method were showed in the Table 5. Three samples of each antimicrobial LDPE films developed by ionizing treatment and by extrusion process were analyzed. The ATR-FTIR spectrum of each film was obtained and the FTIR spectrum of LDPE films without essential oils was used as background. Only was identified the active compounds of the essential oils on the antimicrobial film.
In the LDPE active films developed by using ionizing and extrusion method incorporating 4% (w/w) of oregano EO were identified the active compounds (carvacrol and thymol) and for those incorporating 4% (w/w) of thyme EO were identified the active compounds (thymol and p-cymene). For antimicrobial films incorporated with 1% (w/w) of EO only the principal compounds was identified.
Although antimicrobial films developed by using the ionization incorporating 1% (w/w) of EOs were observed the presence the EOs in the matrix of the polymer, this concentration was not effective against any test microorganism. Other compounds related to the essential oils presented in low concentration were not detected in the antimicrobial films; probably its concentration was lower than the detection limit or the EOs were not presented in the matrix of polymer. The antimicrobial packaging films developed by extrusion have showed a major amount of active compounds than by the ionizing treatment. These results demonstrated that the better antimicrobial activity of the active films developed by extrusion process is due to the presence of more active compounds on the polymer matrix. The advantage of including essential oils during the extrusion process is that the incorporation of these into the polymer matrix is more effective and homogeneous and the active compounds are more protected from oxidation or degradation by light and oxygen compared to the deposition technique of the oils on the ionized surface of the film where they are exposed to these factors.
4. Conclusion
A rapid and simple FTIR procedure was developed to directly determine the concentration of active compounds of the essential oils: carvacrol, thymol and p-cymene in oregano and thyme essential oils and in the antimicrobial LDPE films incorporated with these EOs. PLS-1st derivative calibration models were developed by using the spectra in the range between 1125 cm−1 - 1095 cm−1 for carvacrol, 1170 cm−1 - 1140 cm−1 for thymol and 1050 cm−1 - 1017 cm−1 for p-cymene. The FTIR method developed was fast and low cost than the conventional method by GC-MS. The ATR-FTIR method is cost effective and analysis could be done in less than 5 min and this analytical technique can be extended to detect the concentration of active compounds of oregano and thyme essential oils in other commercial products.
Acknowledgements
This work was supported by grant 12786-2005 provided by National Council on Science and Technology (CONACYT) of Mexico.
Cite this paper
Valderrama A.C.S. and Rojas De G.C. (2017) Traceability of Active Compounds of Essential Oils in Antimicrobial Food Packaging Using a Chemometric Method by ATR-FTIR. American Journal of Analytical Chemistry, 8, 726-741. https://doi.org/10.4236/ajac.2017.811053
References
- 1. Devlieghere, F., Vermeiren, L., Jacobs, M. and Debevere, J. (2000) The Effectiveness of Hexamethylenetetramine Incorporated Plastic for the Active Packaging of Foods. Packaging Technology & Science, 13, 117-121. https://doi.org/10.1002/1099-1522(200005)13:3<117::AID-PTS500>3.0.CO;2-B
- 2. Burt, S. (2004) Essential Oil: Their Antibacterial Properties and Potential Applications in Food—A Review. International Journal of Food Microbiology, 94, 223-253. https://doi.org/10.1016/j.ijfoodmicro.2004.03.022
- 3. Beuchat, L.R. and Golden, D.A. (1989) Antimicrobials Occurring Naturally in Foods. Food Technology, 43, 134-142.
- 4. Kim, H.Y., Lee, Y.J., Hong, K-H., Kwon, Y-K., Sim, K-C., Lee, J-Y., Cho, H-Y., Kim, I-S., Han, S-B., Lee, C-W., Shin, I-S. and Cho, J.S. (2001) Isolation of Antimicrobial Substances from Natural Products and Their Preservative Effects. Food Science and Biotechnology, 10, 59-71.
- 5. Dorman, H.J.D. and Deans, S.G. (2000) Antimicrobial Agents from Plants: Antibacterial Activity of Plant Volatile Oils. Journal of Applied Microbiology, 88, 308-316. https://doi.org/10.1046/j.1365-2672.2000.00969.x
- 6. Hammer, K., Carson, C. and Riley, T. (1999) Antimicrobial Activity of Essential Oils and Other Plant Extracts. Journal of Applied Microbiology, 86, 985-990. https://doi.org/10.1046/j.1365-2672.1999.00780.x
- 7. Burt, S. and Reinders, R. (2003) Antibacterial Activity of Selected Plant Essential Oil against Escherichia coli O157:H7. Letters in Applied Microbiology, 36, 162-167. https://doi.org/10.1046/j.1472-765X.2003.01285.x
- 8. Di Pascua, R., De Feo, V., Villani, F. and Mauriello, G. (2005) In Vitro Antimicrobial Activity of Essential Oils from Mediterranean Apiaceae, Verbenaceae and Lamiaceae against Foodborne Pathogens and Spoilage Bacteria. Annals of Microbiology, 55, 139-143.
- 9. Ha, J., Kim, Y. and Lee, D. (2001) Multilayered Antimicrobial Polyethylene Films Applied to the Packaging of Ground Beef. Packaging Technology and Science, 15, 55-62. https://doi.org/10.1002/pts.537
- 10. Suppakul, P., Miltz, J., Sonneveld, K. and Bigger, S. (2006) Characterization of Antimicrobial Films Containing Basil Extracts. Packaging Technology and Science, 19, 259-268. https://doi.org/10.1002/pts.729
- 11. Suppakul, P., Sonneveld, K., Biggen, S. and Miltz, J. (2008) Efficacy of Polyethylene-Based Antimicrobial Films Containing Principal Constituents of Basil. LWT—Food Science and Technology, 41, 779-788.
- 12. López, P., Sanchez, C., Batle, R. and Nerín, C. (2007) Development of Flexible Antimicrobial Films using Essentials Oils as Active Agents. Journal of Agricultural and Food Chemistry, 55, 8814-8824. https://doi.org/10.1021/jf071737b
- 13. Valderrama-Solano, A.C. and Rojas de Gante, C. (2011) Two Different Processes to Obtain Antimicrobial Packaging Containing Natural Oils. Food Bioprocess Technology. https://doi.org/10.1007/s11947-011-0626-3
- 14. Nerín, C., Tovar, L. and Salafranca, J. (2008) Behaviour of a New Antioxidant Active Films versus Oxidizable Model Compound. Journal of Food Engineering, 84, 313-320.
- 15. Barros Velazquez, J. (2011) Innovations in Food Technology Special Issue. Food and Bioprocess Technology. https://doi.org/10.1007/s11947-011-0576-9
- 16. Natrajan, N. and Sheldon, B. (2000a) Inhibition of Salmonella on Poultry Skin using Protein and Polysacharide-Base Films Containing Nisin Formulation. Journal of Food Protection, 63, 1268-1272. https://doi.org/10.4315/0362-028X-63.9.1268
- 17. Ouattara, B., Simard, R., Piette, G., Begin, A. and Holley, R. (2000) Diffusion of Acetic and Propionic Acids from Chitosan-Based Antimicrobial Packaging Films. Journal of Food Science, 65, 768-773. https://doi.org/10.1111/j.1365-2621.2000.tb13584.x
- 18. Jagannath, J., Nanjappa, C., Gupta, D. and Bawa, A. (2006) Studies on the Stability of an Edible Film and Its Use for the Preservation of Carrot (Daucus carota). International Journal of Food Science Technology, 41, 498-506. https://doi.org/10.1111/j.1365-2621.2005.01038.x
- 19. Kim, K.M., Lee, B.Y. and Kim, Y.T. (2006) Development of Antimicrobial Edible Film Incorporated with Green Tea Extract. Food Science and Biotechnology, 15, 478-481.
- 20. Seydim, A. and Sarikus, G. (2006) Antimicrobial Activity of Whey Protein Based Edible Films Incorporated with Oregano, Rosemary and Garlic Essential Oils. Food Research International, 39, 639-644.
- 21. Rojas-Grau, M., Avena-Bustillos, R. and Friedman, M. (2006) Mechanical Barrier and Antimicrobial Properties of Apple Pureedible Films Containing Plant Essential Oils. Journal of Agricultural Food Chemistry, 54, 9262-9267. https://doi.org/10.1021/jf061717u
- 22. Campos, C., Gerschenson, L. and Flores, S. (2010) Development of Edible Films and Coatings with Antimicrobial Activity. Food and Bioprocess Technology. https://doi.org/10.1007/s11947-010-0434-1
- 23. López-Rubio, A., Almenar, E., Hernandez-Munoz, P., Lagarrón, J., Catalá, R. and Gavara, R. (2004) Overview of Active Polymerbased Packaging Technologies for Food Applications. Food Reviews International, 20, 357-387. https://doi.org/10.1081/FRI-200033462
- 24. Scannell, A., Hill, C., Ross, R., Marx, S., Hartmeier, W. and Arendt, E. (2000) Development of Bioactive Food Packaging Materials using Immobilized Bacteriocins Lacticin 3147 and Nisaplin. International Journal of Food Microbiology, 2-3, 241-249.
- 25. Vartiainen, J., Skytta, E. and Ahvenainen, R. (2003) Antimicrobial and Barrier Properties of LDPE Films Containing Imazil and EDTA. Journal of Plastic Film and Sheeting, 19, 249-261. https://doi.org/10.1177/8756087903042808
- 26. Miltz, J., Rydlo, T., Mor, A. and Polyakov, V. (2006) Potency Evaluation of a Dermaseptin S4 Derivate for Antimicrobial Food Packaging Applications. Packaging Technology Science, 19, 345-354. https://doi.org/10.1002/pts.738
- 27. Siatis, N.G., Kimbaris, A.C., Pappas, C.S., Tarantilis, P.A., Daferera, D.J. and Polissiou, M.G. (2005) Rapid Method for Simultaneous Quantitative Determination of Four Major Essential Oil Components from Oregano (Oreganum sp.) and Thyme (thymus sp.) Using FT-Raman Spectroscopy. Journal of Agricultural and Food Chemistry, 53, 202-206. https://doi.org/10.1021/jf048930f
- 28. Baranska, M., Schulz, H., Kruger, H. and Quilitzsch, R. (2005) Chemotaxonomy of Aromatic Plants of the Genus Origanum via Vibrational Spectroscopy. Analytical and Bioanalytical Chemistry, 381, 1241-1247. https://doi.org/10.1007/s00216-004-3018-y
- 29. Haaland, D.M. and Thomas, E.V. (1988) Partial Leasts Quares Methods for Spectral Analyses. 1. Relations to Other Quantitative Calibration Methods and the Extraction of Qualitative Information. Analytical Chemistry, 60, 1193-1202. https://doi.org/10.1021/ac00162a020
- 30. Schulz, H., Quilitzsch, R. and Kruger, H. (2003) Rapid Evaluation and Quantitative Analysis of Thyme, Oregano and Chamomile Essential Oils by ATR-IR and NIR Spectroscopy. Journal of Molecular Structure, 661-662, 299-306.
- 31. Schulz, H., Baranska, M., Belz, H-H., Rosch, P., Strehle, M.A. and Popp, J. (2004) Chemotaxonomic Characterization of Essential Oil Plants by Vibrational Spectroscopy Measurements. Vibrational Spectroscopy, 35, 81-86.
- 32. Maltesen, M.J., Bjerregaard, S., Hovgaard, L., Havelund, S., van de Weer, M. and Grohganz, H. (2011) Multivariate Analysis of Phenol in Freeze-Dried and Spray-Dried Insulin Formulations by NIR and FTIR. AAPS PharmSciTech, 12, 627-636. https://doi.org/10.1208/s12249-011-9618-x
- 33. Daferera, D., Tarantilis, P. A. and Polissiou, M. (2002) Characterization of Essential oils from Lamiaceae Species by Fourier Transform Raman Spectroscopy. Journal of Agricultural and Food Chemistry, 50, 5503-5507. https://doi.org/10.1021/jf0203489
- 34. Nakanishi, K. and Solomon, P.A. (1977) Infrared Absorption Spectroscopy. 2nd Edition, Holden-Day, San Francisco.
- 35. Schulz, H., Ozkan, G., Baranska, M., Kruger, H. and Ozcan, M. (2005) Characterisation of Essential Oils Plants from Turkey by IR and Raman Spectroscopy. Vibrational Spectroscopy, 39, 249-256.
- 36. Marino, M., Bersani, C. and Comi, G. (1999) Antimicrobial Activity of the Essential Oils of Thymus vulgaris L. Measured using a Bioimpedometric Method. Journal of Food Protection, 62, 1017-1023. https://doi.org/10.4315/0362-028X-62.9.1017
- 37. Sacchetti, G., Maietti, S., Muzzoli, M., Scaglianti, M., Manfredini, S., Radice, M. and Bruni, R. (2005) Comparative Evaluation of 11 Essential Oils of Different Origin as Functional Antioxidants, Antiradicals, and Antimicrobials in Foods. Food Chemistry, 91, 621-632.
- 38. Mehdizadeh, T., Tajik, H., RazaviRohani, S.M. and Oromiehie, A.R. (2012) Antibacterial, Antioxidant and Optical Properties of Edible Starch-Chitosan Composite Film Containing Thymus kotschyanus Essential Oil. Veterinary Research Forum, 3, 167-173.
- 39. Burt, S.A., Vlielander, R., Haaqsman, H.P. and Veldhuizen, E.J. (2005) Increase in Activity of Essential Oil Components Carvacrol and Thymol against Escherichia coli O157:H7 by Addition of Food Stabilizers. Journal of Food Protection, 68, 919-926. https://doi.org/10.4315/0362-028X-68.5.919