American Journal of Analytical Chemistry
Vol.5 No.6(2014), Article ID:45160,6 pages DOI:10.4236/ajac.2014.56046
Near-Infrared Analysis of Peanut Seed Skins for Catechins
Ronald A. Holser
Quality and Safety Assessment, Russell Research Center, USDA-ARS, Athens, USA
Email: Ronald.Holser@ars.usda.gov
Copyright © 2014 by author and Scientific Research Publishing Inc.
This work is licensed under the Creative Commons Attribution International License (CC BY).
http://creativecommons.org/licenses/by/4.0/


Received 26 February 2014; revised 28 March 2014; accepted 6 April 2014
ABSTRACT
Peanuts (Arachis hypogaea) produce several phenolic compounds such as catechins that may be isolated as co-products from peanut seed testae or skins during peanut processing. Peanut skins are currently underutilized although they are a potential source of bioactive compounds for use in functional foods and animal feeds. The phenolic compounds in the skins can degrade during processing and lose bioactivity. Extracted peanut skins were analyzed by near-infrared (NIR) spectroscopy to detect phenolic compounds. Spectra were collected from 10000 - 4000 cm−1 and evaluated by principal component analysis (PCA) to compare differences in peanut skins before and after alcohol extraction. PCA of derivative spectra showed clear separation into two groups. These results support the development of predictive models to measure catechins in blanched peanut skins.
Keywords:Anthocyanidins, Arachis hypogea, Near-Infrared, Phenolics, Spectroscopy

1. Introduction
Peanuts, Arachis hypogaea, are cultivated as a source of edible seed oil and protein. In the United States, 1.638 million acres were planted in 2012 with a value over 1 billion dollars according to the USDA, Economic Research Service [1] . Peanut seeds contain 47 wt% oil with a nominal fatty acid composition of 30% linoleic acid, 45% oleic acid, and 20% stearic acid. The seed oil is 75% unsaturated with omega 6 and omega 9 fatty acids. The peanut seed testa or skin that surrounds the seed is typically removed after the shelling process by blanching. The skin is separated and recovered as a low value by-product with few applications beyond animal feed although new applications are under development [2] . Peanut skins contain bioactive phenolic compounds including catechins and proanthocyanidins [3] . Awareness of the health benefits of antioxidants has generated interest in peanut skins as an economical source of these phenolic compounds. The availability of peanut skins and the associated antioxidant properties of peanut skin phenolic compounds suggests numerous applications in functional food and feed formulations [4] -[6] . A simple nondestructive technique for the analysis of these antioxidant phenolic compounds will facilitate the utilization of peanut skins. Phenolic compounds exhibit strong absorbance in the ultraviolet (UV) region produced by the aromatic ring structure. This absorbance is often monitored at 280 nm for many phenolic structures. The absorbance is due to electronic transitions and scanning a phenolic compound will produce the corresponding UV absorption spectra. UV spectroscopy offers a relatively simple approach to detect the presence of phenolic compounds, however, the spectra do not exhibit the variation or detail available from vibrational spectroscopy. The current investigation was undertaken to evaluate nearinfrared spectroscopy for the detection of phenolic compounds in blanched peanut skins. Spectroscopic methods are rapid, nondestructive, and easily implemented for routine analysis with chemometric models [7] [8] .
2. Experimental
2.1. Materials
Blanched peanut skins were obtained from Universal Blanchers, Sylvester, Georgia, USA and stored at −5˚C prior to extraction and analysis. Skins were extracted overnight at room temperature with ethanol at a 1:100 solids:solvent ratio (weight/volume). Extractions were performed in glass flasks wrapped in aluminum foil to exclude light and placed on a magnetic stirring plate set at 100 rpm. Extracts were recovered from the solids by vacuum filtration and stored at −5˚C. Solid samples were frozen and ground to powder in a coffee mill (Cuisinart, model PG-13658). Standards were prepared from 98% pure catechin, epicatechin, ferulic acid, and p-coumaric acid (Sigma-Aldrich, St. Louis, MO, USA). A series of solutions were made in spectroscopic grade ethanol (Sigma-Aldrich, St. Louis, MO, USA) at concentrations of 0.1, 0.25, 0.5, 1.0 and 2.0 mg/mL of each compound for calibration curves. The chemical structures of these compounds are presented in Figure 1.
2.2. Spectroscopy
Infrared spectra were collected on a Perkin Elmer model Spectrum 400 FT-IR/FT-NIR spectrometer equipped for mid-infrared and near-infrared reflectance measurements (Waltham, MA, USA). Spectra were processed with Unscrambler X (Camo Software, Oslo, Norway). Ultraviolet spectra were collected on a Perkin Elmer model Lambda 2S UV/VIS spectrometer (Waltham, MA, USA) fitted with the Labsphere model RSA-PE-20 diffuse reflectance accessory. Spectra were scanned at 240 nm/min from 200 - 400 nm with a 2 nm slit width. The 50% reflectance standard was used for reference. Derivative spectra were calculated by the Savitsky-Golay
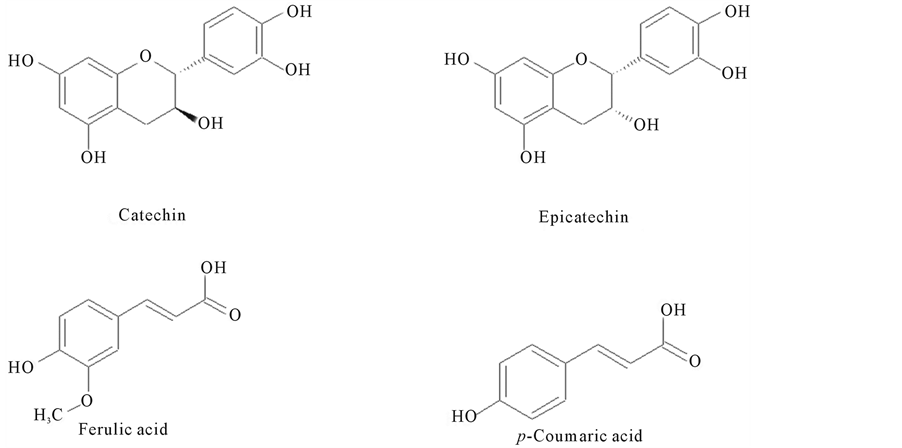
Figure 1. Structures of common phenolic compounds.
method with a second order polynomial and 3 point smoothing. Principal component analysis (PCA) was performed on first derivative and second derivative spectra with cross validation to establish classifications for subsequent modeling [9] .
3. Results and Discussion
Phenolic compounds absorb strongly in the ultraviolet region and their spectra can be used for detection and quantitation (Figure 2). Liquid chromatographic methods often monitor absorbance at 280 nm to detect phenolic compounds in the eluent after separation with the appropriate selection of mobile and stationary phases. This instrumental approach is applicable for the analysis of liquid samples such as extracts but requires a significant investment in equipment and technical expertise. For screening large numbers of samples a rapid technique with minimal sample preparation, instrumentation, and operator training is needed. Spectroscopic methods are suitable and easily adapted for the measurement of solid samples with available reflectance accessories.
Vibrational spectra, particularly near-infrared (NIR), are commonly used for quality control in the food and feed industries. Spectral features in this region are used to quantify lipid, protein, and moisture composition of products. NIR spectra obtained from blanched peanut skins before and after alcohol extraction to remove phenolic compounds are shown in Figure 3.
The difference spectra show several regions that could be used to develop chemometric models for screening phenolic compounds in peanut skins. Prominent differences are centered at 4259.2, 4333.5, 42.7, 5193.1, 5679, 5791.6, 892.1, and 8268.9 cm−1. Principal component analysis (PCA) was performed on a set of 18 spectra. The scores plot in Figure 4 shows clear separation of extracted (left) and un-extracted peanut skins (right) along the x-axis with some dispersion evident along the y-axis.
PCA was repeated on first and second derivative spectra with the results shown in Figure 5 and Figure 6, respectively. The first principal component accounted for 99% of the variation in the first derivative spectra and 90% in the second derivative spectra. The second order derivative introduced noise typical of the higher order derivatives and still produced acceptable classification. The first order derivative transformation would be the better choice for further analysis. These results demonstrate the application of NIR to detect phenolic compounds in peanut skins and provide the basis for model development.
The availability of inexpensive NIR instruments and the rapid analysis time provides a robust technique for quality control and assurance purposes without the need to extract and chromatographically analyze samples.
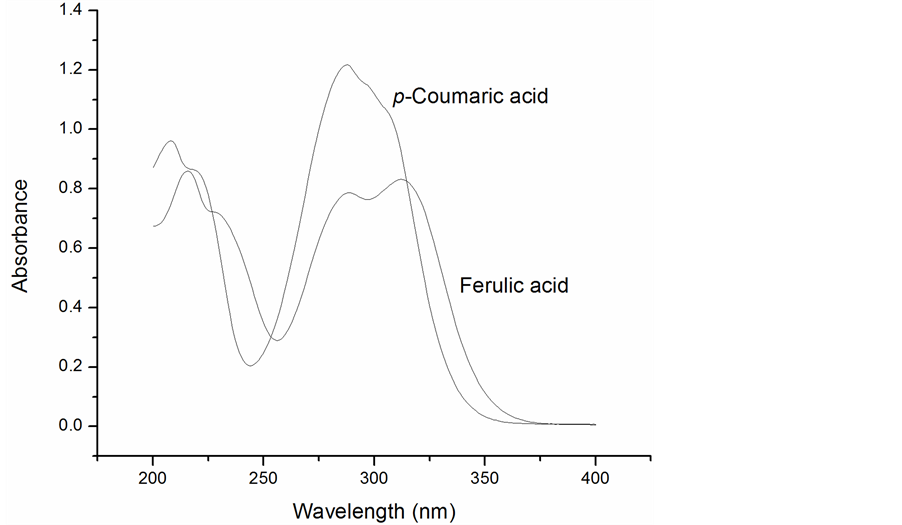
Figure 2. Ultraviolet spectra of ferulic and coumaric acids.
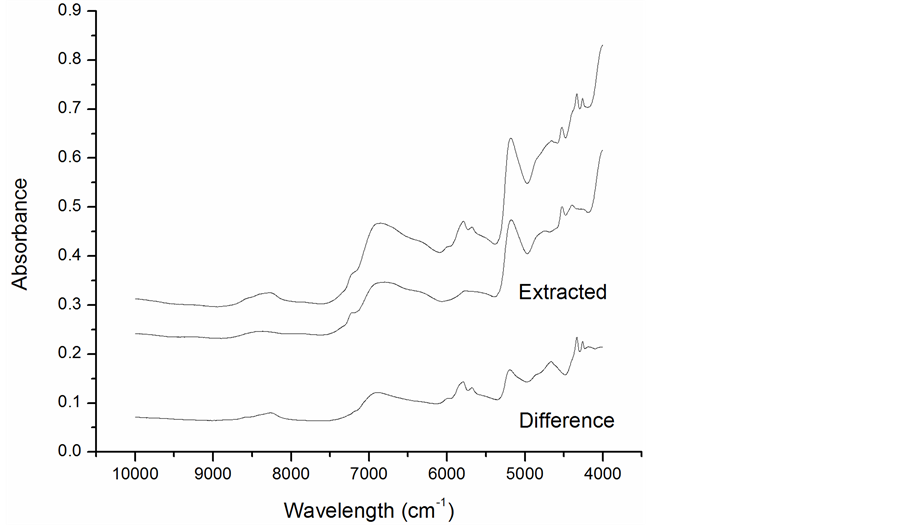
Figure 3. NIR spectra of skins before and after extraction.
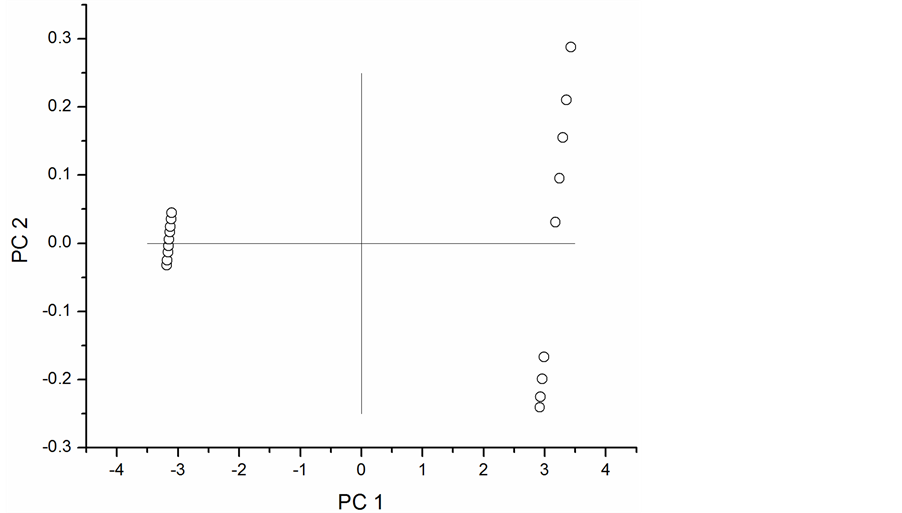
Figure 4. Scores plot for NIR spectra of peanut skins.
4. Conclusion
The application of NIR spectroscopy with principal component analysis provided an effective method to detect phenolic compounds and classify peanut skins based on reflectance measurements. For routine analysis the spectroscopic method provides a rapid non-destructive approach to analyze peanut skins without extraction and subsequent chromatography. These results are expected to facilitate the use of peanut skins in functional food and feed products.
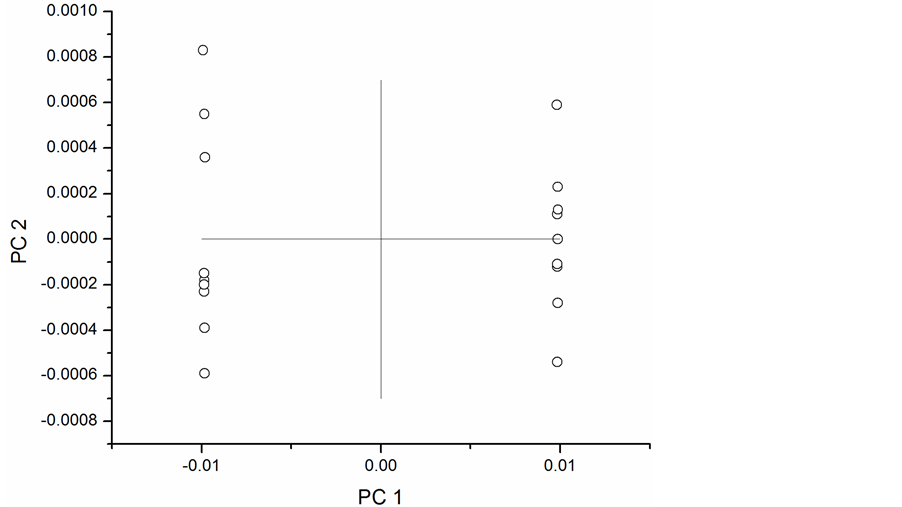
Figure 5. Scores plot for first derivative NIR spectra.
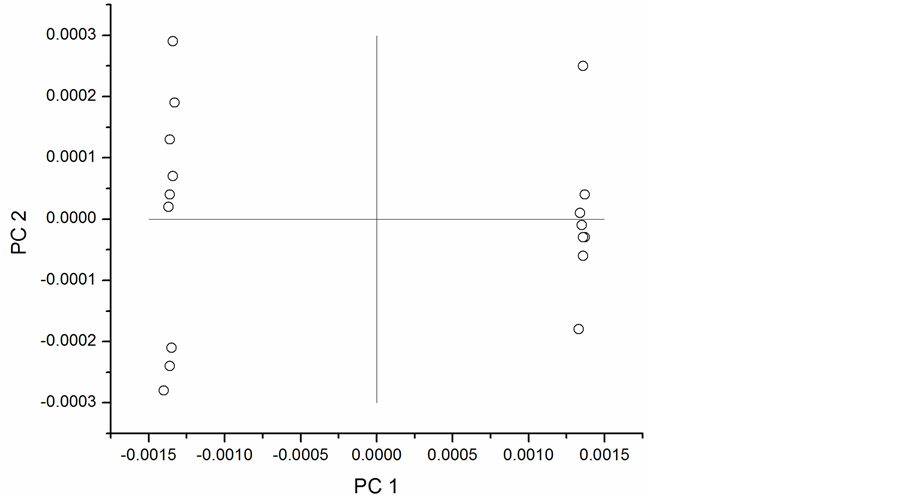
Figure 6. Scores plot for second derivative NIR spectra.
Acknowledgements
The author thanks H. Poco and C. Tobias for assistance in the preparation of this manuscript.
References
- United States Department of Agriculture (2012) Peanuts: Acreage Planted, Harvested, Yield, Production, and Value. http://www.ers.usda.gov/data/oil-crops-yearbook
- Sobolev, V.S. and Cole, R.J. (2003) Note on Utilisation of Peanut Seed Testa. Journal of the Science of Food and Agriculture, 84, 105-111. http://dx.doi.org/10.1002/jsfa.1593
- Lopes, R.M., Agostini-Costa, T., Gimenes, M.A. and Silveira, D. (2011) Chemical Composition and Biological Activities of Arachis Species. Journal of Agricultural and Food Chemistry, 59, 4321-4330. http://dx.doi.org/10.1021/jf104663z
- Baurhoo, B., Ruiz-Feria, C.A. and Zhao, X. (2008) Purified Lignin: Nutritional and Health Impacts on Farm AnimalsA Review. Animal Feed Science and Technology, 144, 175-184. http://dx.doi.org/10.1016/j.anifeedsci.2007.10.016
- Jenkins, K.J., Collins, F.W. and Hidiroglou, M. (1992) Research Note: Efficacy of Various Flavonoids and Simple Phenolics in Prevention of Nutritional Myopathy in the Chick. Poultry Science, 71, 1577-1580. http://dx.doi.org/10.3382/ps.0711577
- Zhang, D., Hu, H., Rao, Q. and Zhao, Z. (2011) Synergistic Effects and Physiological Responses of Selected Bacterial Isolates from Animal Feed to Four Natural Antimicrobials and Two Antibiotics. Foodborne Pathogens and Disease, 8, 1055-1062. http://dx.doi.org/10.1089/fpd.2010.0817
- Hoteling, H. (1933) Analysis of a Complex of Statistical Variables into Principal Components. Journal of Educational Psychology, 24, 417-441.
- Darton, R.A. (1980) Rotation in Factor Analysis. The Statistician, 29, 167-194. http://dx.doi.org/10.1089/fpd.2010.0817
- Insausti, M., Gomes, A.A., Cruz, F.V., Pistonesi, M.F., Araujo, M.C., Galvão, R.K., Pereira, C.F. and Band, B.S. (2012) Screening Analysis of Biodiesel Feedstock Using UV-vis, NIR and Synchronous Fluorescence Spectrometries and the Successive Projections Algorithm. Talanta, 97, 579-583. http://dx.doi.org/10.1016/j.talanta.2012.04.056