American Journal of Analytical Chemistry
Vol.5 No.2(2014), Article ID:42144,5 pages DOI:10.4236/ajac.2014.52010
Quantitative Determination of Nitidine from Roots and Plant Tissue Culture Extracts of Toddalia asiatica (Linn.) Using HPTLC
University College of Pharmaceutical Sciences, Kakatiya University, Warangal, India
Email: *ciddiveeresham@yahoo.co.in
Received November 16, 2013; revised December 19, 2013; accepted January 2, 2014
ABSTRACT
Toddalia asiatica Linn. is an important medicinal plant belonging to the family Rutaceae. The plant is well known for its antimalarial activity, which has been attributed to the presence of benzophenanthridine alkaloid nitidine in the roots of plants. A simple, rapid, sensitive, accurate, repeatable and robust HPTLC method has been developed and validated for the quantitative determination of nitidine in the dried roots and plant tissue culture extracts of T. asiatica. Nitidine was estimated at 332 nm by densitometry using Silica gel 60 F254 as stationary phase and chloroform:methanol (7:1, v/v), and as mobile phase. Linearity was observed in the concentration range of 25 - 200 ng/spot for nitidine. The limit of detection and limit of quantitation were found to be 0.026 and 0.086 ng/spot respectively for nitidine. Developed method was validated according to the ICH guidelines with respect to precision, accuracy, specificity and robustness. The technique has been applied for the first time for the estimation of nitidine in roots and plant tissue culture extracts of T. asiatica. Statistical analysis data indicate the accuracy and reliability of the method.
Keywords:Nitidine; HPTLC; Validation; Toddalia asiatica
1. Introduction
Toddalia asiatica Linn. (Rutaceae), commonly known as Lopez root, forest pepper and wild orange tree, is an important medicinal plant and has been used in folklore use in India and China from the 18th century. T. asiatica is used for the treatment of a range of diseases like cough, malaria, indigestion, influenza, lung diseases, rheumatism, fever, stomach ailments, cholera and diarrhoea. Fresh bark of root is used for hill fever. The root is chewed for tooth ache [1].
Various extracts of root bark were studied for in vitro antimalarial activity against Chloroquine-susceptible strains (K67, K39, M24, UPA, SL/D6, HB3 etc.) and Chloroquine-resistant strains (ItD12, FCR3, FCB etc.) of Plasmodium falciparum and compared with nitidine. It was found that the methanolic extract showed the highest activity and nitidine was more potent than methanolic extract [2-4]. Bioassay-directed fractionation of T. asiatica extract was studied and found that nitidine inhibited human lymphoblastoid cell killing by HIV-1 in vitro XTTbased anti-HIV assay [5,6]. Ethanolic extract of dried stem chips was studied for in vitro cytotoxicity on various cell lines using Fluorescence activated cell sorter analysis and measurement of Caspase-3 activity and found that dihydronitidine isolated from this extract had highly specific cytotoxicities to human lung carcinoma (A549) cells and induced specific apoptotic cell death by regulating the cell cycle related genes (CDK2; CCNE) [7].
Densitometric HPTLC is becoming a routine analytical technique and has been widely used for phytochemical evaluation of botanicals due to its simplicity. It involves the usage of minimum sample, low operating cost, need for minimum sample clean up, no prior treatment for solvents like filtration and degassing, and several samples can be analyzed simultaneously using a small quantity of mobile phase. Unlike other analytical methods, HPTLC produces complex information of visible chromatograms of entire samples at a glance. Multiple samples are seen simultaneously, so that reference and test samples can be compared for identification. Similarities and differences are immediately apparent with the help of the image comparison [8,9].
HPTLC method is used not only for quantification of phytochemicals [10,11] and qualitative analysis of plant extracts [12], but also for quality control of raw materials and standardization of polyherbal formulations [13,14]. Literature survey reveals that there are no reports on HPTLC determination of nitidine from the roots of T. asiatica. The present work illustrates the densitometric HPTLC method establishment and validation for quantitation of nitidine in roots and tissue culture extracts of T. asiatica.
2. Material and Methods
2.1. Instrumentation and Chromatographic Conditions
The method was developed on Camag HPTLC system consisting of Linomat V semi automatic applicator (Camag, Muttenz, Switzerland), Camag twin trough chamber (20 cm × 20 cm), Camag TLC scanner 3, equipped with win CATS software (version 1.4.3) and Camag syringe of 100 μL capacity. Separation and identification of nitidine were performed on aluminum backed silica gel 60 F254 TLC plates (10 cm × 10 cm, layer thickness 0.2 mm, E-Merck). The samples and the standards were applied on the plate as 8 mm wide bands with constant application rate of 150 nL∙s−1, with semi automatic applicator under a flow of nitrogen gas (N2), 8 mm from the bottom, 15 mm from the side, and the space between the two spots was 6 mm. Linear ascending development was carried out in Camag twin trough chamber. The chamber was presaturated with 32 ml of mobile phase chloroform: methanol (7:1, v/v) for 20 min at room temperature (25˚C ± 2˚C) before insertion of the plate into the mobile phase [15]. The development distance was 80 mm. After development the plates were dried. Densitometric scanning at 332 nm was selected, the absorption maximum of spot, performed with Camag TLC scanner 3 in reflectance-absorbance mode using a slit width dimension 6 mm × 0.3 mm, data resolution 100 mm∙step−1, scanning speed 20 mm∙sec−1 and baseline correction was used. The radiation source used was Deutrium lamp meeting a continuous radiation for UV-Visible region 190 - 800 nm. The method was validated according to the ICH guidelines [16,17].
2.2. Chemicals and Standards
Solvents chloroform, methanol and acetone were of analytical grade and purchased from Merck, India. Standard drug, nitidine was purchased from Biopurify Phytochemicals Ltd., China.
2.3. Plant Material
The roots of T. asiatica were collected from Tirupathi and were authenticated by Prof. V. Raju, Taxonomist, Department of Botany, Kakatiya University, Warangal, Andhra Pradesh, India.
2.4. Preparation of Standard Solution
Stock solution of standard nitidine 1 mg/ml was prepared by transferring 10 mg of nitidine accurately weighed into 10 ml volumetric flask and dissolving in 70% methanol. Further dilution was made from this stock solution in such a way to obtain concentration of 25 µg/ml by using 70% methanol and was used as working standard.
2.5. Sample Preparation
Roots of T. asiatica were powdered after shade drying and extracted (10 gm) with 20 ml of 70% methanol for 20 min by refluxing for 3 times. The combined extracts were concentrated to dryness under vacuum. Dried extracts were redissolved in 1 ml of 70% methanol to get stock solution.
Also the production of nitidine from callus and shoot cultures initiated from explants of T. asiatica was investigated by HPTLC analysis. Callus and shoot cultures were dried to get a constant weight and 1 gm was extracted as mentioned above for roots.
2.6. Validation of HPTLC Densitometry Method
Validation of the optimized HPTLC method was carried out with respect to the following parameters.
2.6.1. Linearity
From working standard solution of nitidine different volumes were loaded on to TLC plate using semi automatic applicator to obtain concentrations of 25, 50, 100, 200, 400 and 800 ng/spot. Each different concentration was applied 3 times on the plate. The plate was then developed using the mobile phase and the peak areas were plotted against the standard concentrations to obtain the calibration plot.
2.6.2. LOD and LOQ
The limits of detection (LOD) and quantification (LOQ) were calculated from the standard deviation and slope of the calibration curve.
2.6.3. Specificity
Specificity of the method was analyzed by comparing the standard and extract samples. The spot for nitidine in the sample was confirmed by comparing the Rf values and spectra of the sample spot with that of standard.
2.6.4. Precision
Precision of the method was verified in terms repeatability and intermediate precision. Repeatability (% RSD) was determined by analyzing nitidine standard solutions in the range (50 - 200 ng/spot) three times on the same day. Intermediate precision (% RSD) was assessed by analyzing these solutions (50 - 200 ng/spot) on three different days over a period of one week.
2.6.5. Accuracy
Accuracy of the method was established by performing recovery experiments using the standard addition method. To the pre analyzed samples of plant root extract, standard nitidine solution was added by spiking at three different levels (80%, 100% and 120%) and the mixture was analyzed by the proposed method.
Accuracy studies for the callus and shoot culture extract samples was carried out at 100% level.
2.6.6. Robustness
By introducing small changes in the mobile phase composition, mobile phase volume and duration of mobile phase saturation the effects on the results were examined. Robustness of the method was done in triplicate in a concentration level of 200 ng/spot and the % RSD of peak area was calculated.
3. Results and Discussion
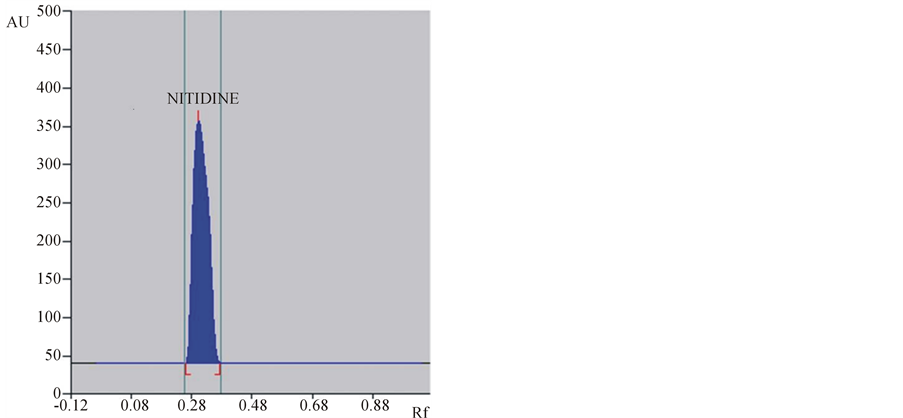
The mobile phase chloroform:methanol (7:1 v/v) gave good resolution for nitidine with a sharp and well defined peak at Rf = 0.28 when the chamber was saturated with mobile phase for 20 min at room temperature (25˚C ± 2˚C) during HPTLC determination of nitidine from plant root extract and tissue culture extracts. The plate was visualized under UV light at 332 nm without derivatization. Identity of nitidine bands in sample chromatograms was confirmed by the comparison of chromatogram and UV spectra obtained from the sample with that obtained from the standard solution (Figures 1 and 2) and also by comparing retention factor (Rf 0.28). The peak corresponding to nitidine from the sample solutions had the same retention factor as that of standard nitidine.
3.1. Linearity
Calibration plot shown in Figure 1 indicates the response
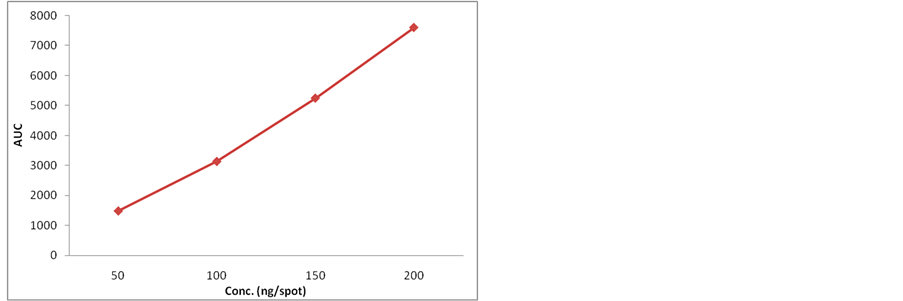
Figure 1. Calibration curve of standard nitidine.
 (a)
(a)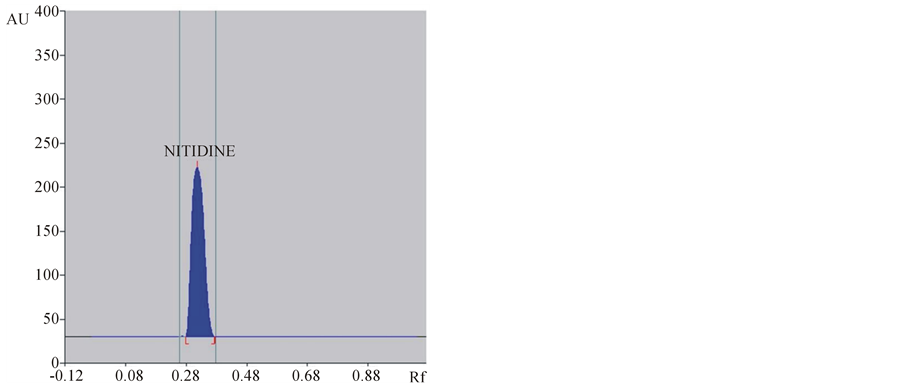 (b)
(b)
Figure 2. Typical HPTLC densitogram of nitidine in standard (a) and sample (b).
is a linear function of concentration in the range of 25 - 200 ng of nitidine. The correlation coefficient, intercept and the slope were 0.9949, 862.9 and 34.51 respectively (Table 1).
3.2. LOD and LOQ
Signal to noise ratios 3 and 10 were considered for LOD and LOQ respectively and calculated from the slop of the calibration plot and the standard deviation of the response. LOD and LOQ were found to be 0.026 and 0.086 ng/spot respectively for nitidine which ascertain the adequate sensitivity of the method (Table 1).
3.3. Precision
From the results of repeatability and intermediate precision studies experiments (Table 1) the developed method was found to be precise as % RSD values were found to be low (<2%).
3.4. Specificity
Specificity of the method was ascertained by comparing Rf values and the UV-Visible spectra (Figures 2 and 3) of samples with that of standard nitidine. No interference with peak of nitidine from other constituents of extracts was also observed indicating the specificity of the method.
3.5. Accuracy
The results of recovery studies of root extract and plant tissue cultures extracts are listed in Tables 2 and 3 respectively. The results were within acceptable limits demonstrating the accuracy of the method.
3.6. Robustness
The low values of the % RSD (less than 2%) indicated after introduction of small changes in mobile phase composition, mobile phase volume and duration of mobile phase saturation time indicated the robustness of the method (Table 4).

Table 1. Method validation data for HPTLC quantification of nitidine.
Table 2. Recovery studies of nitidine in root extract by HPTLC.
Table 3. Recovery studies of nitidine in plant tissue culture extracts by HPTLC.
Table 4. Robustness of the HPTLC method (n = 3).
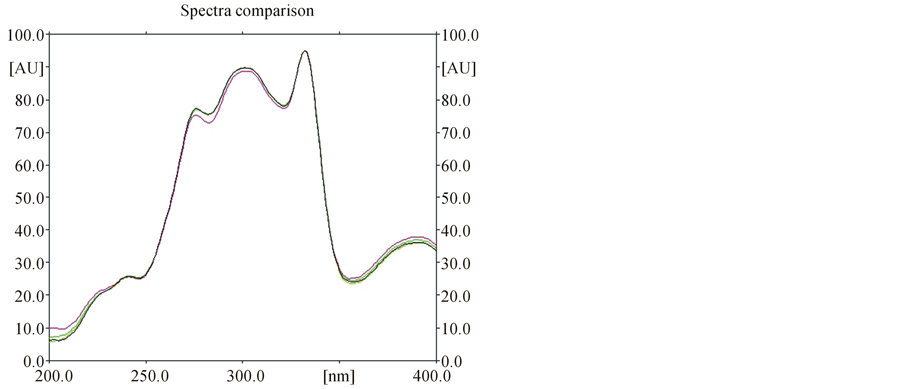
Figure 3. Superimposed spectra of nitidine in standard and samples.
4. Conclusion
A rapid, simple, accurate, specific and robust HPTLC method for the quantitative estimation of nitidine present in the roots of T. asiatica has been developed and validated. The developed method can be used as a tool for quality control of botanicals/herbal formulations.
Acknowledgements
C. Praveena is thankful to CSIR, HRDG, New Delhi for granting CSIR-SRF fellowship.
- [2] R. K. Molmoori, H. C. Rodda, K. Asres and C. Veeresham, “Toddalia asiatica (Linn.) Lam.—A Comprehensive Review,” Pharmacognosy Reviews, Vol. 2, No. 4, 2008, pp. 386-397.
- [3] D. M. N. Gakunju, E. K. Mberu, S. F. Dossaji, A. I. Gray, R. D. Waigh, P. G. Waterman and W. M. Watkins, “Potent Antimalarial Activity of the Alkaloid Nitidine, Isolated from a Kenyan Herbal Remedy,” Antimicrobial Agents and Chemotherapy, Vol. 39, No. 12, 1995, pp. 2606-2609. http://dx.doi.org/10.1128/AAC.39.12.2606
- [4] F. W. Muregi, A. Ishih, T. Miyase, T. Suzuki, H. Kino, T. Amanod, G. M. Mkoji and M. Terada, “Antimalarial Activity of Methanolic Extracts from Plants Used in Kenyan Ethnomedicine and Their Interactions with Chloroquine (CQ) against a CQ-Tolerant Rodent Parasite, in Mice,” Journal of Ethnopharmacology, Vol. 111, No. 1, 2007, pp. 190-195. http://dx.doi.org/10.1016/j.jep.2006.11.009
- [5] J. M. Nyangulu, S. L. Hargreaves, S. L. Sharples, S. P. Mackay, R. D. Waigh, O. Duval, E. K. Mberu and W. M. Watkins, “Antimalarial Benzo[c]phenanthridines,” Bioorganic and Medicinal Chemistry Letters, Vol. 15, No. 8, 2005, pp. 2007-2010. http://dx.doi.org/10.1016/j.bmcl.2005.02.074
- [6] M. A. Rashid, K. R. Gustafson, Y. Kashman, J. H. Cardellina II, J. B. Mc Mohan and M. R. Boyd, “Anti-HIV Alkaloids from Toddalia asiatica,” Natural Product Research, Vol. 6, No. 2, 1995, pp. 153-156.
- [7] V. K. Tandon and R. B. Chhor, “Current Status of AntiHIV Agents,” Current Medicinal Chemistry—Anti-Infective Agents, Vol. 4, No. 1, 2005, pp. 3-28. http://dx.doi.org/10.2174/1568012052931250
- [8] H. Iwasaki, H. Oku, R. Takara, H. Miyahira, K. Hanashiro, Y. Yoshida, et al., “The Tumor Specific Cytotoxicity of Dihydronitidine from Toddalia asiatica Lam.,” Cancer Chemotherapy Pharmacology, Vol. 58, No. 4, 2006, pp. 451-459. http://dx.doi.org/10.1007/s00280-005-0183-4
- [9] V. K. Singh and J. N. Govil, “Standardization of Herbal/ Ayurvedic Formulations: Recent Progress in Medicinal Plants,” 3rd Edition, Vol. 24, Stadium Press LLC, Houston, 2006, pp. 25-44.
- [10] H. C. Andola and V. K. Purohit, “High Performance Thin Layer Chromatography (HPTLC): A Modern Analytical Tool for Biological Analysis,” Nature and Science, Vol. 8, No. 10, 2010, pp. 58-61.
- [11] V. Sharma, A. P. Gupta, P. Bhandari, R. C. Gupta and B. Singh, “A Validated and Densitometric HPTLC Method for the Quantification of Withaferin-A and Withanolide-A in Different Plant Parts of Two Morphotypes of Withania somnifera,” Chromatographia, Vol. 66, No. 9-10, 2007, pp. 801-804. http://dx.doi.org/10.1365/s10337-007-0396-2
- [12] K. Ashraf, M. Mujeeb, A. Ahmad, M. Amir, Md. N. Mallick and D. Sharma, “Validated HPTLC Analysis Method for Quantification of Variability in Ccontent of Curcumin in Curcuma longa L (turmeric) Collected from Different Geographical Region of India,” Asian Pacific Journal of Tropical Biomedicine, Vol. 2, No. 2, 2012, pp. S588- S584. http://dx.doi.org/10.1016/S2221-1691(12)60278-0
- [13] P. Srivastava, N. Tiwari, A. K. Yadav, V. Kumar, K. Shanker, R. K. Verma, M. M. Gupta, A. K. Gupta and S. P. Khanuja, “Simultaneous Quantification of Withanolides in Withania somnifera by a Validated High-Performance Thin-Layer Chromatographic Method,” Journal of AOAC International, Vol. 91, No. 5, 2008, pp. 1154- 1161.
- [14] P. B. Shinde, P. D. Aragade, M. R. Agrawal, U. A. Deokate and S. S. Khadabadi, “Simultaneous Determination of Withanolide A and Bacoside A in Spansules by HighPerformance Thin-Layer Chromatography,” Indian Journal of Pharmaceutical Sciences, Vol. 73, No. 2, 2011, pp. 240-243. http://dx.doi.org/10.4103/0250-474X.91573
- [15] V. Y. Thakker, V. N. Shah, U. D. Shah and M. P. Suthar, “Simultaneous Estimation of Gallic Acid, Curcumin and Quercetin by HPTLC Method,” Journal of Advanced Pharmacy Education and Research, Vol. 1, 2011, pp. 70- 80.
- [16] R. K. Molmoori, H. C. Rodda and C. Veeresham, “Production of Nitidine from Callus Cultures of Toddalia asiatica,” International Journal of Pharmaceutical Sciences and Nanotechnology, Vol. 3, No. 2, 2010, pp. 1028-1033.
- [17] International Conference on Harmonization (ICH), “Validation of Analytical Procedures; Methodology,” Q2A, Geneva, 1994, pp. 1-5.
- [18] International Conference on Harmonization (ICH), “Validation of Analytical Procedures; Methodology,” Q2B, Geneva, 1996, pp. 3-9.
NOTES
*Corresponding author.