American Journal of Analytical Chemistry
Vol. 3 No. 1 (2012) , Article ID: 16810 , 5 pages DOI:10.4236/ajac.2012.31004
Near-Infrared Spectroscopic Analysis of Hemoglobin with Stability Based on Human Hemolysates Samples
Key Laboratory of Optoelectronic Information and Sensing Technologies of Guangdong Higher Educational Institutes, Jinan University, Guangzhou, China
Email: *tpan@jnu.edu.cn
Received November 22, 2011; revised December 25, 2011; accepted January 5, 2012
Keywords: Hemolysates; HGB; NIR Spectroscopy; PLS; Stability
ABSTRACT
Near-infrared (NIR) spectroscopy combined with the partial least-squares (PLS) regression was successfully applied for the rapid quantitative analysis of hemoglobin (HGB) based on human hemolysates samples. Based on the varied divisions for the calibration and prediction sets, an effective modeling approach using stable model parameters was proposed. Among 255 samples, 80 were randomly selected as the validation set. The remaining 175 samples were divided into the calibration set (110 samples) and the prediction set (65 samples) for a total of 30 times with certain similarities based on partial least squares cross-validation predictive basis (PLSPB). The optimal PLS factor was 8, the modeling effects M-SEPAve, M-RP,Ave, M-SEPStd and M-RP,Std were 3.84 g/L, 0.967, 0.16 g/L and 0.006, respectively, the validation effects V-SEP, V-RP and V-RSEP were 3.59 g/L, 0.980 and 2.7%, respectively. It indicated that the method has high prediction precision and well stability. The results show that NIR spectroscopy of hemolysates is accurate to HGB’s determination, and it is hopeful to be applied to clinic.
1. Introduction
Human hemoglobin (HGB) is an oxygen carrying protein in erythrocyte, and its concentration determination can be used to diagnose anemia and ferric nutritional condition, which is an important clinical biochemistry indication. Chemical free, rapid measurement for HGB based on the near-infrared (NIR) spectroscopy is significant research direction in recent years [1,2]. Since blood is a complex system with multiple components, NIR spectroscopy analysis of blood has to overcome the noise disturbance. HGB’s prediction accuracy with NIR spectroscopy has not yet reached the level of clinical application at present. Appropriate measurement mode and model stability are two important research directions need to be improved. This article focused on these two directions.
Because whole blood samples are very viscous, scattering and noise disturbance would occur when light through whole blood samples, thus the accuracy of spectral analysis decreases. Besides, HGB is in erythrocyte, its determination needs to overcome the noise of cell membrane. The erythrocyte would rupture when the whole blood samples are diluted with distilled water, hemolysates samples are obtained. Using NIR spectroscopy of hemolysates samples to measure HGB will potentially and hopefully improve the analysis precision of HGB, but this consideration has not been reported. This paper attempted using NIR spectroscopy of hemolysates to determinate HGB, and to establish the stable analytical model based on partial least squares (PLS) method.
For establishing stable and reliable NIR model, an objective and reasonable evaluation method is very important. In the current paper, a new modeling approach using stable model parameters is proposed based on varied partitioning of the calibration and prediction sets. In addition, to evaluate the model objectively and reasonably, a portion of the samples was randomly selected from all of the collected samples as the validation set; they were not involved in the modeling optimization process. All of the samples were divided into the modeling calibration set, modeling prediction set, and validation set. The modeling optimization and the first validation were performed in the first two sets, and the second validation for the selected model was performed in the third set. Given that the validation samples were not involved in the modeling optimization process, the obtained validation result was considered objective and reliable. Simultaneously, to avoid model evaluation distortion, the division for the calibration set and the prediction set was performed based on certain similarities.
2. Materials and Methods
2.1. Experimental Materials, Instruments and Measurement Methods
Two hundred and fifty-five samples of human whole blood were collected, and HGB’s concentrations of the samples were measured by routine clinical method with BC-3000Plus automatic blood cell analyzer (Shenzhen Mairui Company). The values obtained were used for the calibration and validation of NIR spectroscopic analysis. The HGB range in all of the samples was 78 g/L to 173 g/L. The mean values and the standard deviations were 133 and 16.1 g/L, respectively. Each whole blood sample was diluted to two times volume hemolysates with distilled water, which was used for spectrometry measurement.
The instrument used for the experiment was a FOSS XDS Rapid ContentTM Liquid Grating Spectrometer equipped with a transmission accessory and a 2 mm cuvette. The scanning scope of the spectrum was 400 nm to 2498 nm with a 2 nm wavelength interval, including a large part of the visible and overall NIR regions. Wavebands of 400 nm to 1100 nm and 1100 nm to 2498 nm were adopted for Si and PbS detection, respectively. Every sample was measured thrice and the mean value of the three measurements was used for modeling. The spectra were measured at 25˚C ± 1˚C and 46% ± 1% RH.
2.2. Model Evaluation Method and Sample Set Division
A portion of the samples was randomly selected from all of the samples as validation set, whereas the remaining samples were used as modeling set. To evaluate the model effectively and reasonably, the modeling set was divided into two similar sets, which were called the calibration set and the prediction set. Calibration and prediction of models were separately performed in the calibration and prediction sets, respectively. The root mean square error and the correlation coefficients of these two sets were calculated, including the modeling root mean square error of calibration, modeling correlation coefficients of calibration, modeling root mean square error of prediction, and modeling correlation coefficients of prediction, denoted as M-SEC, M-RC, M-SEP, and M-RP, respectively.
To consider the stability of model parameters, the modeling set was repeatedly divided into the calibration set and the prediction set for N times. For each division i, the corresponding M-SECi, M-RC,i, M-SEPi, and M-RP,i were first calculated. The mean value and the standard deviation of the prediction effects for all divisions (M-SEPAve, M-RP,Ave, M-SEPStd, M-RP,Std) were further calculated, serving as the basis for discussing the prediction accuracy and stability of the modeling. The model parameter (namely PLS factor) was selected according to the minimum M-SEPAve. Finally, the selected model was again validated in validation set, and the validation root mean square error of prediction and validation correlation coefficients of prediction were calculated and denoted by V-SEP and V-RP, respectively.
When the division for calibration set and prediction set is random, the modeling process may appear as distorted evaluation because of contingency. For example, a randomly generated calibration set is composed of samples with low HGB measured values whereas the prediction set is composed of samples with high HGB measured values. Improvement of the prediction effect under such conditions is difficult, often leading to incorrect models. In light of the above considerations, it is necessary that the modeling set is divided into the calibration set and the prediction set with certain similarity. In the current study, the similarity was defined based on the predictive bias of cross-validation for PLS model, so as to propose a new division method for calibration set and prediction set, as the follows.
The internal cross-validation of PLS model was finished firstly for all m modeling samples by using measured value and absorbance. The cross-validation used leave-one-out mode, this means to pull out one sample and established the calibration model for remaining m-1 samples, then predicted the pulled sample by using the obtained calibration model. For the same way, all of the modeling samples can be predicted. The predictive bias of every sample was calculated, which called partial least square cross-validation predictive bias denoted by PLSPB, the calculation formula was the follows,
where  and Ci were the NIR predicted value and the measured value of sample i. Measured value or absorbance was usually used to evaluate the similarity of samples. PLSPB was a combining indicator of measured value and absorbance, which used to evaluate the similarity here, specifically, when the mean value and the standard deviation of PLSPB of the calibration set were all close to those for the prediction set, the calibration and prediction sets were defined similar. According to this definition, using a computer program, all modeling samples were randomly divided into calibration and prediction sets for sufficient times (usually 105 times is sufficient). The mean value and standard deviation of PLSPB of the calibration, prediction and whole modeling sets were calculated and denoted by PLSPBC,Ave, PLSPBC,Std, PLSPBP,Ave, PLSPBP,Std, PLSPBAve, and PLSPBStd, respectively. The similarity degree is defined by the follows:
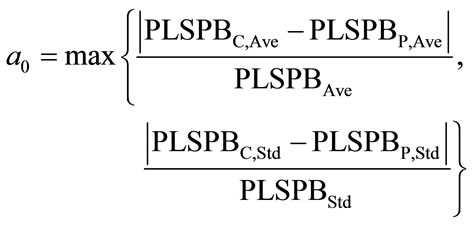
The value of a0 could be set according to the actual situation, the similarity is better when a0 is smaller. In the current paper, various divisions satisfying a0 < 0.1 were retained for modeling.
2.3. Stability of PLS Factor
PLS is an effective chemometrics method for spectral modeling [3-10]. The PLS factors (F) is a major parameter which corresponds to the number of spectral integrated variables on behalf of sample information. If F was set too small, the sample information in the spectra was unable to be fully reflected. If F was set too big, extra noises would be led into the model, the prediction ability would descend in both cases. Therefore, it was not only necessary but also difficult to select reasonable F. In this paper, F was selected by a new consideration, namely based on many divisions for calibration set and prediction set, thus the optimized PLS factor had stability and practicality.
3. Results and Discussion
The NIR spectra of the 255 hemolysates samples are shown in Figure 1. Eighty samples were randomly selected as the validation set and the remaining 175 samples were used as the modeling set. According to the method mentioned in the section 2.2, the internal crossvalidation of PLS model based on the whole spectral collecting region (400 - 2498 nm) was finished firstly in modeling set, and the PLSPB of all modeling samples were calculated. Based on the PLSPB, the modeling set was divided into similar calibration set (110 samples) and prediction set (65 samples) for a total of 30 times. F was set from 1 to 30. For each division, the external validation of PLS model was established respectively, and according to the minimum M-SEP, the optimal F was selected. Table 1 shows that the prediction effects and the optimal F corresponding to 30 divisions. It could be seen that the prediction effects SEP, RP and the optimal F were all fluctuated for different divisions.
For each F from 1 to 30, M-SEPAve, M-SEPStd, M-RP,Ave and M-RP,Std of all the 30 divisions were calculated by the method discussed in the previous section, respectively. The M-SEPAve and M-SEPStd corresponding to each PLS factor is shown in Figure 2. The M-RP,Ave and MRP,Std corresponding to each PLS factor is shown in Figure 3. As shown in Figures 2 and 3, when F is 8, MSEPAve, M-SEPStd and M-RP,Std all achieved minimum,
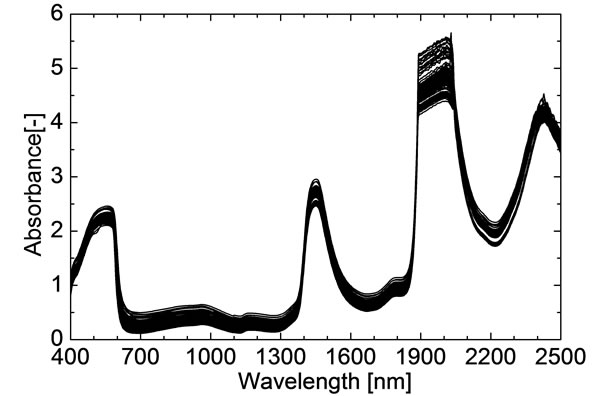
Figure 1. Near-infrared spectra of 255 hemolysates samples.
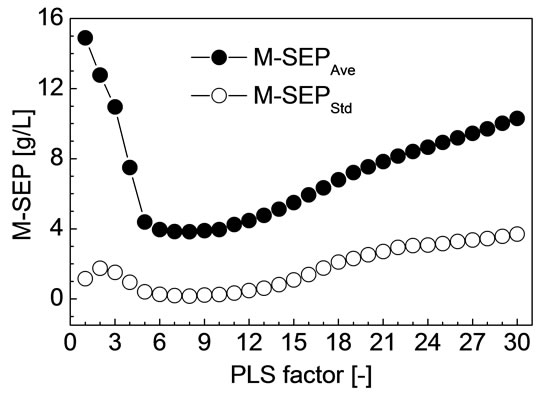
Figure 2. M-SEPAve and M-SEPStd corresponding to each PLS factor.
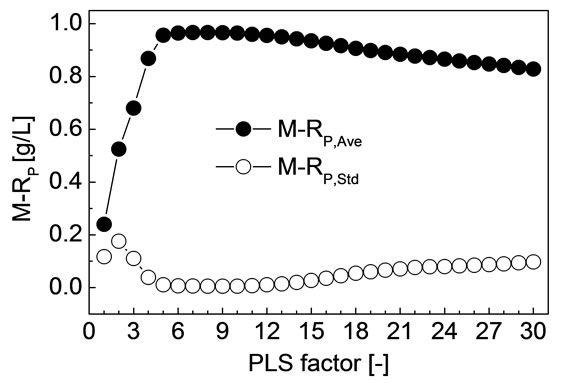
Figure 3. M-RP,Ave and M-RP,Std corresponding to each PLS factor.
and M-RP,Ave achieved maximum. Namely, M-SEP, MRP are not only the best but also the most stable when F is 8. The corresponding M-SEPAve, M-RP,Ave, M-SEPStd and M-RP,Std were 3.84 g/L, 0.967, 0.16 g/L and 0.006, respectively.
The optimized model was validated by the validation set. PLS regression coefficients corresponding to all of the wavelengths were first calculated using the data of modeling set when F was 8. Then, the predicted values of HGB in validation samples were calculated using the obtained PLS regression coefficients and the spectra of validation samples. The obtained V-SEP and V-RP were 3.59 g/L and 0.980, respectively. The relationship be-
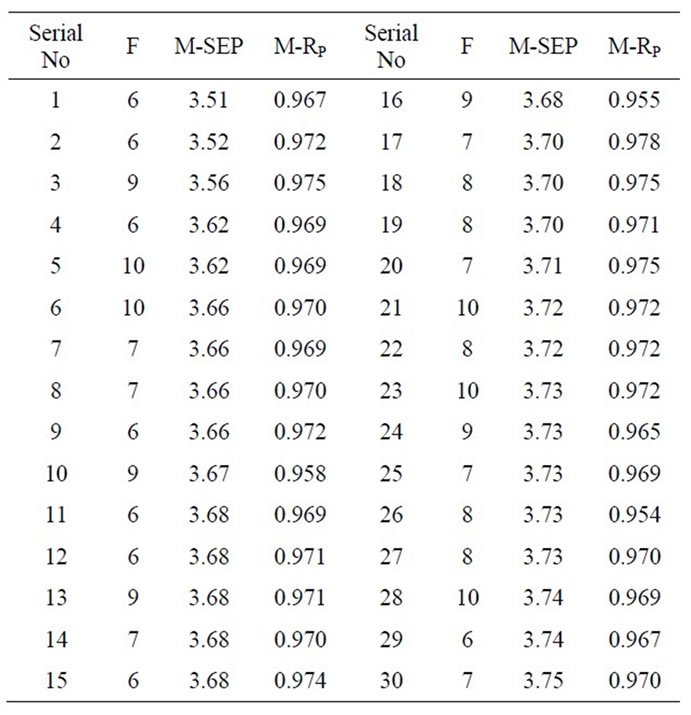
Table 1. Prediction effects and the optimal PLS factors corresponding to 30 divisions for calibration set and prediction set.
tween the NIR predicted value and the measured value of HGB in 80 validation samples are shown in Figure 4. The relative error between V-SEP and the average of measured values in validation samples was also calculated, which denoted by V-RSEP, and the obtained V-RSEP was only 2.7%. The results show that the optimized model has high prediction precision and well stability. Meanwhile, the prediction precision is obviously better than the previous papers based on the whole blood samples [1,2].
4. Conclusion
NIR spectroscopy combined with PLS regression was successfully applied for the rapid quantitative analysis of HGB based on human hemolysates samples. An appropriate model parameter with stability was selected through a rigorous modeling process. The optimal PLS factor was 8, the modeling effect M-SEPAve, M-RP,Ave, M-SEPStd and M-RP,Std were 3.84 g/L, 0.967, 0.16 g/L and 0.006, respectively, the validation effect V-SEP, V-RP and VRSEP were 3.59 g/L, 0.980% and 2.7%, respectively. It indicated that the method has high prediction precision and well stability. The results show that NIR spectroscopy of hemolysates is accurate to HGB’s determination, and it is hopeful to be applied to clinic. The division method for calibration and prediction sets with certain similarities prevented the evaluation distortion of the model and achieved excellent experimental effects. The optimized model was validated by samples that were not involved in the modeling optimization process to obtain
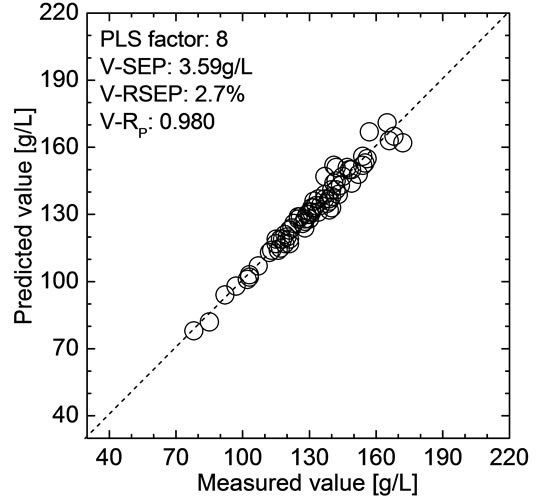
Figure 4. Comparison of the predictive value and the measured value for 80 validation samples.
objective and reliable evaluation. The methodological framework and computer algorithm platform proposed in the current paper are universal for spectroscopic calibration; they could be applied to other fields.
5. Acknowledgements
This work was supported by National Natural Science Foundation of China (No. 61078040), the Science and Technology Project of Guangdong Province (No. 2009B030801239 and No. 2009A030301002) and the Fundamental Research Funds for the Central Universities (No. 21611513).
REFERENCES
- V. N. Istvan, J. K. Karoly, J. M. Janos, G. Eva and D. Gyula, “Application of near Infrared Spectroscopy to the Determination of Haemoglobin,” Clinica Chimica Acta, Vol. 264, No. 1, 1997, pp. 117-125. doi:10.1016/S0009-8981(97)00085-5
- G. W. Yoon, S. W. Kim, Y. J. Kim, J. W. Kim and W. K. Kim, “Optimizations of Preprocessing and Wavelength Selection in Predicting Human Total Hemoglobin Concentrations Based on VIS/NIR Spectroscopy,” Proceeding of SPIE, Vol. 3257, No. 126, 1998, pp. 126-133. doi:10.1117/12.306078
- D. A. Burns and E. W. Ciurczak, “Handbook of Nearinfrared Analysis,” 2nd Edition, Marcel Dekker Inc., New York, 2001.
- H. W. Wang, “Partial Least Squares Regression Method and Application,” National Defense Industry Press, Beijing, 1999, pp. 97-99.
- M. J. Mcshane, “Assessment of Partial Least-squares Calibration and Wavelength Selection for Complex NearInfrared Spectra,” Applied Spectroscopy, Vol. 52, No. 6, 1998, pp. 878-884. doi:10.1366/0003702981944427
- H. Z. Chen, T. Pan, J. M. Chen and Q. P. Lu, “Waveband Selection for NIR Spectroscopy Analysis of Soil Organic Matter Based on SG Smoothing and MWPLS Methods,” Chemometrics and Intelligent Laboratory Systems, Vol. 107, No. 1, 2011, pp. 139-146. doi:10.1016/2011.02.008
- J. Xie, T. Pan, J. M. Chen, H. Z. Chen and X. H. Ren, “Joint Optimization of Savitzky-Golay Smoothing Models and Partial Least Squares Factors for Near-Infrared Spectroscopic Analysis of Serum Glucose,” Chinese Journal of Analytical Chemistry, Vol. 38, No. 3, 2010, pp. 342-346. doi:10.3724/1096.2010.00342
- P. Cao, T. Pan and X. D. Chen, “Choice of Wave Band in Design of Minitype Near-Infrared Corn Protein Content Analyzer,” Optics and Precision Engineering, Vol. 15, No. 12, 2007, pp. 1952-1958.
- F. R. Huang, T. Pan, G. L. Zhang, X. Z. Pan and D. F. Liu, “Rapid Measurement of Zinc Contents in Soils by Near-Infrared Diffuse Reflectance Spectroscopy,” Optics and Precision Engineering, Vol. 18, No. 3, 2010, pp. 586-592.
- H. Z. Chen, T. Pan and J. M. Chen, “Combination Optimization of Multiple Scatter Correction and SavitzkyGolay Smoothing Modes Applied to the Near Infrared Spectroscopy Analysis of Soil Organic Matter,” Computers & Applied Chemistry, Vol. 28, No. 5, 2011, pp. 518-522.
NOTES
*Corresponding author.