Open Journal of Air Pollution
Vol.1 No.2(2012), Article ID:22734,5 pages DOI:10.4236/ojap.2012.12005
Air Pollutant Emissions from Coal-Fired Power Plants
HAEPC Electric Power Research Institute, Zhengzhou, China
Email: lidongmei5456@126.com
Received July 3, 2012; revised August 10, 2012; accepted September 2, 2012
Keywords: Air Pollutant Emissions; Flue Gas Desulfurization (FGD); Flue Gas Denitrition; Total Sulfur; Ash Content
ABSTRACT
In order to investigate the factual air pollutant emissions from Henan’s power sector in 2010, SO2, NOx and PM emissions from 24 generating sets from 15 coal-fired power plants have been measured. It is shown that SO2 emission values from 22 of 24 generating sets conform to the requirements, which is causing by the high performance of the flue gas desulfurization system. Much higher NOx emissions indicate that the construction of flue gas denitrition systems is necessary. PM emissions varied from 2.3 kg to 299.9 kg per hour. Total sulfur, moisture, ash and volatile content, and net caloric value of coals were investigated to elucidate the relationship between coals and air pollutant emissions.
1. Introduction
In recent years, the energy demand has rapidly increased, like thermal power, iron & steel, building materials, etc., so the coal consumption has increased, so do air pollutant emissions (SO2, NOx and PM). Aside from the documented effects on human health [1], the high concentrations of acid gases emissions can lead to the acidic deposition, haze, stunted plant growth, species decline, and corrosion of the national heritage, in other words, damage to concrete and limestone buildings, statues, monuments, and other historic structures [2,3]. While particulate matters (PM10 and PM2.5), are inhalable and can penetrate deeply into the cardiovascular system, thus causing most types of respiratory illness, heart disease and strokes [4].
Coal-fired power plant has been considered as a very important source of regional air pollution and ecosystem acidification, due to its huge emissions of acidic pollutants. For power sector developed fast in the past 20 years in China, SO2, NOx and PM emissions of coal-fired power plants increased by 1.5, 1.7 and 1.2 times, respectively. The SO2 emission of coal fired power sector was estimated to be 11,801 kt in 2010. The NOx emission would increase from 6965 kt in 2005 to 9680 kt in 2010. The TSP, PM10, and PM2.5 emissions would be 2540, 1824 and 1090 kt in 2010 respectively [5]. With increasing environmental pressure, Chinese government has made the decision that coal-fired power sector would be the most important source of regional atmospheric emission abatement in the near future, and power plants are thus anticipated to face more stringent environmental regulations related to siting and operation.
Not only China government takes strict measure to control power plant’s air pollutants emissions and pay attention to the monitoring and management of thermal generator sets [6], so as to prevent air pollution, but also several mitigation technologies are adopted to reduce the values. The most pronounced technologies are filtering stack emissions using various industrial dust collectors, flue gas desulfurization (FGD) and denitrition systems [7-9]. Henan Province with one of the largest coal consumption is also one of the largest air pollutant emission area in China. To supply a clear emission picture of power sector, since 2005, Henan had shut down 9.78 million kW of small thermal power units, and by the end of 2008, all of its coal-fired power units had been equipped with desulfurization facilities, being able to reduce SO2 by 930,000 t. In order to investigate the factual air pollutant emissions from Henan’s power sector in 2010 and the efficiency of FGD systems, measurements have been carried out on 24 generating sets from 15 coal-fired power plants. Total sulfur, moisture, ash and volatile content, and net caloric value of coals were investigated to elucidate the relationship between coals and air pollutant emissions.
2. Materials and Methods
2.1. Apparatus
A sulfur analyzer (LECO, S-144DR) was used for the measurement of total sulfur in the coal. An automatic calorimeter (SDACM-3000) was applied for the measurement of net calorific value at constant volume of the coal. A gas conditioning unit (Kane, KM 9008) was used, in case the build-up of water in the water trap for the long period continuous monitoring. A portable multi-gas analyzer (Kane, KM 9106) was used to monitor the gas [10]. The stainless steel sample probe of sufficient length to traverse the sample points, and teflon sample line linked the probe with analyzer were used for sampling. After last sampling, the analyzer pumps fresh air into the sensors to allow toxic sensors to be set to zero and the Oxygen sensor to be set to 20.9%. And before sampling, a calibration was performed with the standard gas at known concentrations. A smoke and dust (gas) automatic tester (LY30121H) was applied for moisture detection. Microstructures of PM were observed through a stereo microscope (OLYMPUS SXZ16).
2.2. Sampling Site and Sampling Points
Sampling site and sampling points are based on the Chinese Standard [11]. The concentration of SO2 was measured at the input and output of the flue gas desulfurization (FGD) system during the experimental period, as shown in Figure 1. Sampling is performed at a site located at least eight stack or duct diameters downstream and two diameters upstream from any flow disturbance such as a bend, expansion, or contraction in the stack, or from a visible flame. And the situation of traverse points being too close to the stack walls is not employed. As all the stacks in our experiment are rectangular stacks, to determine the number of traverse points shall first divide the stack cross-section into as many equal rectangular elemental areas as traverse points, and then locate a traverse point at the centroid of each equal area according to the example.
2.3. Sampling and Moisture Correction
Position the probe at the first sampling point. Purge the system for at least two times the response time before recording any data. Then, traverse all required sampling points, sampling at each point for an equal length of time and maintaining the appropriate sample flow rate. At least one valid data point per minute during the test run shall be recorded.

Figure 1. Showing sampling site: (1) Input and (2) output of FGD system.
During the experiment, we shall determine the moisture content of the flue gas and correct the measured gas concentrations to a dry basis according to the Section 5.2.2.3 in the Chinese Standard GB/T 16157-1996. And the dry basis results can be deduced by following equation:
CD = CW/(1-BWS);
BWS = Moisture content of sample gas;
CD = Pollutant concentration adjusted to dry conditions, mg/m3;
CW = Pollutant concentration measured under moist sample conditions, wet basis, mg/m3.
3. Results and Discussion
3.1. Characteristic of Coals
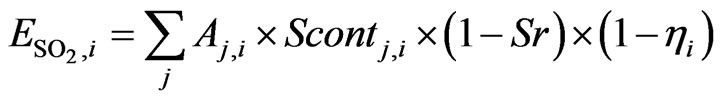
As well as known, annual emission of each unit can be calculated based on unit-specific fuel consumption and emission factor. Emissions of SO2, NOx and PM from power plants at province level were calculated using Equations (1)-(3) respectively [5,12].
 (1)
(1)
 (2)
(2)
 (3)
(3)
where subscripts i, j, k, m, n, and y stand for province, power unit, boiler type, fuel type, emission control technology and particulate size; EF is the emission factor; A is the coal consumption; C is the application rate of emission control technology; h is the removal efficiency of emission control technology; Scont is the sulfur content of fuel; Sr is the sulfur retention in ash; AC is the ash content of fuel; ar is the ratio of bottom ash; and f is the particulate mass fraction by size.
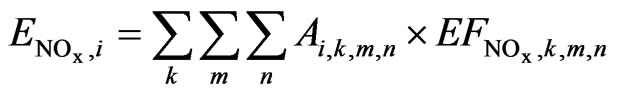
During the experimental period, coals used for each generating set were systematically analyzed. Total sulfur [13], moisture, ash and volatile content [14], and net caloric value [15] are important coal quality parameters. These parameters are summarized in Table 1 and Figure 2. As shown in Equation (1), the sulfur content (Scont) of fuel is the key factor influencing SO2 emissions. In Table 1 and Figure 2, all the Scont values are below 2.0, except those of I plant. Too high Scont shall lead to high concentration of SO2 in raw gas, which may be beyond the capacity of FGD and causing the high SO2 emissions. It is corroborated by the high SO2 emission from I plant (vide infra). According to Equation (2), fuel types (m) influence the NOx emissions profoundly, but in the coalfired power plants, the coal quality parameters shall take the charge. As we all know that high moisture, low volatile contents and caloric values will have a negative
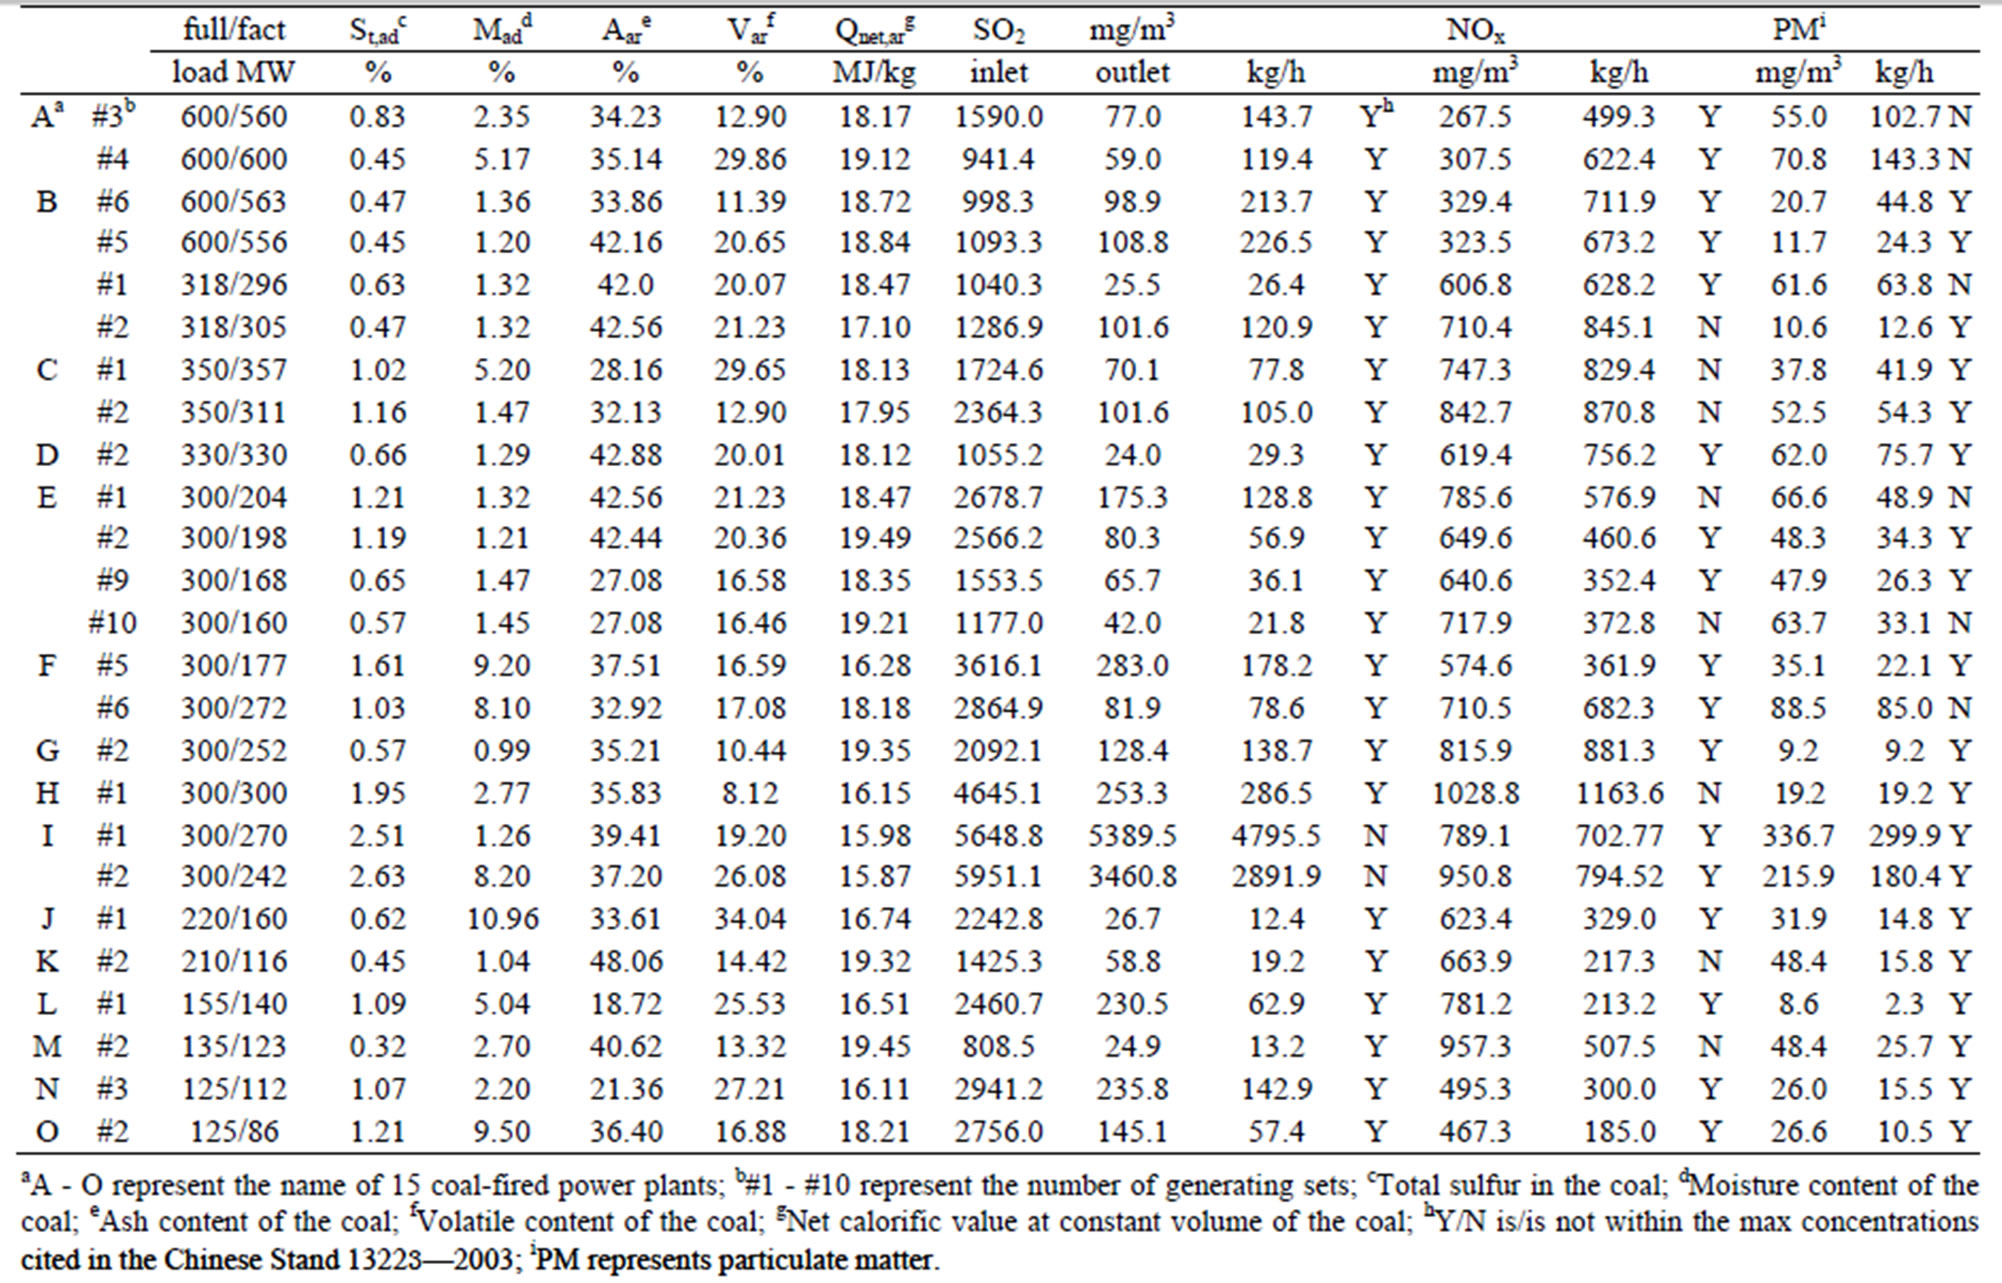
Table 1. Parameters for coals, SO2, NOx and particles emissions from 15 coal-fired power plants.
Figure 2. Total sulfur, ash and volatile contents of coals. ,
,  ,
,  ,
,  represent: Sulfur content: <0.5, 0.5 - 1.0, 1.0 - 2.0, >2.0; ash content: 10 - 20, 20 - 30, 30 - 40, 40 - 50; volatile content: <10, 10 - 20, 20 - 30, >30.
influence on the burning of coals, thus giving rise to the increased NOx emissions. As shown in Table 1, the highest moisture content is 10.96%, and others are below 10%. Only one volatile content value of coal from H plant is 8.12%, while other data are more than 10%. All the caloric values are in the region of 10 - 20 MJ/kg. These parameters are considered to be reasonable. 18 of 25 coals have larger ash content values than 30%. While it is deduced by Equation (3) that the high ash content of coal shall be a reason for the comparatively high PM emission.
3.2. SO2 Emissions
All the power plants have been equipped with the limestone-gypsum wet flue gas desulfurization (WFGD) system without a gas-gas heater (GGH), except that semidry and dry circulating fluidized beds were adopted in L and M power plants, respectively. SO2, NOx and PM emissions are shown in Table 1 and Figure 3. It is shown that 24 generating sets can generate from 125 MW to 600 MW of electricity at their full load. But it is only achieved from 86 MW to 563 MW under experimental conditions. The SO2 inlet concentrations show positive dependence on the Scont values, according to Equation (1) and Figure 3 (top). The lowest SO2 inlet concentration of 808.5 mg/m3 is obtained by the use of lowest sulfur coal with St,ad of 0.32%. Three highest SO2 inlet concentrations of 4645.1, 5648.8 and 5951.1 mg/m3 are relating to the highest Scont of 1.95%, 2.51% and 2.60%. The SO2 outlet concentrations are positive dependence not only on the Scont values but also on the removal efficiency of FGD (Equation 1). The lowest SO2 outlet concentration is 24.0 mg/m3 from D power plants, which is much lower than the specified value of 600 mg/m3 in the Chinese Standard GB/T 13223-2003. While two highest SO2 outlet concentrations of 5389.5 and 3460.8 mg/m3 are partially because of the burning of high sulfur coalthus leading to a large amount of raw gas with high SO2 concentration, which is far beyond the capacity of FGD. Another reason is that two slurry pumps in FGD system of I plant were breakdown, which shall cause the decrease of desulfurization efficiency. All the SO2 outlet concentrations do conform to the requirements [6] and all the efficiency of FGD are >90%, except those from 2 generating sets in I power plant. The SO2 emissions varied from 12.4 kg to 4795.5 kg per hour. It is concluded that the successful operation of various FGD technologies play important roles in the decrease of SO2 emissions from power plants.
3.3. NOx Emissions
In Table 1 and Figure 3 (bottom), the lowest NOx outlet concentration is 267.5 mg/m3 from A power plants. The highest NOx outlet concentration is 1028.8 mg/m3 from H power plant, which is partially caused by the use of lowest volatile content and lower caloric values of the coals. The NOx outlet concentrations are much higher than those of SO2, for the FGD system is not designed for the absorption of NOx. 8 generator sets from 6 power plants exhibit higher NOx concentrations than the exact value in the Standard6, and than the pass ratio is only 67%. The NOx emissions varied from 185.0 kg to 1163.6 kg per hour. According to Equation (2), not only the fuel type but also the emission control technology and emission factor of NOx influence the final NOx emission profoundly. Consequently, it is necessary for all the coal fired power plants in Henan with the construction of flue gas denitrition systems, which is in responsible for the removal of NOx in the flue gas. And it is appreciated that the first selective catalytic reduction (SCR) system has been built up in Xuchang Longgang thermal power plant at the end of 2010.
3.4. Particulate Matter (PM)
Although the lowest PM outlet concentration of 8.6 mg/ m3 is partially resulting from the use of the lowest ash content of coal, no evidence proving that the PM outlet concentration shows direct dependence on the ash content (Figure 3, bottom), which is not agreement with the Equation (3). For example, the highest ash content of 48.06% is from K plant, while the highest PM emission is from I plant. It is mainly because that the type and removal efficiency of dust collector are very different, thus leading to different n and h in the Equation (3). Because different standards were specified for power plants built in different periods, the highest value of 336.7 mg/m3 from M power plant falls within the emission limit. The PM emissions varied from 2.3 kg to 299.9 kg per hour. 6 generator sets from 4 power plants are higher than the prescribed value6, so the pass rate is 75%. It is concluded that PM emissions from all the power plants are not much higher than 50 mg/m3, except I plant. Consequently, a decrease of PM emissions can be easily obtained by using of lower ash content of coals and improving efficiency of dust collectors. Finally, micro-structures of PM show that most parts are gray microcrystals, and a few of black dots are also found among the microcrystals (Figure 4). It is known that PMs are resulting from coal ashes, so gray microcrystals shall be mainly Al2O3 and SiO2, and black dots may probably be Fe2O3.
4. Conclusion
Air pollutants emissions from 24 generating sets from 15 coal-fired power plants in Henan were investigated. Comparatively low SO2 emission and high pass ratio show that various FGD systems are effective for the removal of SO2 in power plants. The relative high NOx emission and
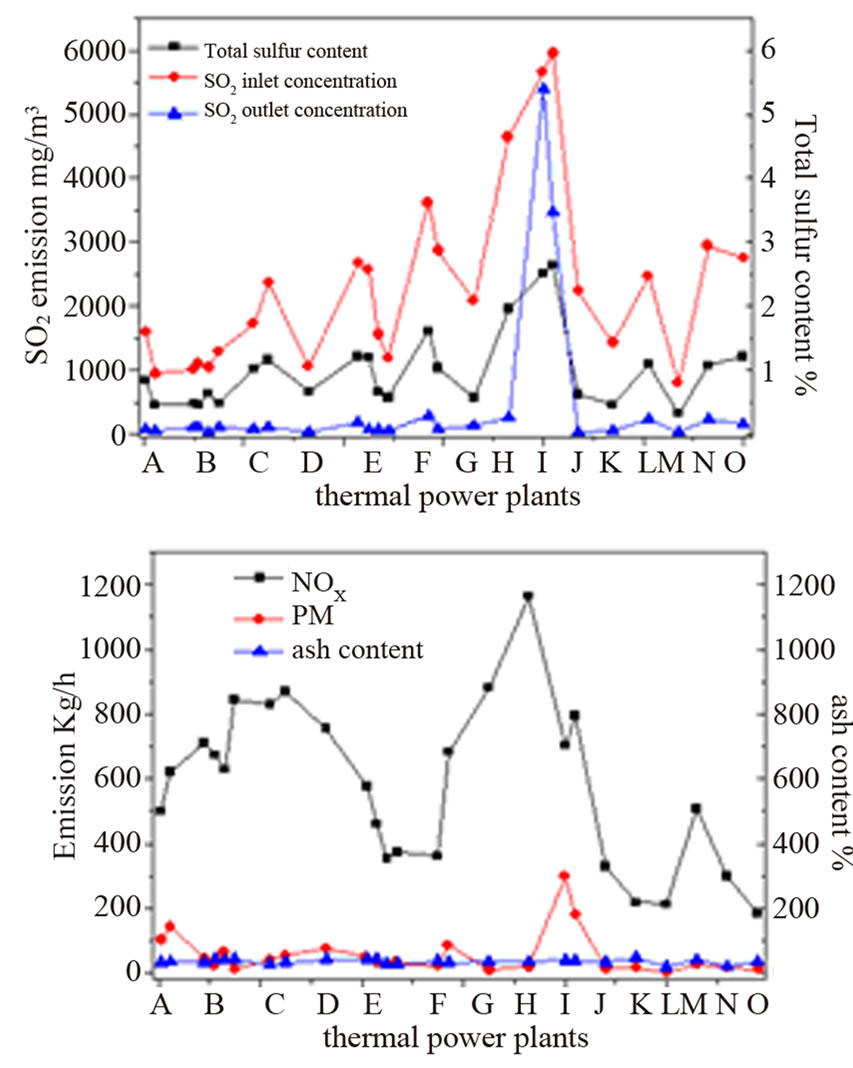
Figure 3. (Top) SO2 inlet and outlet concentrations, total sulfur content of coals; (Bottom) NOx and PM emissions and ash content of coals of all the coal-fired power plants.

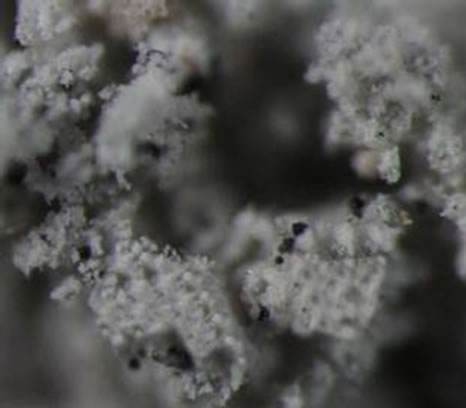
Figure 4. Gray microcrystals (left) and black dots (right) of PM observed through a stereo microscope.
low pass ratio indicate the build up of flue gas denitrition systems is necessary for the removal of NOx. To control air pollutant emissions, the following factors shall draw more attention: The using of high quality of coals with low sulfur sulfur, moisture, and ash content, high volatile content and high net caloric value; fine operation of FGD, and the increased efficiency of dust collectors.
REFERENCES
- C. Schlatter, “Environmental Pollution and Human Health,” Science of the Total Environment, Vol. 143, No. 1, 2003, pp. 93-101. doi:10.1016/0048-9697(94)90535-5
- G. P. Ayers and K. K. Yeung, “Acid Deposition in Hong Kong,” Atmospheric Environment, Vol. 30, No. 10-11, 1996, pp. 1581-1587. doi:10.1016/1352-2310(95)00454-8
- R. A. Parnell Jr. and K. J. Burke, “Impacts of Acid Emissions from Nevado del Ruiz Volcano, Colombia, on Selected Terrestrial and Aquatic Ecosystems,” Journal of Volcanology and Geothermal Research, Vol. 42, No. 1-2, 1990, pp. 69-88. doi:10.1016/0377-0273(90)90070-V
- C. A. Pope, M. J. Thun, M. M. Namboodiri, D. W. Dockery, J. S. Evans, F. E. Speizer and C. W. Heath, “Particulate Air-Pollutions as a Predictor of Mortality in a Prospective-Study of US Adults,” American Journal of Respiratory and Critical Care Medicine, Vol. 151, No. 3, 1995, pp. 669-674.
- Y. Zhao, S. Wang, L. Duan, Y. Lei, P. Cao and J. Hao, “Primary Air Pollutant Emissions of Coal-Fired Power Plants in China: Current Status and Future Prediction,” Atmospheric Environment, Vol. 42, No. 36, 2008, pp. 8442- 8452. doi:10.1016/j.atmosenv.2008.08.021
- GB/T 13223-2003, “Emission Standard of Air Pollutants for Coal-Fired Power Plants,” Ministry of Environmental Protection of the People’s Republic of China, 2003.
- S. M. E. Haque, M. G. Rasul, A. V. Deev, M. M. K. Khan and N. Subaschandar, “Flow Simulation in an Electrostatic Precipitator of a Thermal Power Plant,” Applied Thermal Engineering, Vol. 29, No. 10, 2009, pp. 2037- 2042.
- B. Dou, Y. C. Byun and J. Hwang, “Flue Gas Desulfurization with an Electrostatic Spraying Absorber,” Energy & Fuels, Vol. 22, No. 2, 2008, pp. 1041-1045. doi:10.1021/ef700646c
- A. L. V. Perales, P. Ollero, F. J. G. Ortiz and A. GómezBarea, “Model Predictive Control of a Wet Limestone Flue Gas Desulfurization Pilot Plant,” Industrial & Engineering Chemistry Research, Vol. 48, No. 11, 2009, pp. 5399-5405. doi:10.1021/ie801530x
- J. Rau, J. Chen, M. Lin and M. Wey, “Removal the Coal Ash, NO, and SO2 Simultaneously by the Fluidized-Bed Catalyst Reactor,” Energy & Fuels, Vol. 24, No. 3, 2010, pp. 1711-1719. doi:10.1021/ef9012467
- GB/T 16157-1996, “Determination of Particulates and Sampling Methods of Gaseous Pollutants Emitted from Exhaust Gas of Stationary Source,” Ministry of Environmental Protection of the People’s Republic of China, 1996.
- S. Wang, M. Zhao, J. Xing, Y. Wu, Y. Zhou, Y. Lei, K. He, L. Fu and J. Hao, “Quantifying the Air Pollutants Emission Reduction during the 2008 Olympic Games in Beijing,” Environmental Science & Technology, Vol. 44, No. 7, 2010, pp. 2490-2496. doi:10.1021/es9028167
- ASTM D 4239-2008, “Standard Test Methods for Sulfur in the Analysis Sample of Coal and Coke Using HighTemperature Tube Furnace Combustion Methods,” American Society for Testing Materials, 2008.
- GB/T 212-2008, “Proximate Analysis of Coal,” China National Coal Standardization Technology Committee, 2008.
- GB/T 213-2008, “Determination of Calorific Value of Coal,” China National Coal Standardization Technology Committee, 2008.