Open Journal of Medical Imaging
Vol.2 No.4(2012), Article ID:25786,27 pages DOI:10.4236/ojmi.2012.24025
Diffusion Tensor Imaging and Its Application to Traumatic Brain Injury: Basic Principles and Recent Advances
1Traumatic Brain Injury Image Analysis Lab, Henry Jackson Foundation for the Advancement of Military Medicine, Rockville, USA
2National Intrepid Center of Excellence, Bethesda, USA
3National Capital Neuroimaging Consortium, Walter Reed National Military Medical Center, Bethesda, USA
4Center for Neuroscience and Regenerative Medicine, Uniformed Services University of the Health Sciences, Bethesda, USA
Email: *pinghongyeh@gmail.com
Received August 27, 2012; revised October 3, 2012; accepted October 14, 2012
Keywords: Brain Network; Connectivity; High Angular Resolution Diffusion Imaging (HARDI); Diffusion Tensor Imaging (DTI); Neurocircuitry; Neuroimaging; Traumatic Axonal Injury (TAI); Traumatic Brain Injury (TBI); Tractography; White Matter
ABSTRACT
Traumatic axonal injury is a progressive process evoked by shear forces on the brain, gradually evolving from focal axonal alteration and cumulating in neural disconnection. Clinical classifiers and conventional neuroimaging are limited in traumatic axonal injury detection, outcome prediction, and treatment guidance. Diffusion weighted imaging is an advanced magnetic resonance imaging (MRI) technique that is sensitive to the movement of water molecules, providing additional information on the micro-structural arrangement of tissue. Quantitative analysis of diffusion metrics can aid in the localization of axonal injury and/or de(dys)myelination caused by trauma. Diffusion MRI tractography is an extension of diffusion weighted imaging, and can provide additional information about white matter pathways and the integrity of brain neural networks. Both techniques are able to detect the early micro-structural changes caused by Traumatic Brain Injury (TBI), and can be used to increase understanding of the mechanisms of brain plasticity in recovery after brain injury and possibly optimize treatment planning of patients with Traumatic Brain Injury. This review focuses on the theoretical basis and applied advanced techniques of diffusion weighted imaging, their limitations and applications, and future directions in the application to TBI.
1. Introduction
Diffusion Weighted Magnetic Resonance Imaging (DWMRI) measures the diffusion behavior of water molecules and is sensitive to differences related to the microstructure of brain nerve tissues. Diffusion tensor imaging (DTI) yields estimates of the index of white matter integrity and can be further used to extract white matter features for visualization, i.e. tractography. We summarize the current techniques applied to DTI acquisition and reconstruction, and discuss their applications for the diagnosis of traumatic brain injury (TBI). Section 1 of this review discusses the conceptual overview of apparent diffusion coefficient (ADC) modeling of DW-MRI and its role in detecting traumatic axonal injury (TAI) of TBI. Section 2 reviews the commonly used DW-MRI sequences and their acquisition parameters. Section 3 describes the principles of DTI and tractography and discusses post-processing and structural features extracted from the DTI. Section 4 outlines the key methods of advanced DW-MRI for modeling and resolving multiple fibers. The limitations of DTI, and the advanced DTI techniques are briefly discussed. Section 5 summarizes the DTI findings of TBI and demonstrates DTI applications in revealing disrupted white matter pathways and visualizing fiber “breaks”, and their combination with other new imaging technology. Section 6 briefly outlines the future directions using DTI for TBI study.
In summary, this review presents the theoretical background of DTI techniques and demonstrates their potentials for the early diagnosis of TAI and the understanding of pathogenesis of TBI. Readers who are interested in the DTI applications in TBI may skip the technical Sections 2-4 and only focus on Sections 1, 5-6.
1.1. Challenges of Detecting Mild TBI Brain Lesions and Predicting the Outcomes of TAI
In the civilian population the majority of TBI incidents are due to primarily in automobile accidents and falls. Sports-related TBI, particularly in football and boxing, has been in the media spotlight recently. Furthermore, TBI accounts for the majority of explosive blast injury and combat causalities in Operation Enduring Freedom (OEF) in Afghanistan and Operation Iraqi Freedom (OIF) [1], which has led to the well-publicized view that blastinduced TBI (bTBI) is the signature brain injury for combat troops in today’s military.
Clinically, TBI can be classified according to the types of injury, i.e. closed (blunt) vs open (penetrating), blast vs nonblast; the impact of injury on brain, i.e. primary (direct injury to the brain at the time of trauma) vs secondary (indirect injury, such as increased intracranial pressure and brain herniation as a result of primary impact); and the severity of brain trauma, i.e. mild, moderate, severe. However, bTBI is grouped by injuries resulting from the different physical aspects of the blast phenomenon; in short, primary bTBI is from the shockwave, secondary bTBI is from shrapnel, tertiary bTBI is from the blast wind, and quaternary covers the remaining mitigating factors [2]. Moreover, it is becoming apparent that there may be differences in disease progression and symptomatology [3] between impactand blast-related TBI [4]. However, their underlying mechanisms are not clear.
The neuroimaging appearance of TBI typically is represented by petechial hemorrhage and small, speckled lesions from traumatic microbleeds of shearing capillaries along with clinical indications, for instance, loss of consciousness [5]. Mild and moderate TBI patients with closed head blast injury could have extensive non-hemorrhagic foci at the time of primary impact, but there may be no observable abnormalities using computed tomography (CT) or only subtle changes on conventional MRI [6,7]. However, these patients may later develop neurocognitive deficits and neuropsychiatric problems such as memory loss, concentration difficulties, deceased attention span, headache and seizure in chronic phase of TBI [8,9]. Traumatic axonal injury (TAI) is considered to be responsible for the majority of TBI-related neurocognitive deficits [10-12], and is likely related to poor outcome in mild TBI [13].
1.2. Neuroimaging Findings of TAI
TAI occurs in about half of the severe TBI cases [14] and about one-third of the chronic mild TBI cases in professional unarmed combatants (boxers, martial arts, etc.) [15]. TAI refers to white matter damage arising from the consequence of shearing force caused by sudden rotational acceleration/deceleration force of head injury [16,17]. The change of brain shape with preservation of brain volume causes shear-strain deformation resulting in multi-focal scattered lesions (micro-bleeds), commonly seen in cerebral gray-white matter junction, deep subcortical WM, centrum semiovale, corpus callosum, the dorsolateral aspect of the upper brain stem, basal ganglion, and cerebellum [16,18,19], where the adjacent tissues have a relatively greater difference in shear modulus (rigidity) and thus shear and or tensile strains develop between tissues in concussion [20]. Among these regions, corpus callosum is one of the structures with the highest frequency of lesions [21-25], and hence thought to receive the highest strain concentration after impact [26], especially in the genu and splenium, which has been noted in the very early stage of TBI [27]. The high frequency of lesions may be due to the relatively large size of the CC and its proximity to brain ventricles. It may also be due to the relative ease of measuring this prominent structure, or to other factors.
Currently there is no standardized way of assessing the severity of TAI or predicting the prognosis of functional outcome of TAI in TBI patients. TBI with TAI is underdiagnosed by conventional imaging techniques [28,29]. Conventional neuroimaging findings cannot fully assess the severity of TAI (Figure 1), nor explain or correlate

Figure 1. Brain MRI images of a TBI victim who fell from a helicopter during a military-related operation. Normal intracranial anatomy in T1-weighted (a), (b) and T2-weighted (c) images. There are small “balck holes” (arrow) in the right deep white matter near the forceps major on the GRE (d) images, consistent with hemorrhagic foci due to traumatic axonal injury. The lesions are not identifiable on the FLAIR images (e).
the functional deficits of TAI in TBI subjects, let alone predict their long-term outcomes. Recently, T2*-weighted gradient echo (GRE) and fast low angle inversion recovery (FLAIR) imaging with high field MR, have been shown useful in detecting traumatic microbleeds (Figure 1), more so in moderate and severe cases of TBI [7,30]. Susceptibility-weighted imaging (SWI) is a novel MR technique that exploits the magnetic susceptibility differences of various tissues, such as blood, iron and calcification [31]. Paramagnetic hemoglobin or other iron containing blood products at different stages of microhemorrhages can be detected by SWI due to the signal loss induced by paramagnetic hemoglobin and the remaining iron in the tissue even after the absorption of fluid after trauma. Depending on the stages of TBI, microhemorrhages are usually displayed as small “black holes” (Figure 2) with possible increased signal intensity in the periphery in SWI, indicating severe diffuse axonal injury from TBI (Figure 2). Microbleed shearing lesions indirectly indicate the presence of TAI, which is considered to be the result of shear injury of white matter and blood vessels due to the rotational (non-elastic) deformation of brain tissue by trauma. This is particularly helpful for evaluation of TAI, which is often associated with microbleeds in the deep brain that are not routinely visible on computed tomography or conventional MR imaging sequences [32] (Figure 3).
However, the neuroimaging findings of milder forms of TBI are not well documented, and these sequences still underestimate the true extent of axonal damage [6]. Several recent studies have investigated the role of diffusion MRI and shown promising results in detecting microstructural changes in mild TBI [33-35]; however, these alterations in white matter integrity may not be specific to TBI, and their presence does not necessarily confirm a diagnosis of TAI [36,37].

Figure 2. SWI images of two TBI patients, one was caused by impact injury ((a), the same patient as Figure 1), and the other was blast injury (b). Both SWI images show numerous small hemorrhages throughout bilateral hemispheric white matter, which are not visible on the T1, T2-weighted images.
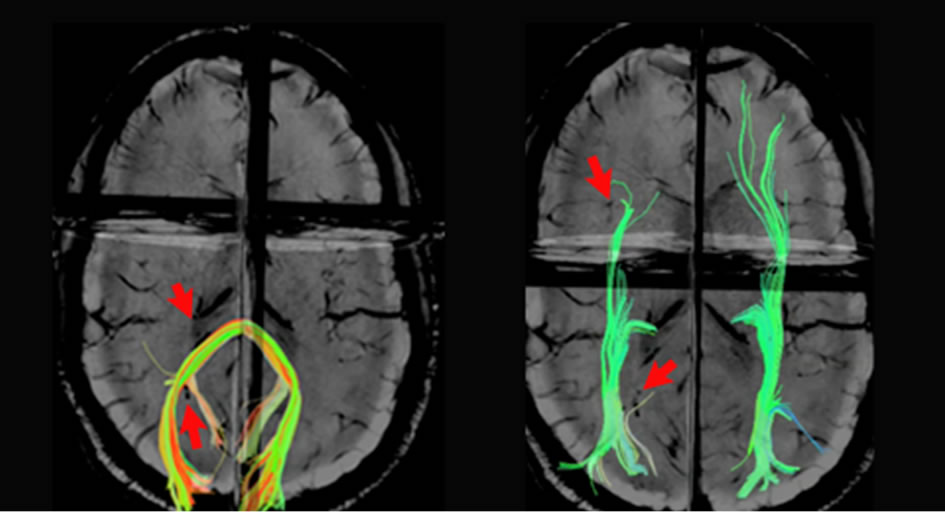
Figure 3. Reconstructed forceps major (left) and inferior fronto-occipital fasciculus (right) overlaid on the SWI images show hemorrhagic foci (arrows). Note the disrupted fiber tracts adjacent to the hemorrhages.
1.3. Basic Physics of DW-MRI and Apparent Diffusion Coefficient (ADC) Mapping
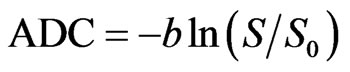
Brownian motion of molecules in a free medium during a given time interval obeys a three-dimensional Gaussian distribution and is described by a “diffusion coefficient” (D), defined by the mass of the molecules, the viscosity of the medium, and the temperature [38]. Diffusion MRI signals are made sensitive to diffusion through the use of a paired magnetic field gradient pulses [39]. Spin precession is proportional to the magnet strength, resulting in dispersion of the phase and signal loss, while another gradient pulse is applied in the same direction but with opposite magnitude to refocus or rephase the spins. The refocusing will not be perfect for protons that have moved during the time interval between the pulses, resulting in reduced MRI signal. The diffusion-weighted gradient strength is primarily determined by the gradient amplitude and duration of the gradient pulses, expressed by the b value that is proportional to the product of the square of the gradient amplitude and the diffusion time interval. The distribution of phase shifts, proportional to the net displacement of molecules, results in signal attenuation of DW-MRI, which is related to the amplitude of the displacement distribution of water molecules, i.e. slow (or large) diffusion results in smaller (or larger) distribution of phase shifts, and small (or large) signal attenuation. In free-diffusion physical model, the ADC mapping is derived from the equation,
 (1)
(1)
where S0 is the signal intensity without the diffusion weighting, S is the signal with the diffusion gradient. For DWI, each voxel in physical 3D space has a unique diffusion signature representing the sum of all molecular diffusion events occurring within the indicated tissue.
1.4. DTI and Diffusion in Biological Tissues
Biological tissues are heterogeneous media consisting of various compartments and barriers of different diffusivities. DTI is assembled in 3-D space to represent DWI as a function of the strength and direction of the magnetic field gradient applied during acquisitions. In white matter, diffusion anisotropy [40], predominantly caused by axonal membranes, varied depending on the orientation of fiber tracts relative to the orientation of the diffusion gradient and is influenced by the macroand microstructural features of white matter [41]. Thus, the more a directionally specific diffusion gradient is aligned with the axonal fibers, the greater the MRI signal attenuation will be in the voxel. In addition to non-diffusion weighted image, at least six images obtained by applying diffusion-sensitizing gradients in six noncollinear directions are required to construct a tensor (six ADC equations), which is represented by an ellipsoid with its principal axes along the eigenvectors. To estimate anisotropic diffusion, a 3 × 3 second-rank symmetric tensor, consisting of nine nonzero elements with three nonzero elements along the main diagonal (the eigenvalues), is used to characterize water diffusion properties in three-dimensional space.
Neuronal tissue is a fibrillar structure consisting of highly oriented and packed axons that are surrounded by glial cells. Thus, the organized bundles of neuronal tissue have restricted movement of water molecules on a micrometric scale to a greater extent in the direction perpendicular (radial diffusivity) than parallel (parallel diffusivity) to the axonal orientation.
2. Technical Considerations of DW-MRI Acquisition and Optimization
Several methods including the choices of imaging parameters [42-45], the approaches through which tensors are estimated [46,47], and the design of diffusion gradient directions [48-50] have been proposed to optimize DTI. In this section, we focus on discussing the artifacts of single-shot EPI and the optimizing techniques in minimizing these artifacts.
The following considerations apply in general to most of the DTI acquisition strategies. However, it should be noted that for TBI patients, short scan times are important since these patients frequently find it difficult to lie still in the MRI magnet. This is also an important factor toward emphasizing techniques, which minimize motion, or help to mitigate motion artifacts.
2.1. Acquisition Sequence
2.1.1. Single-Shot Echo-Planar Imaging (SS-EPI)
DWI studies are typically acquired using single-shot echo planar imaging (EPI) techniques in which the entire 2D EPI image is acquired from a single radio-frequency excitation pulse, thus minimize inter-shot phase problems.
SS-EPI has the advantages of short scanning time with a relatively high signal-to-noise ratio (SNR), thus minimizing the motion artifacts from patient movement and physiologic noises. However, SS-EPI is inherently prone to several limitations. These shortcomings include low spatial resolution, signal loss due to T2 and T2*-weighted decay during readout causing hyperintensity on diffusion-weighted images as a result of T2 prolongation (T2- shine-through, Figure 4(a)) [51], image warping artifacts due to fat-water chemical shift (Figures 4(b) and (c)), unfolding artifact arising from a mismatch between RF sensitivity profiles and distorted acquisition data in the presence of susceptibility effects (Figure 4(d)), magnetic field in homogeneity and susceptibility related image distortions, such as pileup due to eddy current [52] (Figures 4(e) and (f)), and motion artifacts due to cardiac pulsation, bulk subject movement and mechanical motion. One of the most common sources of ghosting is from the fat-water chemical shift, where a ghost image is shifted by a half of the field-of-view (FOV) in the phase-encoding direction and a secondary ghost image becomes overlaid on the original image (Figures 4(b) and (c)). Echo misalignments and distortions often lead to Nyquist ghosts, referring to the artifact from EPI traversing kspace in opposite directions on alternate echoes, in images obtained with EPI [53], and should be corrected for. The local susceptibility artifacts of SS-EPI from the magnetic field inhomogenieties are especially important in high-field scanners and affect structures near dissimilar tissue interfaces, such as close to the bony skull base and air-filled paranasal sinuses. Thus, the evaluation of microstructural changes is limited in these regions using DTI. The phase-encoding direction requires longer time relative to the slice-selection and read-out directions, thus the distortion caused by B0 field inhomogeneity is

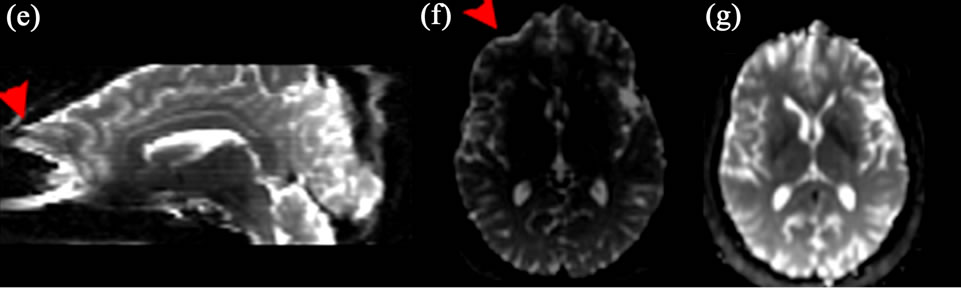
Figure 4. Examples of DWI artifacts. (a) T2-shine-through. (b), (c), (d) Ghosting artifacts. Fat chemical-shift artifacts in the b0 image (b) and FA (c) image, and unfolding artifacts (d). (e), (f), (g). Susceptibility artifacts with geometric distortion before (e), (f) and after (g) correction using field map.
most prominent in the phase-encoding direction. Moreover, the phase-encoding direction should be set to anterior-posterior relative to the patient, but not left-right, to avoid artificially introducing left-right asymmetries in diffusion characteristics.
2.1.2. Optimizing SS-EPI Sequence for Low Magnetic Field (1.5T) and Intermediate-High Magnetic Field
The strength, number, and orientation of the diffusionsensitizing gradients influence DTI. We briefly review the main topics and strategies for improving the quality of DTI acquired with a SS-EPI sequence in a clinical setting. Readers should refer to other review papers [54,55] for further details.
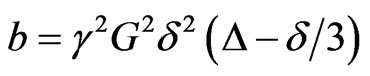
2.1.2.1. B-Value The b-value, expressed by:
 (s/mm2) (2)
is proportional to the product of the diffusion time interval (d) and the square of the amplitude of the diffusion gradient (G), where g is the gyromagnetic constant. Be aware that this b-value expression is valid for StejskalTanner bipolar gradients [39] only. The time interval between the two gradient pulses (D) can be varied to enhance different diffusion properties. A longer D increases the distinction between the signals in different directions by magnifying the difference of diffusion displacement between the directions perpendicular to and along the axonal wall, but resulting in lower SNR ratio due to the signal decay by T2 effect. A high b-value of 1000 s/mm2 has become the standard for clinical DTI, while higher values (2000 - 8000) are needed for advanced DWI using high angular resolution techniques (see below).
2.1.2.2. Diffusion-Sensitizing Gradient Higher gradient amplitudes and slew rates (the switching speed of gradients) are desirable for DWI. However, gradient performance exceeding federal dB/dt guidelines risks peripheral nerve stimulation due to induced electric currents. Modern MR scanners are equipped with stronger (~40 - 80 mT/m maximal gradient amplitude, T = Tesla) and faster gradients (~150 - 200 mT/m per millisecond maximal slew rate) [55], which may exacerbate eddy currents and mechanical vibration. Most DWI sequences use bipolar diffusion gradients with positive and negative lobes to cancel eddy currents [52]. Another variant is doubly-refocused SE EPI, which uses two consecutive RF refocusing pulses, each with a pair of bipolar diffusion gradients to further break up the time requiring for eddy currents arise and decay [56], hence decreasing artifacts. The drawbacks are the slightly increased TE with reduced SNR and possibly increased susceptibility artifacts [55]. According to one Monte Carlo simulation study, at least 30 directions are required for a robust estimation of tensor orientation [57]. However, another study [58] has shown that the number of directions prescribed matters less as long as the distribution of direction is optimized, i.e. uniformly distributed along the surface of a sphere by either using an electrostatic repulsion scheme [45] or through various geometric polyhedral schemes [59].
2.1.2.3. Signal-to-Noise (SNR)
The SNR of the non-diffusion image unusually should be larger than 20 in order to avoid bias of tenor parameter estimation. Low SNR leads to over-estimation of diffusion signals and results in the underestimation of diffusivity and possible underestimation of anisotropy in anisotropic tissues [55].
2.1.2.4. Motion Artifacts Bulk motion during the acquisition causes additional dephasing of the magnetization, leading to attenuated DWI signals. Cardiac gating and navigator echo correction techniques can provide images with reduced motionrelated artifacts [60,61]. Motion restriction devices such as padding are useful in reducing mechanical vibration from the MRI scanner or patient-related motion artifacts.
2.1.2.5. Voxel Size The voxel size is one of the major factors affecting the accuracy of fiber tracking (see below for discussion) [62]. An isotropic image with resolution of 2 - 3 mm is desirable to reconstruct the fiber trajectories in the brainstem [63] and the cortico-cortical association fibers [64]. Several studies have highlighted the importance of isotropic voxels in order to minimize directional bias [65].
2.1.2.6. Fat Suppression For brain imaging, fat-containing regions are usually limited to skull, the ocular orbits and the skull base. Frequency-selective fat-saturation pulses incorporated to SS-EPI to saturate the signal from fat-containing regions can minimize the fat-water chemical shift artifacts. Often, spectral-selective RF pulses (SPSP RF pulses) followed by gradient spoiling have been used widely to selectively saturate the fat signal [66]. However, these pulses often result in a compromise in the minimum slice thickness and a poor slice excitation profile. Newer pulse sequence designs have aimed at better fat suppression without affecting water signal intensity or slice-selection profile. Examples include the slice-selection gradient reversal method of fat suppression using two slice-selection pulses at 180 degrees of opposing polarity for the two refocusing pulses [67], or thinner slice excitation for high resolution DWI [68].
2.2. Parallel Imaging and Multi-Channel Coils
The SNR benefit at higher field strengths is counteracted by enhanced T2 decay and inhomogeneity effects. Since susceptibility effects scale with field strength, these artifacts are proportionally worse at higher field. Parallel imaging techniques are routinely applied on modern 3T systems equipped with optimized surface coils, effectively balancing these considerations by decreasing the echo-spacing (ES) and TE of the scan. This reduces susceptibility artifact and ameliorates signal loss due to T2 decay on these long ET acquisitions. However, parallel imaging can also induce new kinds of artifacts such as unfolding artifact (Figure 4(d)), which is caused by wraparound artifacts (aliased) acquired by each receiver element in a multi-channel array, especially in DWI acquired with SENSE (Sensitivity Encoding) [70] or ASSET (Array Spatial Sensitivity Encoding Technique), due to a smaller FOV [55].
3. Post-Acquisition Processing
The rapid readout of k-space in EPI leads to the short bandwidth in the phase-encoding direction, which makes the DWI images very sensitive to off-resonance, susceptibility, and eddy-current effects. Although the advanced acquisition techniques using mutli-channel parallel imaging [69,70] mentioned above have greatly reduced the EPI DWI artifacts, the post-acquisition processing is particularly crucial in minimizing the artifacts introduced in high field MRI, which can greatly improve the accuracy of DTI measures quantification and tractography results.
3.1. EPI Distortion Corrections
3.1.1. Susceptibility Artifacts
The discontinuity of the B0 magnetic field at the airtissue interfaces of temporal and frontal regions, referred to as field inhomogeneity (∆B), causes signal loss due to a shift of the maximal signal away from the theoretical echo time, leading to geometric distortion due to susceptibility effect. The magnitude of voxel displacement (distortion) is proportional to the ∆B and modulated by a term dependent (to a first approximation) on the first derivative of ∆B with respect to the phase encoding direction [71].
3.1.2. Eddy Currents
Eddy current cause EPI image distortion, such as scaling, shift and shear artifacts [51] and ADC miscalculations [72,73] because of non-linearity of the gradient system, including diffusion and imaging gradient pulses and their cross-terms [74]. Post-processing registration methods are commonly applied for reducing the eddy currents artifacts [75]. These methods uses a 3D computational image alignment technique by maximizing mutual information and estimating the parameters of a geometric distortion model inferred from the acquisition principle.
3.1.3. EPI Geometric Distortion Correction
As the geometric distortions are caused in large part by static magnetic field inhomogeneities, the pixel shifts, particularly in the phase-encoding direction, can be unwarped by characterizing the field inhomogeneities from a field map (Figures 4(f) and (g)) [71]. Other strategies have also been proposed to correct spatial and intensity distortions of EPI, such as using a deformable registration based method to co-register non-diffusion weighted image to a corresponding T2-weighted image [76], or using displacement mapping scan based on two EPI scans with opposed phase encoding polarities, resulting in opposite spatial distortion patterns [77,78], together with linear or nonlinear alignment procedures to determine the displacement map.
3.2. Quantitative Analysis of DWI Measures
3.2.1. Computation of Single Diffusion Tensor Map
To measure the molecular motion in the direction of a given direction gradient g, the Stejskal-Tanner sequence [39] is commonly used to relate the MR signal attenuation S(q,τ) to the statistical properties of the net displacement vector R by
 1 (3)
1 (3)
where S0 is a reference signal acquired with no diffusion gradient, τ is the molecular diffusion time,  is the displacement reciprocal vector (with
  is the gyromagnetic ratio of water proportions and
 ![]() is the duration of the diffusion gradients, and
is the duration of the diffusion gradients, and  is the ensemble average propagator (EAP), which is the probability of the displacement vector R in R-space. The space of all possible 3D q vectors is called Q-space (see below Q-space imaging for more discussion). The DTI model assumes the diffusion process to be Gaussian (free diffusion, strictly speaking), and the Stejskal-Tanner equation (Equation (3)) becomes
 (4)
(4)
where g is the unit vector , b is the b-value given by Equation (2), and D is the 3 dimensional diffusion tensor. DTI tensor mapping is typically computed by fitting the logarithmically transformed signal intensities from diffusion weighted images as a function of their corresponding b-matrices [74] according to the multivariate least squares (LS) regression model,
 (5)
(5)
where S(b) and S(0) are the signal intensity with and without diffusion gradient and their logarithmic form (ln), b for b-value matrix, and D is the diffusion tensor [46]. The multivariate LS regression model includes the signal variance as a weighting factor by assuming that the signal variability is only produced by the thermal noise, but not considering the “physiologic noise” arising from subject motion and cardiac pulsation and other artifacts, which do not follow a Gaussian distribution. On the contrary, the using nonlinear least squares fitting of the signal,
 (6)
(6)
where exp is exponential form, has been shown to be better than the linear least square approach in estimating diffusion tensor values [79]. Several “robust” diffusion tensor estimators have been applied to address the “physiologic noise” statistically [79,80]. These approaches include using iteratively reweighted least squares in which the weight of each data point is set to be a function of the residuals of the previous iteration using Geman-McClure M-estimator (GMM) method [80], or using GMM for robust estimation of tensors by outlier rejection followed by the final fit with the remaining data points using the constant weights, i.e. the RESTORE (Robust Estimation of Tensors by Outlier Rejection) algorithm [79]. The RESTORE method could potentially remove the cardiac pulsation artifacts during DWI acquisition [79], and has been demonstrated to be better than using the residuals as the only determinants of the weights, i.e. the GMM method.
3.2.2. Derived DTI Measures
3.2.2.1. Diffusivity Measures A number of related but distinct values can be derived from the DTI measurement. Some contain directional information (vectors), while others are reduced to scalar values at each voxel. The three principal diffusivities (eigenvalues, λ1 > λ2 > λ3)) are the diffusion coefficients measured along the three principal axes of the ellipsoid. The spatial orientation of fibers can be derived from the eigenvectors of the diffusion tensor. Relative anisotropy refers to the ratio of the variance of the three eigenvalues to their mean. Fractional anisotropy (FA) is the square root of the sum of squares (SRSS) of the diffusivity differences, divided by the SRSS of the diffusivities, which is a normalized measure (multiplied by square root of  to have the resulting number to be less than one) that describes the degree of directionality of diffusion.
 (7)
(7)
Parallel (λ1) and perpendicular (λ2 and λ3) diffusion direction relative to the fiber orientation are referred to respectively as axial diffusivity, λ|| = λ1, and radial diffusivity,  Mean diffusivity,
  or trace, λ1 + λ2 + λ3, is an index of the rate of diffusion averaged over all directions.
3.2.2.2. Geometric Measures The decomposition of the diffusion tensor based on its symmetrical properties can be applied to describe the geometry of the diffusion ellipsoid [81]. The geometry or shape of a tensor can be visualized using a coloring scheme based on the derived shape measures, i.e. linear ( ), planar (
 ), and spherical (
 ) [81].
3.2.3. Quantitative Analysis of DTI Characteristics
3.2.3.1. Region of Interest (ROI) Analysis Specification of the anatomical location of the putative group difference is a prerequisite. The conventional ROI approach may lack of statistical power to due to the high degree of intra and inter-subject variation of DTI measures [82], and is unable to attribute changes to a specific tract within regions containing two or more white matter bundles (Figure 5).
3.2.3.2. Histogram Analysis Conventionally, histograms of DTI measures are normalized by the total number of voxels to compensate for the variability of brain size are created. The peak height and peak location of a histogram are used to characterize water motion [83]. This method is easy to implement, but lacks information about specific anatomical location.
3.2.3.3. Whole Brain Voxel-Wise Analysis These operator-independent approaches allow the analysis of the entire brain volumes without a priori hypotheses regarding the anatomical differences between groups. However, co-registration of low resolution, high contrast
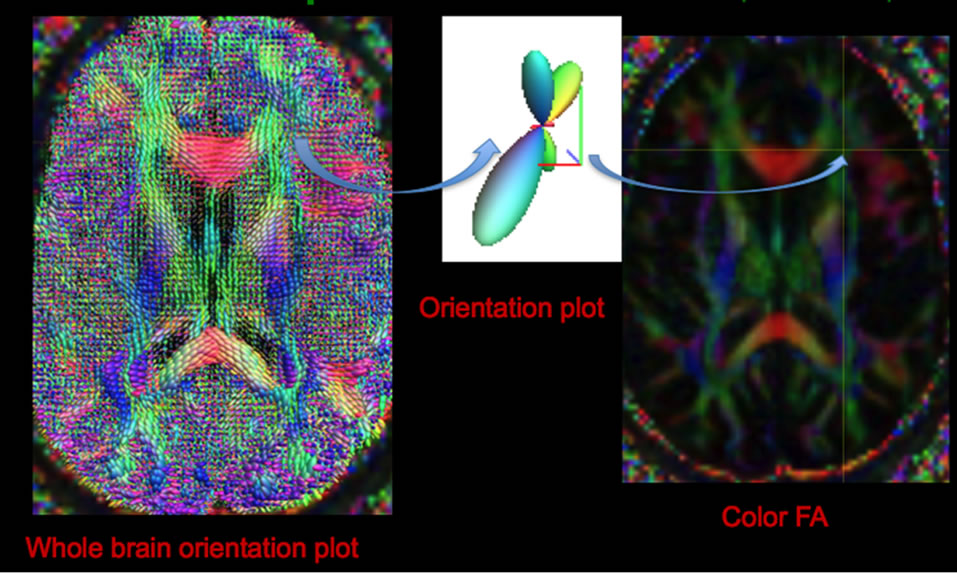
Figure 5. Whole brain diffusion orientation plots (left) using constrained spherical reconstruction to demonstrate fiber crossing at each voxel (middle), and its spatial location shown by color FA image (right).
FA may generate mis-registration, especially in the regions of high and low FA, i.e. adjacent to ventricles, due to partial volume effects. Spatial smoothing and statistical correction for multiple comparisons may limit the sensitivity of detecting mild difference across subjects, and the amount of smoothing is arbitrary [84]. Moreover, the localization of specific tracts of the statistical results is not straightforward [82]. Several methods have been developed to address these problems, as discussed in the following sections.
Tract-based spatial statistics (TBSS)
TBSS is an automated technique that combines the strength of both voxelwise and tractography-based analyses by using non-linear image transformation of FA images across subjects [85]. The mean FA map is skeletonized to identify the core of white matter tracts containing the highest FA values. FA values from individual subjects are then projected onto the mean FA skeleton image, and voxel-based analysis is applied afterwards. However, the sensitivity to detecting a real effect on the skeleton varies across space, i.e. a local skeleton will have a mean number of neighboring voxels within a given distance that varies according to the local skeleton orientation. This spatial non-stationarity may create false positive results in group comparisons [86].
High Dimensional Deformation High-dimensional tensor-based registration uses symmetric normalization and diffeomorphic deformation method to register a whole tensor, either done only on the DT images [87,88] or combining T1 images [89], in order to reconstruct a study population atlas [87]. The optimization method seeks a piecewise affine transformation by dividing the image domain into uniform regions and applying an affine transforming. This captures both the image similarities and the smoothness of the transformation across region boundaries, by using the conjugate gradient method. The method has been shown to be robust for investigating white matter pathology in the developing brain [90]. The deformable registration can further combine with fiber tracking and segmentation by fitting the normalized white matter tracts with deformable geometric medial models for tract-specific analysis [91]. The advantages of this approach is to average and combine tensor-based features along directions locally perpendicular to the tracts, thus reducing data dimensionality and accounting for errors in normalization [91]. However, lengthy computation is the main drawback for its application to clinical studies.
3.4. Tractography
We briefly elaborate the main principles of fiber reconstruction techniques, limitations and their applications in clinical studies. Readers interested in this topic should refer to the excellent review by Mori and van Zijl [92] for more details. Fiber tracking is a reconstruction procedure to trace continuous curves from a direction field, where trajectories or curves represented as sequences of points joined by line segments. In principal, there are two major components of fiber track reconstruction algorithms: i) local modeling of the diffusion propagator in each voxel, and ii) integration of the information of fiber orientation information into streamlines structures. Fiber tracking can be classified into two major categories in terms of the extent of fiber tacking and reconstruction algorithms, namely local vs global and deterministic vs probabilistic (Figures 6(a) and (b)). Local methods reconstructs fibers path-by-path without taking other fibers into account, while global methods [93,94] simultaneously reconstruct the fibers and find the solutions of the forward problem based on prior knowledge, which best describes the measured DWI data. Fiber reconstruction using local methods is performed in small successive steps, either deterministic or probabilistic. Deterministic (streamline) techniques usually use line propagation and energy minimization approaches, while probabilistic (distributed, stochastic) tractography produces a global likelihood map of paths between the two ROIs, in terms of seed and termination voxels [95,96]. Global methods aim to reconstruct all fiber tracts at a time, which is computationally intense and requires specification of prior fiber information [97,98].
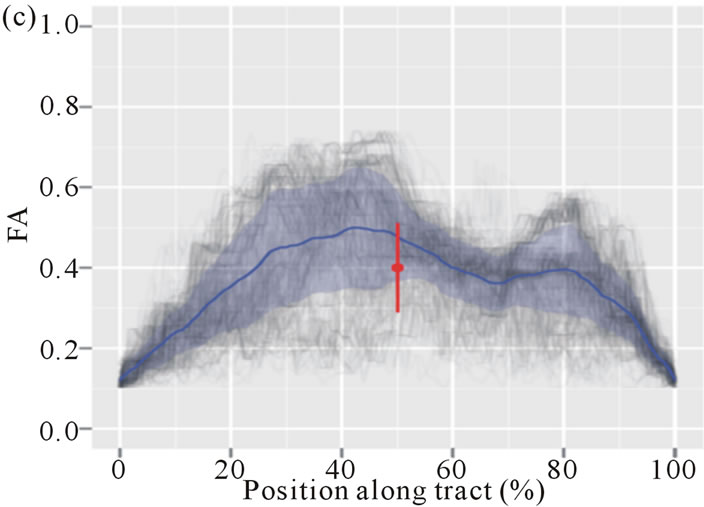
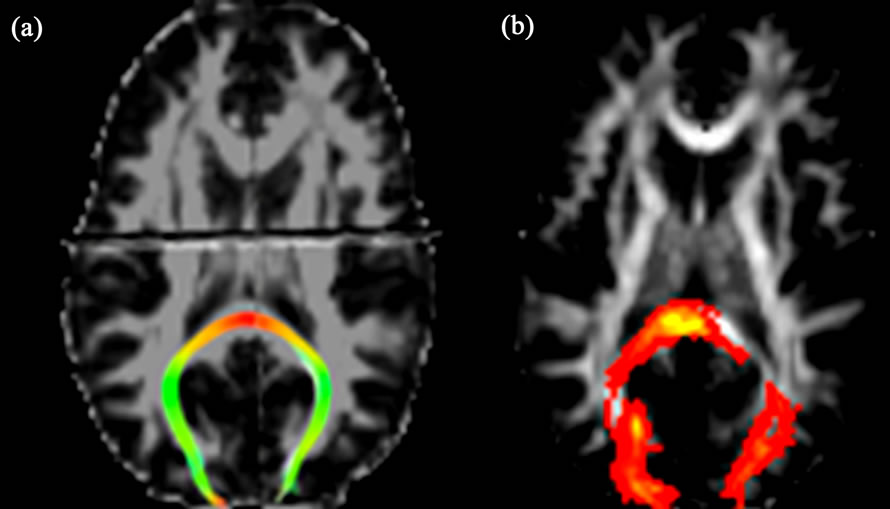
Figure 6. Reconstructed forceps major using streamline (a) and probabilistic (b) tractography, and the profile plots of FA values along the tract (gray lines) with the mean (blue line) and its standard deviation (read line) (c).
After reconstructing fiber tracts, quantitative analysis of DTI measures similar to those mentioned above can also be applied on individual tractograms to evaluate differences across subjects.
3.4.1. Preprocessing
3.4.1.1. Noise Reduction The precision of fiber tracking depends on the path geometry, and anisotropy calculated from diffusion tensor elements that are susceptible to noise [62]. The introduced errors in the estimates of fiber direction accumulate along the fiber path trajectories and may result in deviations from the ideal, noise-free DTI data [99]. Several algorithms have been developed to reduce DTI noise, such as a “regularization” based on a low curvature hypothesis [72], filtering the closest gradient directions to the direction being processed in the mean squared error sense or an unbiased non-local means using a Rician noise model [100,101], or an approximation of the tensor field based on B-spline fitting [102].
3.4.1.2. ROI Selections Tractography requires selection of appropriate anchor points, including a seed point, waypoint(s) and/or an endpoint, and also exclusion masks to perform tract dissections. Several pre-specified ROI approaches, sometimes referred to as manual “cookbooks” can be found in published literature [103].
3.4.2. Deterministic Tractography
Deterministic fiber tracking from DTI uses the principal direction of diffusion to propagate trajectories from defined seed voxels over the image until termination criteria are met, i.e. excessive angular deviation (usually in the range between 40˚ to 70˚ [55]) and minimum voxel FA threshold (usually between 0.1 - 0.2 as typical gray matter [92]).
Several methods have been developed for fiber propagation. In conjunction with smoothing and boundarypreserving, anisotropic interpolation of the direction field allows fiber pathways to be tracked in a more reliable and continuous manner. Linear interpolation via local path integration along principal diffusion directions, which is dubbed as fiber assignment by continuous tracking (FACT) [103] using the multiple region-of-interest “virtual dissection” [104], still remains the most popular approach of DTI tractography for clinical application [103, 105].
3.4.3. Probabilistic Tractography
Uncertainty in diffusion MR measurements is caused by a variety of sources such as measurement noise and physiologic motion [99] as discussed above. Assuming various probability density functions of the fiber direction estimates, probabilistic tractography algorithms estimate path variability by modeling uncertainty of DTI, i.e. eigenvector dispersion [95,96]. Probabilistic tractography aims to address the limitation of deterministic tractography, which forces early termination of reconstructed pathways by applying an arbitrary anisotropy threshold, and possibly segmenting the gray matter based on the connectivity distribution [95,106]. Commonly methods used in probabilistic line propagation include random walk simulation using a streamline-based probabilistic index of connectivity (PICo) [95], and a multi-compartment ball-and-stick model including one perfectly isotropic “ball” compartment and multiple perfectly linear “stick” compartments by assuming same diffusivity in all compartments based on a Bayesian framework [96]. The parameters of multi-compartment models can be used to indicate fiber directions by taking peak interference into account (see below for more discussions). Probabilistic methods produce maps of “connectivity”, which give the probability of this voxel to be connected to a reference position for every voxel of a regular 3D grid. These methods are known to be more resistant to noise. However, a greater number of diffusion directions than deterministic tractography is needed for accurate fiber tracking, and detailed anatomical knowledge is required to judge the results of reconstructed fibers.
3.4.4. Global Tractography
Instead of using the “walking principle” such as the continuous tracking (FACT) method, several tractography algorithms based on a more “Global” approach have been proposed [93,94,97]. These algorithms attempt to find the configuration of fibers that best explain the observed data, which operate directly on the acquired DWI data, neither replying on a preprocessing step to extract the fiber orientations like estimating fiber orientation distribution, nor replying on a model to compute the expected DWI signal intensities for a given arrangement of fiber orientation like mixture ADC model (see below). In principal, each segment of a fiber (i.e., an oriented point) is a parameter to be optimized in global tractography. Optimization is performed such that each segment tries to associate with neighboring segments to form longer chains of low curvature while optimally modeling the DWI. Each fiber segment contributes as a single isotropic Gaussian model, which eventually results in a mixture of Gaussian curves in each voxel. Although the results of global tractography have been demonstrated as the most reliable among 10 tractography methods using diffusion MR phantom data, these algorithms are very computation-intensive, which may limit their use in clinical application.
3.5. Fiber Segmentation and Parcellation
Several methods have been developed to automatically segment and cluster [107] white matter tracts [108] as well as to characterize tract shape parameters [109]. Specifically, these include methods based on the segmentation of a given bundle from a set of initial regions of interest (ROIs) [110-112]; neighborhood tractography (NT) optimizing seed point placement by choosing the output with the greatest similarity to a reference tract (heuristic NT) [113] or using probabilistic model to choose the tract that best matches a predefined reference tract (probabilistic NT) [114]; and using atlases in voxel-based classification [115] or in deformable models [116]. For the fiber clustering techniques, points are sampled from a 3-D curve and WM fiber tracts are grouped into bundles based on the anatomic knowledge [108] and/or fiber similarities estimated by similarity metrics [115] or shape statistics [117]. All of these unsupervised clustering techniques must integrate anatomic knowledge and atlas information in order to parcellate the known meaningful fiber tracts.
More recently, methods which address the partial volume effect (PVE) and fiber crossing have been applied to WM tracts segmentation [118], and using Markov Random Field segmentation to model the similarity between neighboring tensors based on a prior shape and direction, referred to as Diffusion-Oriented Tract Segmentation (DOTS) [119]. Another automatic reconstruction of white matter pathways, named as TRACULA (TRActs Constrained by UnderLying Anatomy) [120], uses global probabilistic tractography [94] based on the knowledge of prior distributions of the neighboring structures of each pathway, derived from a set of training subjects. The prior probability of a path in the test subject given the training data set is then calculated for each voxel along the path. Path propagation is further constrained by the results of cortical parcellation and subcortical segmentation [121,122] of the test subject, and the posterior distribution of fiber path is estimated via a Markov Chain Monte Carlo algorithm.
However, all atlas-based parcellation methods require accurate co-registration. Since most current developed algorithms are limited to the single diffusion tensor model, and the accuracy of fully parcellation of pathologic fiber tracts has not been explicitly evaluated.
3.6. Along-Tract Statistics and Tract-Based Morphometric Analysis
Recent studies have demonstrated that tract-based analysis of DTI measures across subjects is more reproducible than conventional ROI measurements, i.e. the intricate individual tract dissections are typically collapsed down to a single mean diffusion metric estimate for statistical analysis [123,124]. The eloquence and rich anatomical information in diffusion imaging can allow researchers and clinicians to examine diffusion metrics and investigate subtle (micro)structural changes along fiber tracts [125-127]. This approach allows testing of betweengroup differences within a specific tract. However, it may suffer from an operator-dependent placement of regions to define the tract starting locations, and also from difficulties in resolving the crossing or meeting of different fiber tracts. Thus, fiber streamlines need to be resampled after proper tract dissection in order to give uniform number of vertices along each streamline and to determine along-tract properties for along-tract analysis [128]. The DTI metrics such as FA, MD and arch length can then be estimated at each-section along the tract in the native diffusion space (Figure 6(c)). Furthermore, between-group difference can be summarized and visualized on mean tract geometry. Tract-specific and tractprofile analyses on the spatially normalized tractograms are an approach, which mitigate individual anatomic variations and enhance the accuracy of connectivity analysis between groups, and the interpretation of results may be more meaningful.
3.7. Reliability and Validation of DW-MRI Measurements and Tractography
Chemical tracing of the human brain in-vivo is difficult, limited to post-mortem case reports. Using the porcine brain, Dyrby et al. [129] quantitatively and qualitatively assessed the anatomical validity and reproducibility of in vitro multi-fiber probabilistic tractography against two invasive tracers. They demonstrated that probabilistic tractography reliably detected specific pathways and concluded that tractography can be a precise tool in studying anatomical brain connectivity. Unfortunately, chemical tracing data is almost inexistent in the human brain, with only limited to case reports [130,131].
3.8. Comparisons of Available DWI Processing Tool Kits
We briefly discuss the available open-source DWI tools and modules that have used widely in the neuroscience field, and their usage in DWI processing. Table 1 shows a summary of the examples of open-source DWI tools, including brief descriptions of available tools of DWI post-processing mentioned in this review. The authors do not intend to endorse any tool. The reader is encouraged to choose software tools depending on the availability, local support, and applicability to the research question in order to achieve the goals of their application.
4. Newer DW-MRI Techniques
4.1. Pitfalls of DTI
Assuming no geometrical restriction (free diffusion), the

Table 1. A list of open source diffusion MRI software packages and their tools.
central limit theorem [132] ensures a Gaussian distribution of the random phase in the Brownian motion. DTI models assume that a Gaussian distribution of the displacement probability of water is valid [133], i.e. “Gaussian phase approximation” [134]. However, the experimental evidence demonstrates a non-Gaussian distribution of restricted diffusion due to the compartmentalization [135-138], and this phenomenon becomes apparent while using a high b-value (> 2500 s/mm2) [137,138]. The second assumption is a single coherent tract per voxel, i.e. a homogenous Gaussian diffusion population within each voxel. DTI estimation of diffusivity is based on the implicit assumption that diffusion occurs in an unrestricted environment. However, there is always structural hindrance or restriction that prohibits truly free water diffusion, i.e. restricted diffusion depending on cell membranes, organelles, and water compartments [139] and can be probed by applying a higher b-value [140, 141]. Non-Gaussian diffusion is observed when the diffusion signal decays in a pulsed gradient experiment, which cannot be explained by the Stejskal-Tanner relation [142,143] This deviation is observed when special experimental conditions are undertaken: strong gradient pulses and long diffusion times. The typical axon diameter is around 1 um, but the typical voxel edge of state of the art DTI is 1 mm, which inevitably leads to averaging over complex fiber configurations such as fiber crossing, fanning (diverging) or touching (kissing).
Although the second-order diffusion tensor model is the most common model of anisotropic apparent diffusivity, there are pitfalls of using ADC maxima derived from the single tensor model of DTI to predict fiber direction. ADC maxima do not approximate fiber directions when a DW-MRI voxel contains multiple compartments because the the log-description exp(-bD) in Equation (6), do not add linearly. This has serious implications for DTI tractography, particularly for smaller white matter tracts [144]. The DTI model is sufficient to infer the dominant fiber direction, but not in the areas of tissue partial volume. Thus, DTI fails in regions with several fiber populations aligned along intersecting axes because it cannot be used to map several diffusion maxima at the same time, and it has recently been shown that crossing fibers can be detected in over 90% of white matter voxels [145]. For example, in the frontal region three tracts (the genu of corpus callosum, anterior thalamic radiation of internal capsules, and superior longitudinal fasciculus) project to the frontal lobe but with different directions (Figure 5).
4.2. Overview of Non-Gaussian Diffusion-Weighted Imaging
To overcome the of limitations of DTI, new acquisition techniques using higher angular resolution of neighboring diffusion directions, such as high angular resolution diffusion imaging (HARDI) [146] have been proposed to address the issue of non-Gaussian diffusion in multi-fiber systems. In contrast to DTI, HARDI consists of measuring the DW signal using a much larger number of uniformly distributed DW gradient directions than required for DTI, so as to capture the higher angular frequency features of the DW signal that are not adequately modeled by a single diffusion tensor. These non-Gaussian DWI methods can be tentatively classified into two major categories according to the data analysis techniques i.e. one is based on the Q-space (the space of DW gradient amplitude vectors) and spin propagator analysis without model specification (model-free), and the other relies on the ADC to model the DW signal for multiple fiber population (mixture model) and fiber orientation distribution (FOD). Both Q-space imaging (spin propagator) and ADC mixture models with FOD commonly use a larger b-value than DT-MRI (b = 1000 s/mm2 to b = 3000 s/mm2) to achieve sharper fiber peaks [146,147]. These methods have been shown to reveal more connections between brain regions than using a single tensor model [148].
Q-space is the reciprocal spatial space defined through the Fourier transform of a probability density function (PDF) by specifying the probability distribution of both positions and displacements of water molecules (spins). Model-free Q-space methods estimate the diffusion orientation distribution function (dODFs), the diffusion displacement PDF of water molecules, in the density of the average relative spin displacement within a voxel (the diffusion propagator) without implying any model of diffusion [149]. The underlying fiber orientation distribution function (fODFs) can be further estimated, which is fundamental for tractography. These methods aim to resolve complex white matter architectures by estimating the dODFs [150] of water molecules based on the Fourier transform relationship between the PDF of diffusion displacement and the diffusion weighted signal attenuation in Q-space, and to determine the number of fibers present or when pathways branch in the fiber-crossings regions.
HARDI refers to a DWI with diffusion gradients applied along many directions distributed almost isotropically on the surface of a unit sphere. A more clinically feasible approach of HARDI analysis is to measure apparent diffusion coefficients along many directions to resolve multiple intravoxel fiber populations [146]. A number of approaches have been proposed to compute the ensemble average diffusion propagator of HARDI data. Typically, there are two strategies used in HARDI: 1) sampling of the whole Q-space 3D Cartesian grid and estimation of the ensemble average diffusion propagator by inverse Fourier transformation, i.e. diffusion spectrum imaging (DSI) [151], 2) single shell spherical sampling and estimation of fiber distributions from the diffusion/ fiber ODFs, i.e. diffusion orientation transformation (DOT) [152], persistent angular structure (PAS) MRI [153], and Q-Ball imaging (QBI) [150]. These modelfree Q-space analyses apply more flexible methods to model DW-MRI signal in order to calculate the PDF of spin displacements (the diffusion propagator), and estimate fiber directions without specifying any tensor model.
Instead of using model-free methods, several modelbased schemes have been developed to characterize crossing fibers [152-155], estimate the fiber distribution [147], and model the diffusion pattern [136,139]. Assuming the DWI signal measured is the sum of signals from each distinct fiber bundle in a crossing fiber region, ADC mixture models aim to solve the inverse problem to recover the fiber orientations and corresponding volume fractions that best explain the measured DW data. The examples of parametric models are spherical harmonic deconvolution (decomposition) [147,156-161] of the fODFs of HARDI data (fiber models) and multi-tensor models [146,162] based on ADC analysis.
Other multi-fiber reconstruction techniques have been proposed to estimate high order spherical functions such as the Persistent Angular Structure (PAS) [153], the Fiber Orientation Density (FOD) [147,156,163,164], the Diffusion Orientation Transform (DOT) [152] and multitensor distributions [165]. All these multi-fiber techniques are developed to deal with non-Gaussian diffusion process and reconstruct spherical functions with potentially multiple maxima aligned with the underlying fiber populations. A good review of all these high order reconstruction techniques can be found in [166].
In summary, many models involve functions on the sphere, i.e. mixture ADC models, ODFs from DSI, DOT, QBI and spherical deconvolution. Spherical harmonics and symmetric higher-order tensors are equivalent bases for such functions. The conversion between spherical harmonics and tensors is as simple as a matrix-vector product, and the investigators should pick the most convenient forms available at their hands for the tasks.
5. Clinical Applications of Diffusion MRI to TBI
5.1. Current Concepts of TBI
In the acute and subacute stages, reactive axonal change after trauma is linked to perturbation of the axolemma (increased axolemmal permeability) resulting in disruption of calcium ionic homeostatic mechanisms within injured nerve fibers, and the subsequent activation of the cysteine protease leading to the proteolysis of subaxolemmal cytoskeletal networks (membrane skeleton) [167, 168].
Tau protein is a highly soluble microtubule-associated protein, mostly found in neurons rather than non-neuronal cells in humans [169]. One of the tau protein’s main functions is to modulate the stability of axonal microtubules through isoforms and phosphorylation [170,171]. Hyperphosphorylation of the tau protein can result in the self-assembly of tangles of filaments, or neurofibrillary tangles (NFTs), which are involved in the pathogenesis of Alzheimer’s disease and other tau pathology [172]. Preliminary research indicates that iron deposits due to hemorrhaging, following TBI, may increase tau pathology. NFTs are most commonly seen associated with repetitive mild TBI as opposed to one instance of severe traumatic brain injury [173]. Furthermore, high levels of tau protein in the fluid bathing the brain are linked to poor recovery after head trauma [174]. However, further work may determine if other blood component factors unrelated to hemorrhages are involved in this TBI-induced augmentation of tau pathology.
Although the pathogenesis of anterograde (downstream) degeneration/deafferentation and retrograde (upstream) neuronal responses in the chronic stage after trauma are not well investigated or understood, recent studies of TBI have revealed that traumatic axonal injury is an active progressive deterioration of white and gray matter [175-177]. Therefore, the prevention of secondary injury and early intervention are of great importance if we hope to improve the outcomes following trauma. Diffusion MR maybe a critical component in the early diagnosis and monitoring of traumatic axonal injury. In addition combination with other imaging modalities maybe synergistic for the evaluation of TBI.
5.2. Summary of the Findings in Published Literatures Using Diffusion MRI in TBI
Most DTI studies of TBI evaluate subjects (sub)acutely after injury or at chronic periods. A good review of DTI findings on mild TBI has been published recently by Niogi and Mukherjee [178]. The white matter tracts which tend to show abnormal DTI measures in TBI are the association fibers of fronto-parieto-temporal pathways such as superior and inferior longitudinal fasciculus, uncinate fasciculus, and anterior corona radiata, and also projection fibers of fronto-limbic network such as cingulum bundle and fornix, and the inter-hemispheric connection, i.e. genu and splenium of corpus callosum.
5.2.1. Interpretation of DTI Findings and the Possible Corresponding Pathobiologic Mechanisms of TBI
Water diffusion in white matter is mainly hindered by myelin sheaths and cell membranes [138], thus the DTI measures are sensitive to myelination and axonal packing. Decreases in FA can be attributed to primary brain parenchymal changes caused by trauma, inflammation and degeneration leading to dys/de-myelination, axonal loss, edema, and loss of tract coherence. Secondary white matter changes (Wallerian) begin with axonal degeneration in 2 - 7 days post-injury followed by myelin degradation and astrocytes infiltration at 2 weeks post-injury [179,180]. Reduction in diffusion anisotropy by Wallerian degeneration depends highly on the white matter architecture, i.e. mainly in the regions where fibers are arranged in isolated parallel bundles such as the cerebral peduncle, but not in regions where fibers cross such as the rostral pons [181].
ADC, which is the overall mean-squared displacement of water molecules restricted by organelles and membranes, reflects cellular integrity, density and extracellular volume [182,183], and relates to the volume fraction of the interstitial space [183] but is independent of tissue directionality [184]. Intact, organized and myelinated fiber tracts generally have high FA and low ADC from the longitudinal oriented micro-structural elements, i.e. myelin sheath, axolemma, neurofilaments and cytoskeleton structures. On the contrary, low FA and high ADC reflects damaged white matter due to fewer longitudinal oriented elements. An increase of radial diffusivity is thought to signify increased space between fibers, suggesting de/dys-myelination [185], whereas a decrease of axial diffusivity suggests axonal injury [186]. However, interpreting axial and radial diffusivities should also take other geometrical properties of diffusion into account and caution is called for [187].
5.2.1.1. Acute and Subacute Stages Several DTI studies have shown decreased FA and increased ADC in acute TBI patient [188-192], possibly explained by disruption of membrane skeleton and/or vasogenic edema due to the increased axolemmal permeability. Few studies have found increased FA and/or decreased ADC in acute (within 72 hours) [193] and subacute (around 2 weeks post-injury) [35] TBI patients, and the increased FA is primarily due to the decreased radial diffusivity [35]. The FA and other DTI metrics in the cingulum bundles revealed by a serial imaging (four scans) within the first week post-injury in a recent study of eight acute TBI patients showed a complex and heterogeneous pattern, with FA transiently increased in some participants but memory performance most negatively impacted in days 3 - 4 [194]. Possible explanations of these findings are that cytotoxic edema (swollen axon) in the acute stage would cause a net movement of water into intracelluar space, and restrict free water movement, and thus resulting in a decreased ADC, and possibly an increased FA. Although the time course of cytotoxic edema after TBI has not been definitively established, human models have suggested that cytotoxic edema may reach maximal levels at 24 to 48 hours post-injury in acute stage [195], which can not explain the findings of increased FA observed in subacute TBI. Another explanation of an increased FA in subacute TBI is the more coherently oriented fibers on intercepting fiber tracts [196]. In addition, discontinuity on fiber tracks of subacute TBI patients have been demonstrated by selecting ROIs within individuals using a normalized tractography method in a recent study [197].
5.2.1.2. Chronic Stage Several studies have shown a decreased FA and/or an increased ADC in chronic (after several months) TBI patients [25,198-201], suggesting an irreversible pathologic change in traumatic axonal injury due to a significant decrease of myelin thickness or axonal density, which maybe the cause of chronic post-concussive symptoms. Interestingly, slightly increased parallel diffusivity after mild TBI coupled with a large change of radial diffusivity after moderate to severe TBI at chronic changes [202] may indicate a change of distribution of overall water content, either interstitial and/or intracellular, in addition to demyelination or axonal loss in chronic TBI. The inflammatory process with an increase in isotropic tissue (gliosis) and extracellular matrix [181], and decreased extracellular water content will lead to increased parallel diffusivity because of the relatively compacted axons [178]. Nonetheless, the interpretations of DTI measures and claims of the underlying brain tissue changes must be treated with prudence [187].
5.2.1.3. Mild vs Moderate/Severe Many DTI empirical studies focused only on mild TBI or included several levels of injury severity [203]; however, very few studies had investigated the differences of DTI metrics among the severity of TBI patients. One study on chronic TBI patients (20 mild, 17 moderate and severe) found decreased FA in all thirteen ROIs in the moderate to severe group, but only in the corticospinal tract, sagittal striatum, and superior longitudinal fasciculus regions in mild group [202]. Both axial diffusivity and radial diffusivity were increased in the moderate to severe group, but only axial diffusivity was observed in the mild group, suggesting de-, dys-myelination is present in moderate to severe TBI but not mild TBI [202]. Although these findings have not been reproduced in any other studies of larger sample size, TAI may form a spectrum of white changes following TBI.
5.2.1.4. Blast vs Nonblast It is becoming apparent that there may be differences in disease progression and symptomatology [3] between impactand blast-related TBI [4,204]. However, there is a paucity of knowledge on whether the vulnerability of white matter after injury is different between blastand impact-related TBI. Recent results from experimental studies using animal models of blast exposure have demonstrated that direct blast shockwave is capable of penetrating the calvarium [205] and can induce high strain rates leading to structural deficits such as axonal membrane disruption [206], myelin disruption, and neuronal death [207-209]. Hypotheses such as pressure wave transfer via the great vessels of the circulatory system (the rippling effect) have been proposed as mechanisms to inflict white matter deformation and to cause secondary systemic tissue response of blast injury [210,211]. The rippling effect postulates that blast waves ripple through the torso up into the brain through the major great vessels [208,210] leading to shear-strain deformation and resulting in multi-focal scattered lesions commonly seen in cerebral gray-white matter junction, the deep subcortical WM tracts, centrum semiovale, the dorsolateral aspect of the upper brain stem, basal ganglion, and cerebellum [16,18,19]. It is reasonable to assume blast TBI has relatively broad or more heterogeneous distribution of white matter abnormalities compared to nonblast TBI; however, to the best of our knowledge, there is no literature to support this hypothesis.
5.2.1.5. Longitudinal Changes and Recovery It is becoming clear that many of the sequelae of TBI represent a dynamic process with brain structural and functional changes following years after the event, and not merely a direct consequence of the acute trauma. Currently, only a few longitudinal studies of humans using DWI have been published, and all involved small sample sizes. One study has shown the normalization of acute white matter injury by reversing a high FA as a result of normalizing a low radial diffusivity in a 3 - 5 months follow up after acute trauma [35]. One study has revealed the reversal of low FA, with a nadir at approximately six months; and an increase of ADC in the posterior corpus callosum, which corrected with improving motor function [212]. Another study with a relatively larger sample size of 30 mild TBI patients has shown a progressive deterioration of microstructural white matter integrity in a year follow up after the event of trauma [213]. A recent study of 34 TBI patients followed up at 2 weeks, 3 months, and 6 months post-injury showed heterogeneous spatial pattern of low or high FA abnormalities among patients, with high FA in the deep and subcortical white matter suggesting evidence of compensatory mechanism of injury or plasticity following injury [214]. More interestingly, increased FA and reduced mean diffusivity may suggest a poorer outcome of TBI [203]. Nevertheless, studies with larger sampling on several time points are necessary to elucidate the mechanisms of central nervous system degeneration, repair and brain plasticity after TBI.
5.3. Integration of DTI and Other Neuroimaging Modalities
Several other MRI techniques have demonstrated the potential to improve the diagnosis of traumatic axonal injury and possible outcome prediction, i.e. MR spectroscopic imaging for brain metabolites, perfusion imaging for cerebral flow change, susceptibility weighted imaging (SWI) for microhemorrhages, and FDG-PET for glucose utilization [215,216]. SWI exploits the magnetic susceptibility differences of various tissues, such as blood, iron and calcification, and is sensitive to microhemorrhages detection [31]. Integrating SWI and DWI promises to be a standard way of evaluating traumatic axonal injury (Figure 3). fMRI studies help elucidate the complementary aspects of brain structure and function. However, a recent study was unable to demonstrate that the presence of functional abnormalities in fMRI correlated with the abnormal DTI measures in sport-related mild TBI subjects [217]. Nevertheless, advances in multimodal neuroimaging hold promise for better detection, characterization, and monitoring of objective brain changes in TBI.
5.4. Correlation of Diffusion MRI and Neurocognitive Function
Complex cognitive processes such as attention, executive functions, and memory, all require intact white matter tracts among frontal, parietal, and medial temporal lobes, which may be disrupted following brain trauma. Recent DTI studies suggest that the cognitive impairment following trauma may correlate with the severity of white matter injury [218]. Several large-scale cognitive networks, such as language pathways, limbic pathways, dorsal fronto-parietal networks, visual networks, and their associations with normal neurological functions and neuropsychiatric deficits have been investigated using diffusion tractography [219]. Nevertheless, understanding the relationship between normal neuropsychological functions and diffusion measures in healthy subjects is needed to evaluate the structure-function relationships in TBI patients.
6. Future Direction and Conclusions
Relating structural connectivity with functional activity is of fundamental importance to understanding the pathophysiology of TBI. However, early diagnosis and “visualization” of traumatic axonal injury in mild TBI is still challenging. Identification of fiber “breaks” and the relationship of the structural abnormalities to functional effective connectivity together may provide converging evidence about the alteration of neural networks in TBI.
Conflicting results of white matter microstructural changes between the early phase of mild TBI and followup exams may arise from the limitations of DTI in resolving crossing fibers. Advanced diffusion MRI techniques both in acquisition and post-processing can help resolve such conflicting results and provide insights into neural connectivity that have not been previously possible in vivo.
In summary, with the help of advanced diffusion MR imaging techniques, both hardware and software, and the integration of other neuroimaging modalities, we are optimistic about more readily visualizing the lesions of traumatic axonal injury in the near future. Further longitudinal studies using advanced DWI techniques with higher resolution tractogaphy in a synergistic approach are expected to provide insight in understanding the pathogenesis and recovery of TBI. Thus, this neuroimaging information could be used to formulate prevention and intervention strategies in treating TBI patients, and to predict their future behavioral outcomes.
7. Acknowledgements
This research was partly supported by CDMRP to USUHS (CNRM) Grant PT074437 (G.R.), and Brain Behavior Research Fund Grant 18317, NASRAD Young Investigator Award (P.-H. Yeh).
8. Declarations
The views expressed in this article are those of the author and do not reflect the official policy of the Department of Army/Navy/Air Force, Department of Defense, or USA Government.
REFERENCES
- G. Ling, F. Bandak, R. Armonda, G. Grant and J. Ecklund, “Explosive Blast Neurotrauma,” Journal of Neurotrauma, Vol. 26, No. 6, 2009, pp. 815-825. doi:10.1089/neu.2007.0484
- Y. C. Chen, D. H. Smith and D. F. Meaney, “In Vitro Approaches for Studying Blast-Induced Traumatic Brain Injury,” Journal of Neurotrauma, Vol. 26, No. 6, 2009, pp. 861-876. doi:10.1089/neu.2008.0645
- J. E. Kennedy, F. O. Leal, J. D. Lewis, M. A. Cullen and R. R. Amador, “Posttraumatic Stress Symptoms in OIF/ OEF Service Members with Blast-Related and Non-BlastRelated Mild TBI,” NeuroRehabilitation, Vol. 26, No. 3, 2010, pp. 223-231.
- C. L. Mac Donald, A. M. Johnson, D. Cooper, et al., “Detection of Blast-Related Traumatic Brain Injury in US Military Personnel,” The New England Journal of Medicine, Vol. 364, No. 22, 2011, pp. 2091-2100. doi:10.1056/NEJMoa1008069
- J. H. Adams, D. Doyle, I. Ford, et al., “Diffuse Axonal Injury in Head Injury: Definition, Diagnosis and Grading,” Histopathology, Vol. 15, No. 1, 1989, pp. 49-59. doi:10.1111/j.1365-2559.1989.tb03040.x
- Y. Ezaki, K. Tsutsumi, M. Morikawa and I. Nagata, “Role of Diffusion-Weighted Magnetic Resonance Imaging in Diffuse Axonal Injury,” Acta Radiologicaogica, Vol. 47, No. 7, 2006, pp. 733-740. doi:10.1080/02841850600771486
- T. H. Le and A. D. Gean, “Neuroimaging of Traumatic Brain Injury,” Mount Sinai Journal of Medicine, Vol. 76, No. 2, 2009, pp. 145-162. doi:10.1002/msj.20102
- H. Lee, M. Wintermark, A. D. Gean, et al., “Focal Lesions in Acute Mild Traumatic Brain Injury and Neurocognitive Outcome: CT versus 3T MRI,” Journal of Neurotrauma, Vol. 25, No. 9, 2008, pp. 1049-1056. doi:10.1089/neu.2008.0566
- R. Scheid, K. Walther, T. Guthke, C. Preul and D. Y. von Cramon, “Cognitive Sequelae of Diffuse Axonal Injury,” Archives of Neurology, Vol. 63, No. 3, 2006, pp. 418-424. doi:10.1001/archneur.63.3.418
- E. D. Bigler, “Neuropsychology and Clinical Neuroscience of Persistent Post-Concussive Syndrome,” Journal of the International Neuropsychological Society, Vol. 14, No. 1, 2008, pp. 1-22. doi:10.1017/S135561770808017X
- C. Konrad, A. J. Geburek, F. Rist, et al., “Long-Term Cognitive and Emotional Consequences of Mild Traumatic Brain Injury,” Psychological Medicine, Vol. 41, No. 6, 2011, pp. 1197-1211.
- T. M. Talavage, E. Nauman, E. L. Breedlove, et al., “Functionally-Detected Cognitive Impairment in High School Football Players without Clinically-Diagnosed Concussion,” Journal of Neurotrauma, 1 October 2010. doi:10.1089/neu.2010.1512
- A. Messe, S. Caplain, G. Paradot, et al., “Diffusion Tensor Imaging and White Matter Lesions at the Subacute Stage in Mild Traumatic Brain Injury with Persistent Neurobehavioral Impairment,” Human Brain Mapping, Vol. 32, No. 6, 2011, pp. 999-1011. doi:10.1002/hbm.21092
- B. Jennett, J. H. Adams, L. S. Murray and D. I. Graham, “Neuropathology in Vegetative and Severely Disabled Patients after Head Injury,” Neurology, Vol. 56, No. 4, 2001, pp. 486-490. doi:10.1212/WNL.56.4.486
- A. Costanza, K. Weber, S. Gandy, et al., “Review: Contact Sport-Related Chronic Traumatic Encephalopathy in the Elderly: Clinical Expression and Structural Substrates,” Neuropathology and Applied Neurobiology, Vol. 37, No. 6, 2011, pp. 570-584. doi:10.1111/j.1365-2990.2011.01186.x
- P. M. Parizel, Ö. Özsarlak, J. W. Van Goethem, et al., “Imaging Findings in Diffuse Axonal Injury after Closed Head Trauma,” European Radiology, Vol. 8, No. 6, 1998, pp. 960-965. doi:10.1007/s003300050496
- P. M. Parizel, J. W. Van Goethem, Ö. Özsarlak, M. Maes and C. D. Phillips, “New Developments in the Neuroradiological Diagnosis of Craniocerebral Trauma,” European Radiology, Vol. 15, No. 3, 2005, pp. 569-581. doi:10.1007/s00330-004-2558-z
- L. R. Gentry, J. C. Godersky and B. H. Thompson, “Traumatic Brain Stem Injury: MR Imaging,” Radiology, Vol. 171, No. 1, 1989, pp. 177-187.
- J. R. Hesselink, C. F. Dowd, M. E. Healy, et al., “MR Imaging of Brain Contusions: A Comparative Study with CT,” American Journal of Roentgenology, Vol. 150, No. 5, 1988, pp. 1133-1142.
- L. R. Gentry, J. C. Godersky and B. Thompson, “MR Imaging of Head Trauma: Review of the Distribution and Radiopathologic Features of Traumatic Lesions,” American Journal of Roentgenology, Vol. 150, No. 3, 1988, pp. 663-672.
- D. Gadda, L. Carmignani, L. Vannucchi and A. Bindi, “Traumatic Lesions of Corpus Callosum: Early Multidetector CT Findings,” Neuroradiology, Vol. 46, No. 10, 2004, pp. 812-816. doi:10.1007/s00234-004-1250-y
- F. Tomaiuolo, G. A. Carlesimo, M. Di Paola, et al., “Gross Morphology and Morphometric Sequelae in the Hippocampus, Fornix, and Corpus Callosum of Patients with Severe Non-Missile Traumatic Brain Injury without Macroscopically Detectable Lesions: A T1 Weighted MRI Study,” Journal of Neurology, Neurosurgery & Psychiatry, Vol. 75, No. 9, 2004, pp. 1314-1322. doi:10.1136/jnnp.2003.017046
- Y. Yanagawa, Y. Itoh, T. Sakamoto, Y. Okada and A. M. Tokumaru, “Post-Traumatic Mutism Caused by Corpus Callosum Injury Diagnosed by Fluid-Attenuated Inversion Recovery on Magnetic Resonance Imaging,” The Journal of Trauma, Vol. 58, No. 3, 2005, pp. 631-633. doi:10.1097/01.TA.0000075801.73762.1B
- E. A. Wilde, Z. Chu, E. D. Bigler, et al., “Diffusion Tensor Imaging in the Corpus Callosum in Children After moderate to Severe Traumatic Brain Injury,” Journal of Neurotrauma, Vol. 23, No. 10, 2006, pp. 1412-1426. doi:10.1089/neu.2006.23.1412
- D. R. Rutgers, P. Fillard, G. Paradot, et al., “Diffusion Tensor Imaging Characteristics of the Corpus Callosum in mild, Moderate, and Severe Traumatic Brain Injury,” American Journal of Neuroradiology, Vol. 29, No. 9, 2008, pp. 1730-1735. doi:10.3174/ajnr.A1213
- D. C. Viano, I. R. Casson, E. J. Pellman, et al., “Concussion in Professional Football: Brain Responses by Finite Element Analysis: Part 9,” Neurosurgery, Vol. 57, No. 5, 2005, pp. 891-916.
- T. Hortobagyi, S. Wise, N. Hunt, et al., “Traumatic Axonal Damage in the Brain Can Be Detected Using BetaAPP Immunohistochemistry within 35 Min after Head Injury to Human Adults,” Neuropathology and Applied Neurobiology, Vol. 33, No. 2, 2007, pp. 226-237. doi:10.1111/j.1365-2990.2006.00794.x
- M. Inglese, S. Makani, G. Johnson, et al., “Diffuse Axonal Injury in Mild Traumatic Brain Injury: A Diffusion Tensor Imaging Study,” Journal of Neurosurgery, Vol. 103, No. 2, 2005, pp. 298-303. doi:10.3171/jns.2005.103.2.0298
- R. Scheid, C. Preul, O. Gruber, C. Wiggins and D. Y. von Cramon, “Diffuse Axonal Injury Associated with Chronic Traumatic Brain Injury: Evidence from T2*-Weighted Gradient-Echo Imaging at 3 T,” American Journal of Neuroradiology, Vol. 24, No. 6, 2003, pp. 1049-1056.
- W. W. Orrison, E. H. Hanson, T. Alamo, et al., “Traumatic Brain Injury: A Review and High-Field MRI Findings in 100 Unarmed Combatants Using A LiteratureBased Checklist Approach,” Journal of Neurotrauma, Vol. 26, No. 5, 2009, pp. 689-701. doi:10.1089/neu.2008.0636
- E. M. Haacke, Y. Xu, Y. C. Cheng and J. R. Reichenbach, “Susceptibility Weighted Imaging (SWI),” Magnetic Resonance in Medicine, Vol. 52, No. 3, 2004, pp. 612-618. doi:10.1002/mrm.20198
- K. A. Tong, S. Ashwal, A. Obenaus, et al., “Susceptibility-Weighted MR Imaging: A Review of Clinical Applications in Children,” American Journal of Neuroradiology, Vol. 29, No. 11, 2008, pp. 9-17. doi:10.3174/ajnr.A0786
- K. Kasahara, K. Hashimoto, M. Abo and A. Senoo, “Voxeland Atlas-Based Analysis of Diffusion Tensor Imaging May Reveal Focal Axonal Injuries in Mild Traumatic Brain Injury—Comparison with Diffuse Axonal Injury,” Magnetic Resonance Imaging, Vol. 30, No. 4, 2012, pp. 495-505. doi:10.1016/j.mri.2011.12.018
- M. Matsushita, K. Hosoda, Y. Naitoh, H. Yamashita and E. Kohmura, “Utility of Diffusion Tensor Imaging in the Acute Stage of Mild to Moderate Traumatic Brain Injury for Detecting White Matter Lesions and Predicting LongTerm Cognitive Function in Adults.” Journal of Neurosurgery, Vol. 115, No. 1, 2011, pp. 130-139. doi:10.3171/2011.2.JNS101547
- A. R. Mayer, J. Ling, M. V. Mannell, et al., “A Prospective Diffusion Tensor Imaging Study in Mild Traumatic Brain Injury,” Neurology, Vol. 74, No. 8, 2010, pp. 643- 650. doi:10.1212/WNL.0b013e3181d0ccdd
- H. S. Wortzel, M. F. Kraus, C. M. Filley, C. A. Anderson and D. B. Arciniegas, “Diffusion Tensor Imaging in Mild Traumatic Brain Injury Litigation,” The Journal of the American Academy of Psychiatry and the Law, Vol. 39, No. 4, 2011, pp. 511-523.
- R. T. Lange, G. L. Iverson, J. R. Brubacher, B. Madler and M. K. Heran, “Diffusion Tensor Imaging Findings Are Not Strongly Associated with Postconcussional Disorder 2 Months Following Mild Traumatic Brain Injury,” Journal of Head Trauma Rehabilitation, Vol. 27, No. 3, 2011, pp. 188-198.
- A. Einstein, “Collection of Papers Translated from the German,” Investigations on the Theory of Brownian Motion, Dover, New York, 1956.
- E. Stejskal and J. Tanner, “Spin Diffusion Measurements: Spin Echoes in the Presence of a Time-Dependent Field Gradient,” Journal of Chemical Physics, Vol. 42, No. 1, 1965, pp. 288-292. doi:10.1063/1.1695690
- T. L. Chenevert, J. A. Brunberg and J. G. Pipe, “Anisotropic Diffusion in Human White Matter: Demonstration with MR Techniques in Vivo,” Radiology, Vol. 177, No. 2, 1990, pp. 401-405.
- C. Pierpaoli, P. Jezzard, P. J. Basser, A. Barnett and G. Di Chiro, “Diffusion Tensor MR Imaging of the Human Brain,” Radiology, Vol. 201, No. 3, 1996, pp. 637-648.
- D. C. Alexander and G. J. Barker, “Optimal Imaging Parameters for Fiber-Orientation Estimation in Diffusion MRI,” Neuroimage, Vol. 27, No. 2, 2005, pp. 357-367. doi:10.1016/j.Neuroimage.2005.04.008
- P. A. Armitage and M. E. Bastin, “Utilizing the Diffusion-to-Noise Ratio to Optimize Magnetic Resonance Diffusion Tensor Acquisition Strategies for Improving Measurements of Diffusion Anisotropy,” Magnetic Resonance in Medicine, Vol. 45, No. 6, 2001, pp. 1056- 1065. doi:10.1002/mrm.1140
- K. M. Hasan, “A Framework for Quality Control and Parameter Optimization in Diffusion Tensor Imaging: Theoretical Analysis and Validation,” Magnetic Resonance Imaging, Vol. 25, No. 8, 2007, pp. 1196-1202. doi:10.1016/j.mri.2007.02.011
- D. K. Jones, M. A. Horsfield and A. Simmons, “Optimal Strategies for Measuring Diffusion in Anisotropic Systems by Magnetic Resonance Imaging,” Magnetic Resonance in Medicine, Vol. 42, No. 3, 1999, pp. 515-525. doi:10.1002/(SICI)1522-2594(199909)42:3<515::AID-MRM14>3.0.CO;2-Q
- P. J. Basser, J. Mattiello and D. Lebihan, “Estimation of the Effective Self-Diffusion Tensor from the NMR Spin Echo,” Journal of Magnetic Resonance, Series B, Vol. 103, No. 3, 1994, pp. 247-254. doi:10.1006/jmrb.1994.1037
- R. Salvador, A. Pena, D. K. Menon, et al., “Formal Characterization and Extension of the Linearized Diffusion Tensor Model,” Human Brain Mapping, Vol. 24, No. 2, 2005, pp. 144-155. doi:10.1002/hbm.20076
- K. M. Hasan, D. L. Parker and A. L. Alexander, “Comparison of Gradient Encoding Schemes for DiffusionTensor MRI,” Journal of Magnetic Resonance Imaging, Vol. 13, No. 5, 2001, pp. 769-780. doi:10.1002/jmri.1107
- N. G. Papadakis, C. D. Murrills, L. D. Hall, C. L. Huang and T. Adrian Carpenter, “Minimal Gradient Encoding for Robust Estimation of Diffusion Anisotropy,” Magnetic Resonance Imaging, Vol. 18, No. 6, 2000, pp. 671-679. doi:10.1016/S0730-725X(00)00151-X
- S. Skare, M. Hedehus, M. E. Moseley and T. Q. Li, “Condition Number as a Measure of Noise Performance of Diffusion Tensor Data Acquisition Schemes with MRI,” Journal of Magnetic Resonance, Vol. 147, No. 2, 2000, pp. 340-352. doi:10.1006/jmre.2000.2209
- D. Le Bihan, C. Poupon, A. Amadon and F. Lethimonnier, “Artifacts and Pitfalls in Diffusion MRI,” Journal of Magnetic Resonance Imaging, Vol. 24, No. 3, 2006, pp. 478-488. doi:10.1002/jmri.20683
- A. L. Alexander, J. S. Tsuruda and D. L. Parker, “Elimination of Eddy Current Artifacts in Diffusion-Weighted Echo-Planar Images: The Use of Bipolar Gradients,” Magnetic Resonance in Medicine, Vol. 38, No. 6, 1997, pp. 1016-1021. doi:10.1002/mrm.1910380623
- H. Bruder, H. Fischer, H. E. Reinfelder and F. Schmitt, “Image Reconstruction for Echo Planar Imaging with Nonequidistant K-Space Sampling,” Magnetic Resonance in Medicine, Vol. 23, No. 2, 1992, pp. 311-323. doi:10.1002/mrm.1910230211
- P. Mukherjee, J. I. Berman, S. W. Chung, C. P. Hess and R. G. Henry, “Diffusion Tensor MR Imaging and Fiber Tractography: Theoretic Underpinnings,” American Journal of Neuroradiology, Vol. 29, No. 4, 2008, pp. 632-641. doi:10.3174/ajnr.A1051
- P. Mukherjee, S. W. Chung, J. I. Berman, C. P. Hess and R. G. Henry, “Diffusion Tensor MR Imaging and Fiber Tractography: Technical Considerations,” American Journal of Neuroradiology, Vol. 29, No. 5, 2008, pp. 843-852. doi:10.3174/ajnr.A1052
- T. G. Reese, O. Heid, R. M. Weisskoff and V. J. Wedeen, “Reduction of Eddy-Current-Induced Distortion in Diffusion MRI Using a Twice-Refocused Spin Echo,” Magnetic Resonance in Medicine, Vol. 49, No. 1, 2003, pp. 177-182. doi:10.1002/mrm.10308
- D. K. Jones, “The Effect of Gradient Sampling Schemes on Measures Derived from Diffusion Tensor MRI: A Monte Carlo Study,” Magnetic Resonance in Medicine, Vol. 51, No. 4, 2004, pp. 807-815. doi:10.1002/mrm.20033
- L. Landmann, “Deconvolution Improves Colocalization Analysis of Multiple Fluorochromes in 3D Confocal Data Sets More Than Filtering Techniques,” Journal of Microscopy, Vol. 208, No. 2, 2002, pp. 134-147. doi:10.1046/j.1365-2818.2002.01068.x
- T. E. Conturo, R. C. McKinstry, E. Akbudak and B. H. Robinson, “Encoding of Anisotropic Diffusion with Tetrahedral Gradients: A General Mathematical Diffusion Formalism and Experimental Results,” Magnetic Resonance in Medicine, Vol. 35, No. 3, 1996, pp. 399-412. doi:10.1002/mrm.1910350319
- S. Brockstedt, M. Borg, B. Geijer, et al., “Triggering in Quantitative Diffusion Imaging with Single-Shot EPI,” Acta Radiologica, Vol. 40, No. 3, 1999, pp. 263-269. doi:10.3109/02841859909175552
- S. Skare and J. L. Andersson, “On the Effects of Gating in Diffusion Imaging of the Brain Using Single Shot EPI,” Magnetic Resonance Imaging, Vol. 19, No. 8, 2001, pp. 1125-1128. doi:10.1016/S0730-725X(01)00415-5
- M. Lazar and A. L. Alexander, “An Error Analysis of White Matter Tractography Methods: Synthetic Diffusion Tensor Field Simulations,” Neuroimage, Vol. 20, No. 2, 2003, pp. 1140-1153. doi:10.1016/S1053-8119(03)00277-5
- B. Stieltjes, W. E. Kaufmann, P. C. van Zijl, et al., “Diffusion Tensor Imaging and Axonal Tracking in the Human Brainstem,” Neuroimage, Vol. 14, No. 3, 2001, pp. 723-735. doi:10.1006/nimg.2001.0861
- S. Mori, W. E. Kaufmann, C. Davatzikos, et al., “Imaging Cortical Association Tracts in the Human Brain Using Diffusion-Tensor-Based Axonal Tracking,” Magnetic Resonance in Medicine, Vol. 47, No. 2, 2002, pp. 215-223. doi:10.1002/mrm.10074
- C. R. Jack Jr., M. A. Bernstein, N. C. Fox, et al., “The Alzheimer's Disease Neuroimaging Initiative (ADNI): MRI Methods,” Journal of Magnetic Resonance Imaging, Vol. 27, No. 4, 2008, pp. 685-691. doi:10.1002/jmri.21049
- C. H. Meyer, J. M. Pauly, A. Macovski and D. G. Nishimura, “Simultaneous Spatial and Spectral Selective Excitation,” Magnetic Resonance in Medicine, Vol. 15, No. 2, 1990, pp. 287-304. doi:10.1002/mrm.1910150211
- Z. Nagy and N. Weiskopf, “Efficient Fat Suppression by Slice-Selection Gradient Reversal in Twice-Refocused Diffusion Encoding,” Magnetic Resonance in Medicine, Vol. 60, No. 5, 2008, pp. 1256-1260. doi:10.1002/mrm.21746
- S. Lee and G. Wu, “A New Spectro-Spatial RF Pulse Design for High-Resolution Isotropic Diffusion Imaging,” Proceedings of the 19th ISMRM Scientific Meeting & Exhibition, 2011, p. 176.
- M. A. Griswold, P. M. Jakob, R. M. Heidemann, et al., “Generalized Autocalibrating Partially Parallel Acquisitions (GRAPPA),” Magnetic Resonance in Medicine, Vol. 47, No. 6, 2002, pp. 1202-1210. doi:10.1002/mrm.10171
- K. P. Pruessmann, M. Weiger, M. B. Scheidegger and P. Boesiger, “SENSE: Sensitivity Encoding for Fast MRI,” Magnetic Resonance in Medicine, Vol. 42, No. 5, 1999, pp. 952-962. doi:10.1002/(SICI)1522-2594(199911)42:5<952::AID-MRM16>3.0.CO;2-S
- P. Jezzard and R. S. Balaban, “Correction for Geometric Distortion in Echo Planar Images from B0 Field Variations,” Magnetic Resonance in Medicine, Vol. 34, No. 1, 1995, pp. 65-73. doi:10.1002/mrm.1910340111
- C. Poupon, C. A. Clark, V. Frouin, et al., “Regularization of Diffusion-Based Direction Maps for the Tracking of Brain White Matter Fascicles,” Neuroimage, Vol. 12, No. 2, 2000, pp. 184-195. doi:10.1006/nimg.2000.0607
- G. K. Rohde, A. S. Barnett, P. J. Basser, S. Marenco and C. Pierpaoli, “Comprehensive Approach for Correction of Motion and Distortion in Diffusion-Weighted MRI,” Magnetic Resonance in Medicine, Vol. 51, No. 1, 2004, pp. 103-114. doi:10.1002/mrm.10677
- J. Mattiello, P. J. Basser and D. Le Bihan, “The B Matrix in Diffusion Tensor Echo-Planar Imaging,” Magnetic Resonance in Medicine, Vol. 37, No. 2, 1997, pp. 292-300. doi:10.1002/mrm.1910370226
- M. Jenkinson and S. Smith, “A Global Optimisation Method for Robust Affine Registration of Brain Images,” Medical Image Analysis, Vol. 5, No. 2, 2001, pp. 143-156. doi:10.1016/S1361-8415(01)00036-6
- M. Wu, L. C. Chang, L. Walker, et al., “Comparison of EPI Distortion Correction Methods in Diffusion Tensor MRI Using a Novel Framework,” Medical Image Computing and Computer-Assisted Intervention, Vol. 11, Pt. 2, 2008, pp. 321-329.
- D. Holland, J. M. Kuperman and A. M. Dale, “Efficient Correction of Inhomogeneous Static Magnetic Field-Induced Distortion in Echo Planar Imaging,” Neuroimage, Vol. 50, No. 1, 2010, pp. 175-183. doi:10.1016/j.neuroimage.2009.11.044
- K. V. Embleton, H. A. Haroon, D. M. Morris, M. A. Ralph and G. J. Parker, “Distortion Correction for Diffusion-Weighted MRI Tractography and FMRI in the Temporal Lobes,” Human Brain Mapping, Vol. 31, No. 10, 2010, pp. 1570-1587. doi:10.1002/hbm.20959
- L. C. Chang, D. K. Jones and C. Pierpaoli, “RESTORE: Robust Estimation of Tensors by Outlier Rejection,” Magnetic Resonance in Medicine, Vol. 53, No. 5, 2005, pp. 1088-1095. doi:10.1002/mrm.20426
- J. F. Mangin, C. Poupon, C. Clark, D. Le Bihan and I. Bloch, “Distortion Correction and Robust Tensor Estimation for MR Diffusion Imaging,” Medical Image Analysis, Vol. 6, No. 3, 2002, pp. 191-198. doi:10.1016/S1361-8415(02)00079-8
- C. F. Westin, S. E. Maier, H. Mamata, et al., “Processing and Visualization for Diffusion Tensor MRI,” Medical Image Analysis, Vol. 6, No. 2, 2002, pp. 93-108. doi:10.1016/S1361-8415(02)00053-1
- R. A. Kanaan, S. S. Shergill, G. J. Barker, et al., “Tractspecific Anisotropy Measurements in Diffusion Tensor Imaging,” Psychiatry Research: Neuroimaging, Vol. 146, No. 1, 2006, pp. 73-82. doi:10.1016/j.pscychresns.2005.11.002
- Y. Zhou, F. C. Lin, J. Zhu, et al., “Whole Brain Diffusion Tensor Imaging Histogram Analysis in Vascular Cognitive Impairment,” Journal of the Neurological Sciences, Vol. 268, No. 1, 2008, pp. 60-64. doi:10.1016/j.jns.2007.11.005
- D. K. Jones, M. R. Symms, M. Cercignani and R. J. Howard, “The Effect of Filter Size on VBM Analyses of DT-MRI Data.” Neuroimage, Vol. 26, No. 2, 2005, pp. 546-554. doi:10.1016/j.neuroimage.2005.02.013
- S. M. Smith, M. Jenkinson, H. Johansen-Berg, et al., “Tract-Based Spatial Statistics: Voxelwise Analysis of Multi-Subject Diffusion Data,” Neuroimage, Vol. 31, No. 4, 2006, pp. 1487-1505. doi:10.1016/j.neuroimage.2006.02.024
- R. A. Edden and D. K. Jones, “Spatial and Orientational Heterogeneity in the Statistical Sensitivity of SkeletonBased Analyses of Diffusion Tensor MR Imaging Data,” Journal of Neuroscience Methods, Vol. 201, No. 1, 2011, pp. 213-219. doi:10.1016/j.jneumeth.2011.07.025
- H. Zhang, P. A. Yushkevich and J. C. Gee, “Deformable Registration of Diffusion Tensor MR Images with Explicit Orientation Optimization,” Medical Image Computing and Computer-Assisted Intervention, Vol. 3749, No. 8, 2005, pp. 172-179.
- Y. Cao, M. I. Miller, R. L. Winslow and L. Younes, “Large Deformation Diffeomorphic Metric Mapping of Vector Fields,” IEEE Transactions on Medical Imaging, Vol. 24, No. 9, 2005, pp. 1216-1230. doi:10.1109/TMI.2005.853923
- B. Avants, J. T. Duda, J. Kim, et al., “Multivariate Analysis of Structural and Diffusion Imaging in Traumatic Brain Injury,” Academic Radiology, Vol. 15, No. 12, 2008, pp. 1360- 1375. doi:10.1016/j.acra.2008.07.007
- Y. Wang, A. Gupta, Z. Liu, et al., “DTI Registration in Atlas Based Fiber Analysis of Infantile Krabbe Disease,” Neuroimage, Vol. 55, No. 4, 2011, pp. 1577-1586. doi:10.1016/j.neuroimage.2011.01.038
- P. A. Yushkevich, H. Zhang, T. J. Simon and J. C. Gee, “Structure-Specific Statistical Mapping of White Matter Tracts,” Neuroimage, Vol. 41, No. 2, 2008, pp. 448-461. doi:10.1016/j.neuroimage.2008.01.013
- S. Mori and P. C. van Zijl, “Fiber Tracking: Principles and Strategies—A Technical Review,” NMR in Biomedicine, Vol. 15, No. 7-8, 2002, pp. 468-480. doi:10.1002/nbm.781
- P. Fillard, C. Poupon and J. F. Mangin, “A Novel Global Tractography Algorithm Based on an Adaptive Spin Glass Model,” Medical Image Computing and ComputerAssisted Intervention, Vol. 12, No. 1, 2009, pp. 927-934.
- S. Jbabdi, M. W. Woolrich, J. L. Andersson and T. E. Behrens, “A Bayesian Framework for Global Tractography,” Neuroimage, Vol. 37, No. 1, 2007, pp. 116-129. doi:10.1016/j.neuroimage.2007.04.039
- G. J. Parker, H. A. Haroon and C. A. Wheeler-Kingshott, “A Framework for a Streamline-Based Probabilistic Index of Connectivity (PICo) Using a Structural Interpretation of MRI Diffusion Measurements,” Journal of Magnetic Resonance Imaging, Vol. 18, No. 2, 2003, pp. 242-254. doi:10.1002/jmri.10350
- T. E. Behrens, M. W. Woolrich, M. Jenkinson, et al., “Characterization and Propagation of Uncertainty in Diffusion-Weighted MR Imaging,” Magnetic Resonance in Medicine, Vol. 50, No. 5, 2003, pp. 1077-1088. doi:10.1002/mrm.10609
- B. W. Kreher, I. Mader and V. G. Kiselev, “Gibbs Tracking: A Novel Approach for the Reconstruction of Neuronal Pathways,” Magnetic Resonance in Medicine, Vol. 60, No. 4, 2008, pp. 953-963. doi:10.1002/mrm.21749
- ] M. Reisert, I. Mader, C. Anastasopoulos, et al., “Global Fiber Reconstruction Becomes Practical,” Neuroimage, Vol. 54, No. 2, 2011, pp. 955-962. doi:10.1016/j.neuroimage.2010.09.016
- A. W. Anderson, “Theoretical Analysis of the Effects of Noise on Diffusion Tensor Imaging,” Magnetic Resonance in Medicine, Vol. 46, No. 6, 2001, pp. 1174-1188. doi:10.1002/mrm.1315
- S, Aja-Fernandez, M. Niethammer, M. Kubicki, M. E. Shenton and C. F. Westin, “Restoration of DWI Data Using a Rician LMMSE Estimator,” IEEE Transaction of Medical Imaging, Vol. 27, No. 10, 2008, pp. 1389-1403. doi:10.1109/TMI.2008.920609
- A. Tristan-Vega and S. Aja-Fernandez, “DWI Filtering Using Joint Information for DTI and HARDI,” Medical Image Analysis, Vol. 14, No. 2, 2010, pp. 205-218. doi:10.1016/j.media.2009.11.001
- P. J. Basser, S. Pajevic, C. Pierpaoli, J. Duda and A. Aldroubi, “In vivo Fiber Tractography Using DT-MRI Data.” Magnetic Resonance in Medicine, Vol. 44, No. 4, 2000, pp. 625-632. doi:10.1002/1522-2594(200010)44:4<625::AID-MRM17>3.0.CO;2-O
- S. Mori, B. J. Crain, V. P. Chacko and P. C. van Zijl, “Three-Dimensional Tracking of Axonal Projections in the Brain by Magnetic Resonance Imaging,” Annals of Neurology, Vol. 45, No. 2, 1999, pp. 265-269. doi:10.1002/1531-8249(199902)45:2<265::AID-ANA21>3.0.CO;2-3
- M. Catani, R. J. Howard, S. Pajevic and D. K. Jones, “Virtual in Vivo Interactive Dissection of White Matter Fasciculi in the Human Brain,” Neuroimage, Vol. 17, No. 1, 2002, pp. 77-94. doi:10.1006/nimg.2002.1136
- J. D. Tournier, F. Calamante, M. D. King, D. G. Gadian and A. Connelly, “Limitations and Requirements of Diffusion Tensor Fiber Tracking: An Assessment Using Simulations,” Magnetic Resonance in Medicine, Vol. 47, No.4, 2002, pp. 701-708. doi:10.1002/mrm.10116
- T. E. Behrens, H. Johansen-Berg, M. W. Woolrich, et al., “Non-Invasive Mapping of Connections between Human Thalamus and Cortex Using Diffusion Imaging,” Nature Neuroscience, Vol. 6, No. 7, 2003 pp. 750-757. doi:10.1038/nn1075
- L. J. O’Donnell, M. Kubicki, M. E. Shenton, et al. “A Method for Clustering White Matter Fiber Tracts,” American Journal of Neuroradiology, Vol. 27, No. 5, 2006, pp. 1032-1036.
- L. J. O’Donnell and C. F. Westin, “Automatic Tractography Segmentation Using a High-Dimensional White Matter Atlas,” IEEE Transaction of Medical Imaging, Vol. 26, No. 11, 2007, pp. 1562-1575. doi:10.1109/TMI.2007.906785
- P. G. Batchelor, F. Calamante, J. D. Tournier, et al., “Quantification of the Shape of Fiber Tracts,” Magnetic Resonance in Medicine, Vol. 55, No. 4, 2006, pp. 894-903. doi:10.1002/mrm.20858
- C, Lenglet, M, Rousson and R. Deriche, “DTI Segmentation by Statistical Surface Evolution,” IEEE Transaction of Medical Imaging, Vol. 25, No. 6, 2006, pp. 685-700. doi:10.1109/TMI.2006.873299
- S. P. Awate, H. Zhang and J. C. Gee, “A Fuzzy, Nonparametric Segmentation Framework for DTI and MRI Analysis: With Applications to DTI-Tract Extraction,” IEEE Transaction of Medical Imaging, Vol. 26, No. 11, 2007, pp. 1525-1536. doi:10.1109/TMI.2007.907301
- S. Jbabdi, P. Bellec, R. Toro, et al., “Accurate Anisotropic Fast Marching for Diffusion-Based Geodesic Tractography,” International Journal of Biomedical Imaging, Vol. 2008, No. 2, 2008, p. 320195.
- J. D. Clayden, M. E. Bastin and A. J. Storkey, “Improved Segmentation Reproducibility in Group Tractography Using a Quantitative Tract Similarity Measure,” Neuroimage, Vol. 33, No. 2, 2006, pp. 482-492. doi:10.1016/j.neuroimage.2006.07.016
- J. D. Clayden, A. J. Storkey and M. E. Bastin, “A Probabilistic Model-Based Approach to Consistent White Matter Tract Segmentation,” IEEE Transaction of Medical Imaging, Vol. 26, No. 11, 2007, pp. 1555-1561. doi:10.1109/TMI.2007.905826
- M. Maddah, W. E. Grimson, S. K. Warfield and W. M. Wells, “A Unified Framework for Clustering and Quantitative Analysis of White Matter Fiber Tracts,” Medical Image Analysis, Vol. 12, No. 2, 2008, pp. 191-202. doi:10.1016/j.media.2007.10.003
- I. Eckstein, D. W. Shattuck, J. L. Stein, et al., “Active Fibers: Matching Deformable Tract Templates to Diffusion Tensor Images,” Neuroimage, Vol. 47, No. 2, 2009, pp. T82-T89. doi:10.1016/j.neuroimage.2009.01.065
- A. Leemans, J. Sijbers, S. De Backer, E. Vandervliet and P. Parizel, “Multiscale White Matter Fiber Tract Coregistration: A New Feature-Based Approach to Align Diffusion Tensor Data,” Magnetic Resonance in Medicine, Vol. 55, No. 6, 2006, pp. 1414-1423. doi:10.1002/mrm.20898
- S. Barbieri, M. H. Bauer, J. Klein, C. Nimsky and H. K. Hahn, “Segmentation of Fiber Tracts Based on an Accuracy Analysis on Diffusion Tensor Software Phantoms,” Neuroimage, Vol. 55, No. 2, 2011, pp. 532-544. doi:10.1016/j.neuroimage.2010.12.069
- P. L. Bazin, C. Ye, J. A. Bogovic, et al., “Direct Segmentation of the Major White Matter Tracts in Diffusion Tensor Images,” Neuroimage, Vol. 58, No. 2, 2011, pp. 458-468. doi:10.1016/j.neuroimage.2011.06.020
- A. Yendiki, P. Panneck, P. Srinivasan, et al., “Automated Probabilistic Reconstruction of White-Matter Pathways in Health and Disease Using an Atlas of the Underlying Anatomy,” Frontiers in Neuroinformatics, Vol. 5, No. 23, 2011, p. 23. doi:10.3389/fninf.2011.00023
- B. Fischl and A. M. Dale, “Measuring the Thickness of the Human Cerebral Cortex from Magnetic Resonance Images,” Proceedings of the National Academy of Sciences of USA, Vol. 97, No. 20, 2000, pp. 11050-11055. doi:10.1073/pnas.200033797
- B. Fischl, D. H. Salat, E. Busa, et al., “Whole Brain Segmentation: Automated Labeling of Neuroanatomical Structures in the Human Brain,” Neuron, Vol. 33, No. 3, 2002, pp. 341-355. doi:10.1016/S0896-6273(02)00569-X
- S. C. Partridge, P. Mukherjee, J. I. Berman, et al., “Tractography-Based Quantitation of Diffusion Tensor Imaging Parameters in White Matter Tracts of Preterm Newborns,” Journal of Magnetic Resonance Imaging, Vol. 22, No. 4, 2005, pp. 467-474. doi:10.1002/jmri.20410
- S. Wakana, A. Caprihan, M. M. Panzenboeck, et al., “Reproducibility of Quantitative Tractography Methods Applied to Cerebral White Matter,” Neuroimage, Vol. 36, No. 3, 2007, pp. 630-644. doi:10.1016/j.neuroimage.2007.02.049
- I. Corouge, P. T. Fletcher, S. Joshi, S. Gouttard and G. Gerig, “Fiber Tract-Oriented Statistics for Quantitative Diffusion Tensor MRI Analysis,” Medical Image Analysis, Vol. 10, No. 5, 2006, pp. 786-798. doi:10.1016/j.media.2006.07.003
- S. W. Davis, N. A. Dennis, N. G. Buchler, et al., “Assessing the Effects of Age on Long White Matter Tracts Using Diffusion Tensor Tractography,” Neuroimage, Vol. 46, No. 2, 2009, pp. 530-541. doi:10.1016/j.neuroimage.2009.01.068
- C. B. Goodlett, P. T. Fletcher, J. H. Gilmore and G. Gerig, “Group Analysis of DTI Fiber Tract Statistics with Application to Neurodevelopment,” Neuroimage, Vol. 45, No. 1, 2009, pp. S133-S142. doi:10.1016/j.neuroimage.2008.10.060
- J. B. Colby, L. Soderberg, C. Lebel, et al., “Along-Tract Statistics Allow for Enhanced Tractography Analysis,” Neuroimage, Vol. 59, No. 4, 2012, pp. 3227-3242. doi:10.1016/j.neuroimage.2011.11.004
- T. B. Dyrby, L. V. Sogaard, G. J. Parker, et al., “Validation of in Vitro Probabilistic Tractography,” Neuroimage, Vol. 37, No. 4, 2007, pp. 1267-1277. doi:10.1016/j.neuroimage.2007.06.022
- J. D. Clarke, “Using Fluorescent Dyes for Fate Mapping, Lineage Analysis, and Axon Tracing in the Chick Embryo,” Methods in Molecular Biology, Vol. 461, 2008, pp. 351-361.
- E. Tardif and S. Clarke, “Intrinsic Connectivity of Human Auditory Areas: A Tracing Study with DiI,” European Journal of Neuroscience, Vol. 13, No. 5, 2001, pp. 1045- 1050. doi:10.1046/j.0953-816x.2001.01456.x
- W. Feller, “An Introduction to Probability Theory and Its Applications,” Second Edition, John Wiley & Sons, New York, 1971.
- P. J. Basser, “Inferring Microstructural Features and the Physiological State of Tissues from Diffusion-Weighted Images,” NMR in Biomedicine, Vol. 8, No. 7, 1995, pp. 333-344. doi:10.1002/nbm.1940080707
- D. S. Grebenkov, “NMR Survey of Reflected Brownian Motion,” Reviews of Modern Physics, Vol. 79, No. 3, 2007, pp. 1077-1137. doi:10.1103/RevModPhys.79.1077
- D. C. Alexander, G. J. Barker and S. R. Arridge, “Detection and Modeling of Non-Gaussian Apparent Diffusion Coefficient Profiles in Human Brain Data,” Magnetic Resonance in Medicine, Vol. 48, No. 2, 2002, pp. 331-340. doi:10.1002/mrm.10209
- Y. Assaf and P. J. Basser, “Composite Hindered and Restricted Model of Diffusion (CHARMED) MR Imaging of the Human Brain,” Neuroimage, Vol. 27, No. 1, 2005, pp. 48-58. doi:10.1016/j.neuroimage.2005.03.042
- Y. Assaf and Y. Cohen, “Assignment of the Water SlowDiffusing Component in the Central Nervous System Using Q-Space Diffusion MRS: Implications for Fiber Tract Imaging,” Magnetic Resonance in Medicine, Vol. 43, No. 2, 2000, pp. 191-199. doi:10.1002/(SICI)1522-2594(200002)43:2<191::AID-MRM5>3.0.CO;2-B
- C. Beaulieu, “The Basis of Anisotropic Water Diffusion in the Nervous System—A Technical Review,” NMR in Biomedicine, Vol. 15, No. 7-8, 2002, pp. 435-455. doi:10.1002/nbm.782
- J. H. Jensen, J. A. Helpern, A. Ramani, H. Lu and K. Kaczynski, “Diffusional Kurtosis Imaging: The Quantification of Non-Gaussian Water Diffusion by Means of Magnetic Resonance Imaging,” Magnetic Resonance in Medicine, Vol. 53, No. 6, 2005, pp. 1432-1440. doi:10.1002/mrm.20508
- C. A. Clark and D. Le Bihan, “Water Diffusion Compartmentation and Anisotropy at High B Values in the Human Brain,” Magnetic Resonance in Medicine, Vol. 44, No. 6, 2000, pp. 852-859. doi:10.1002/1522-2594(200012)44:6<852::AID-MRM5>3.0.CO;2-A
- M. C. DeLano and Y. Cao, “High B-Value Diffusion Imaging,” Neuroimaging Clinics of North America, Vol. 12, No. 1, 2002, pp. 21-34. doi:10.1016/S1052-5149(03)00068-6
- T. Niendorf, R. M. Dijkhuizen, D. G. Norris, M. van Lookeren Campagne and K. Nicolay, “Biexponential Diffusion Attenuation in Various States of Brain Tissue: Implications for Diffusion-Weighted Imaging,” Magnetic Resonance in Medicine, Vol. 36, No. 6, 1996, pp. 847-857. doi:10.1002/mrm.1910360607
- Y. Assaf and Y. Cohen, “Non-Mono-Exponential Attenuation of Water and N-Acetyl Aspartate Signals Due to Diffusion in Brain Tissue,” Journal of Magnetic Resonance, Vol. 131, No. 2, 1998, pp. 69-85. doi:10.1006/jmre.1997.1313
- T. E. Behrens, H. J. Berg, S. Jbabdi, M. F. Rushworth and M. W. Woolrich, “Probabilistic Diffusion Tractography with Multiple Fibre Orientations: What Can We Gain?” Neuroimage, Vol. 34, No. 2007, pp. 144-155. doi:10.1016/j.neuroimage.2006.09.018
- B. Jeurissen, A. Leemans, J. Tournier, D. K. Jones and J. Sijbers, “Estimating the Number of Fiber Orientations in Diffusion MRI Voxels: A Constrained Spherical Deconvolution Study,” Stockholm, Sweden, 2010.
- D. S. Tuch, T. G. Reese, M. R. Wiegell, et al., “High Angular Resolution Diffusion Imaging Reveals Intravoxel White Matter Fiber Heterogeneity,” Magnetic Resonance in Medicine, Vol. 48, No. 4, 2002, pp. 577-582. doi:10.1002/mrm.10268
- J. D. Tournier, F. Calamante, D. G. Gadian and A. Connelly, “Direct Estimation of the Fiber Orientation Density Function from Diffusion-Weighted MRI Data Using Spherical Deconvolution,” Neuroimage, Vol. 23, No. 3, 2004, pp. 1176-1185. doi:10.1016/j.neuroimage.2004.07.037
- T. S. Yo, A. Anwander, M. Descoteaux, et al., “Quantifying Brain Connectivity: A Comparative Tractography Study,” Medical Image Computing and Computer-Assisted Intervention, Vol. 12, Pt. 1, 2009, pp. 886-893.
- P. T. Callaghan, C. D. Eccles and Y. Xia, “NMR Microscopy of Dynamic Displacements: K-Space and Q-Space Imaging,” Journal of Physics E: Scientific Instruments, Vol. 21, No. 8, 1988, pp. 820-822.
- D. S. Tuch, “Q-Ball Imaging,” Magnetic Resonance in Medicine, Vol. 52, No. 6, 2004, pp. 1358-1372. doi:10.1002/mrm.20279
- P. T. Callaghan, C. D. Eccles and Y. Xia, “NMR Microscopy of Dynamic Displacements: K-Space and Q-Space Imaging,” Journal of Physics E: Scientific Instruments, Vol. 21, No. 8, 1988, pp. 820-822. doi:10.1088/0022-3735/21/8/017
- E. Ozarslan, T. M. Shepherd, B. C. Vemuri, S. J. Blackband and T. H. Mareci, “Resolution of Complex Tissue Microarchitecture Using the Diffusion Orientation Transform (DOT),” Neuroimage, Vol. 31, No. 3, 2006, pp. 1086-1103. doi:10.1016/j.neuroimage.2006.01.024
- K. M. Jansons and D. C. Alexander, “Persistent Angular Structure: New Insights from Diffusion MRI Data. Dummy Version,” Information Processing in Medical Imaging, Vol. 18, 2003, pp. 672-683. doi:10.1007/978-3-540-45087-0_56
- M. Lazar, J. H. Jensen, L. Xuan and J. A. Helpern, “Estimation of the Orientation Distribution Function from Diffusional Kurtosis Imaging,” Magnetic Resonance in Medicine, Vol. 60, No. 4, 2008, pp. v774-v781. doi:10.1002/mrm.21725
- E. Ozarslan and T. H. Mareci, “Generalized Diffusion Tensor Imaging and Analytical Relationships between Diffusion Tensor Imaging and High Angular Resolution Diffusion Imaging,” Magnetic Resonance in Medicine Vol. 50, No. 5, 2003, pp. 955-965.
- A. W. Anderson, “Measurement of Fiber Orientation Distributions Using High Angular Resolution Diffusion Imaging,” Magnetic Resonance in Medicine, Vol. 54, No. 5, 2005, pp. 1194-1206. doi:10.1002/mrm.20667
- T. B. Leergaard, N. S. White, A. de Crespigny, et al., “Quantitative Histological Validation of Diffusion MRI Fiber Orientation Distributions in the Rat Brain,” PLoS One, Vol. 5, No. 1, 2010, p. e8595. doi:10.1371/journal.pone.0008595
- V. Patel, Y. Shi, P. M. Thompson and A. W. Toga, “Mesh-Based Spherical Deconvolution: A Flexible Approach to Reconstruction of Non-Negative Fiber Orientation Distributions,” Neuroimage, Vol. 51, No. 3, 2010, pp. 1071-1081. doi:10.1016/j.neuroimage.2010.02.060
- K. E. Sakaie and M. J. Lowe, “An Objective Method for Regularization of Fiber Orientation Distributions Derived from Diffusion-Weighted MRI,” Neuroimage, Vol. 34, No. 1, 2007, pp. 169-176. doi:10.1016/j.neuroimage.2006.08.034
- B. Jian and B. C. Vemuri, “A Unified Computational Framework for Deconvolution to Reconstruct Multiple Fibers from Diffusion Weighted MRI,” IEEE Transaction of Medical Imaging, Vol. 26, No. 11, 2007, pp. 1464- 1471. doi:10.1109/TMI.2007.907552
- J. D. Tournier, C. H. Yeh, F. Calamante, et al., “Resolving Crossing Fibres Using Constrained Spherical Deconvolution: Validation Using Diffusion-Weighted Imaging Phantom Data,” Neuroimage, Vol. 42, No. 2, 2008, pp. 617-625. doi:10.1016/j.neuroimage.2008.05.002
- B. W. Kreher, J. F. Schneider, I. Mader, et al., “Multitensor Approach for Analysis and Tracking of Complex Fiber Configurations,” Magnetic Resonance in Medicine, Vol. 54, No. 5, 2005, pp. 1216-1225. doi:10.1002/mrm.20670
- F. Dell’Acqua, G. Rizzo, P. Scifo, et al., “A Model-Based Deconvolution Approach to Solve Fiber Crossing in Diffusion-Weighted MR Imaging,” IEEE Transactions on Bio-Medical Engineering, Vol. 54, No. 3, 2007, pp. 462- 472. doi:10.1109/TBME.2006.888830
- J. D. Tournier, F. Calamante and A. Connelly, “Robust Determination of the Fibre Orientation Distribution in Diffusion MRI: Non-Negativity Constrained Super-Resolved Spherical Deconvolution,” Neuroimage, Vol. 35, No. 4, 2007, pp. 1459-1472. doi:10.1016/j.neuroimage.2007.02.016
- C. Liu, R. Bammer, B. Acar and M. E. Moseley, “Characterizing Non-Gaussian Diffusion by Using Generalized Diffusion Tensors,” Magnetic Resonance in Medicine, Vol. 51, No. 5, 2004, pp. 924-937. doi:10.1002/mrm.20071
- D. C. Alexander, “Multiple-Fiber Reconstruction Algorithms for Diffusion MRI,” Annals of the New York Academy of Sciences, Vol. 1064, 2005, pp. 113-133. doi:10.1196/annals.1340.018
- J. T. Povlishock and E. H. Pettus, “Traumatically Induced Axonal Damage: Evidence for Enduring Changes in Axolemmal Permeability with Associated Cytoskeletal Change,” Acta Neurochirurgicaurgica Supplement, Vol. 66, 1996, pp. 81-86.
- A. Buki and J. T. Povlishock, “All Roads Lead to Disconnection?—Traumatic Axonal Injury Revisited,” Acta Neurochirurgica, Vol. 148, No. 2, 2006, pp. 181-193. doi:10.1007/s00701-005-0674-4
- R. W. Shin, T. Iwaki, T. Kitamoto and J. Tateishi, “Hydrated Autoclave Pretreatment Enhances Tau Immunoreactivity in Formalin-Fixed Normal and Alzheimer’s Disease Brain Tissues,” Laboratory Investigation; A Journal of Technical Methods and Pathology, Vol. 64, No. 5, 1991, pp. 693-702.
- M. Goedert, M. G. Spillantini, R. Jakes, D. Rutherford and R. A. Crowther, “Multiple Isoforms of Human Microtubule-Associated Protein Tau: Sequences and Localization in Neurofibrillary Tangles of Alzheimer’s Disease,” Neuron, Vol. 3, No. 4, 1989, pp. 519-526. doi:10.1016/0896-6273(89)90210-9
- M. Goedert, C. M. Wischik, R. A. Crowther, J. E. Walker and A. Klug, “Cloning and Sequencing of the CDNA Encoding a Core Protein of the Paired Helical Filament of Alzheimer Disease: Identification as the MicrotubuleAssociated Protein Tau,” Proceedings of the National Academy of Sciences of USA, Vol. 85, No. 11, 1988, pp. 4051-4055. doi:10.1073/pnas.85.11.4051
- A. Alonso, T. Zaidi, M. Novak, I. Grundke-Iqbal and K. Iqbal, “Hyperphosphorylation Induces Self-Assembly of Tau into Tangles of Paired Helical Filaments/Straight Filaments,” Proceedings of the National Academy of Sciences of USA, Vol. 98, No. 12, 2001, pp. 6923-6928. doi:10.1073/pnas.121119298
- S. T. DeKosky, M. D. Ikonomovic and S. Gandy, “Traumatic Brain Injury: Football, Warfare, and Long-Term Effects,” Minnesota medicine, Vol. 93, No. 12, 2010, pp. 46-47.
- S. Magnoni, T. J. Esparza, V. Conte, et al., “Tau Elevations in the Brain Extracellular Space Correlate with Reduced Amyloid-Beta Levels and Predict Adverse Clinical Outcomes after Severe Traumatic Brain Injury,” Brain, Vol. 135, No. 4, 2012, pp. 1268-1280.
- S. D. Ginsberg, “Alterations in Discrete Glutamate Receptor Subunits in Adult Mouse Dentate Gyrus Granule Cells Following Perforant Path Transection,” Analytical and Bioanalytical Chemistry, Vol. 397, No. 8, 2010, pp. 3349-3358. doi:10.1007/s00216-010-3826-1
- S. D. Ginsberg and L. J. Martin, “Axonal Transection in Adult Rat Brain Induces Transsynaptic Apoptosis and Persistent Atrophy of Target Neurons,” Journal of Neurotrauma, Vol. 19, No. 1, 2002, pp. 99-109. doi:10.1089/089771502753460277
- S. Przedborski, M. Vila and V. Jackson-Lewis, “Neurodegeneration: What Is It and Where Are We?” The Journal of Clinical Investigation, Vol. 111, No. 1, 2003, pp. 3-10.
- S. N. Niogi and P. Mukherjee, “Diffusion Tensor Imaging of Mild Traumatic Brain Injury,” Journal of Head Trauma Rehabilitation, Vol. 25, No. 4, 2010, pp. 241-255. doi:10.1097/HTR.0b013e3181e52c2a
- H. Iizuka, K. Sakatani and W. Young, “Corticofugal Axonal Degeneration in Rats after Middle Cerebral Artery Occlusion,” Stroke, Vol. 20, No. 10, 1989, pp. 1396-1402. doi:10.1161/01.STR.20.10.1396
- G. Thomalla, V. Glauche, C. Weiller and J. Rother, “Time Course of Wallerian Degeneration after is Chaemic Stroke Revealed by Diffusion Tensor Imaging,” Journal of Neurology, Neurosurgery & Psychiatry, Vol. 76, No. 2, 2005, pp. 266-268. doi:10.1136/jnnp.2004.046375
- C. Pierpaoli, A. Barnett, S. Pajevic, et al., “Water Diffusion Changes in Wallerian Degeneration and Their Dependence on White Matter Architecture,” Neuroimage, Vol. 13, No. 6, 2001, pp. 1174-1185. doi:10.1006/nimg.2001.0765
- A. Gass, T. Niendorf and J. G. Hirsch, “Acute and Chronic Changes of the Apparent Diffusion Coefficient in Neurological Disorders—Biophysical Mechanisms and Possible Underlying Histopathology,” Journal of the Neurological Sciences, Vol. 186, Suppl. 1, 2001, pp. S15- S23. doi:10.1016/S0022-510X(01)00487-7
- C. H. Sotak, “Nuclear Magnetic Resonance (NMR) Measurement of the Apparent Diffusion Coefficient (ADC) of Tissue Water and Its Relationship to Cell Volume Changes in Pathological States,” Neurochemistry International, Vol. 45, No. 4, 2004, pp. 569-582. doi:10.1016/j.neuint.2003.11.010
- P. J. Basser and C. Pierpaoli, “Microstructural and Physiological Features of Tissues Elucidated by Quantitative-Diffusion-Tensor MRI,” Journal of Magnetic Resonance, Series B, Vol. 111, No. 3, 1996, pp. 209-219. doi:10.1006/jmrb.1996.0086
- S. K. Song, S. W. Sun, W. K. Ju, et al., “Diffusion Tensor Imaging Detects and Differentiates Axon and Myelin Degeneration in Mouse Optic Nerve after Retinal Ischemia,” Neuroimage, Vol. 20, No. 3, 2003, pp. 1714-1722. doi:10.1016/j.Neuroimage,.2003.07.005
- R. Ito, S. Mori and E. R. Melhem, “Diffusion Tensor Brain Imaging and Tractography,” Neuroimaging Clinics of North America, Vol. 12, No. 1, 2002, pp. 1-19. doi:10.1016/S1052-5149(03)00067-4
- C. A. Wheeler-Kingshott and M. Cercignani, “About ‘Axial’ and ‘Radial’ Diffusivities,” Magnetic Resonance in Medicine, Vol. 61, No. 5, 2009, pp. 1255-1260. doi:10.1002/mrm.21965
- K. Arfanakis, V. M. Haughton, J. D. Carew, et al., “Diffusion Tensor MR Imaging in Diffuse Axonal Injury,” American Journal of Neuroradiology, Vol. 23, No. 5, 2002, pp. 794-802.
- R. R. Benson, S. A. Meda, S. Vasudevan, et al., “Global White Matter Analysis of Diffusion Tensor Images is Predictive of Injury Severity in Traumatic Brain Injury,” Journal of Neurotrauma, Vol. 24, No. 3, 2007, pp. 446-459. doi:10.1089/neu.2006.0153
- L. Miles, R. I. Grossman, G. Johnson, et al., “Short-Term DTI Predictors of Cognitive Dysfunction in Mild Traumatic Brain Injury,” Brain Injury, Vol. 22, No. 2, 2008, pp. 115-122. doi:10.1080/02699050801888816
- M. L. Lipton, E. Gulko, M. E. Zimmerman, et al., “Diffusion-Tensor Imaging Implicates Prefrontal Axonal Injury in Executive Function Impairment Following Very Mild Traumatic Brain Injury,” Radiology, Vol. 252, No. 3, 2009, pp. 816-824. doi:10.1148/radiol.2523081584
- T. A. Huisman, L. H. Schwamm, P. W. Schaefer, et al., “Diffusion Tensor Imaging as Potential Biomarker of White Matter Injury in Diffuse Axonal Injury,” American Journal of Neuroradiology, Vol. 25, No. 3, 2004, pp. 370-376.
- J. J. Bazarian, J. Zhong, B. Blyth, et al., “Diffusion Tensor Imaging Detects Clinically Important Axonal Damage after Mild Traumatic Brain Injury: A Pilot Study,” Journal of Neurotrauma, Vol. 24, No. 9, 2007, pp. 1447-1459. doi:10.1089/neu.2007.0241
- E. A. Wilde, S. R. McCauley, A. Barnes, et al., “Serial Measurement of Memory and Diffusion Tensor Imaging Changes within the First Week Following Uncomplicated Mild Traumatic Brain Injury,” Brain Imaging and Behavior, Vol. 6, No. 2, 2012, pp. 319-328. doi:10.1007/s11682-012-9174-3
- A. Marmarou, “Traumatic Brain Edema: An Overview,” Acta Neurochirurgicaurgica Supplement, Vol. 60, No. 6, 1994, pp. 421-424. doi:10.1002/mrm.1910360612
- C. Pierpaoli and P. J. Basser, “Toward a Quantitative Assessment of Diffusion Anisotropy,” Magnetic Resonance in Medicine, Vol. 36, No. 6, 1996, pp. 893-906.
- M. Singh, J. Jeong, D. Hwang, W. Sungkarat and P. Gruen, “Novel Diffusion Tensor Imaging Methodology to Detect and Quantify Injured Regions and Affected Brain Pathways in Traumatic Brain Injury,” Magnetic Resonance Imaging, Vol. 28, No. 1, 2010, pp. 22-40. doi:10.1016/j.mri.2009.05.049
- S. N. Niogi, P. Mukherjee, J. Ghajar, et al., “Extent of Microstructural White Matter Injury in Postconcussive Syndrome Correlates with Impaired Cognitive Reaction Time: A 3T Diffusion Tensor Imaging Study of Mild Traumatic Brain Injury,” American Journal of Neuroradiology, Vol. 29, No. 5, 2008, pp. 967-973. doi:10.3174/ajnr.A0970
- D. R. Rutgers, F. Toulgoat, J. Cazejust, et al., “White Matter Abnormalities in Mild Traumatic Brain Injury: A Diffusion Tensor Imaging Study,” American Journal of Neuroradiology, Vol. 29, No. 3, 2008, pp. 514-519. doi:10.3174/ajnr.A0856
- C. Lo, K. Shifteh, T. Gold, J. A. Bello and M. L. Lipton, “Diffusion Tensor Imaging Abnormalities in Patients with Mild Traumatic Brain Injury and Neurocognitive Impairment,” Journal of Computer Assisted Tomography, Vol. 33, No. 2, 2009, pp. 293-297. doi:10.1097/RCT.0b013e31817579d1
- R. Kumar, R. K. Gupta, M. Husain, et al., “Comparative Evaluation of Corpus Callosum DTI Metrics in Acute Mild and Moderate Traumatic Brain Injury: Its Correlation with Neuropsychometric Tests,” Brain Injury, Vol. 23, No. 7-8, 2009, pp. 675-685. doi:10.1080/02699050903014915
- M. F. Kraus, T. Susmaras, B. P. Caughlin, et al., “White Matter Integrity and Cognition in Chronic Traumatic Brain Injury: A Diffusion Tensor Imaging Study,” Brain, Vol. 130, No. 10, 2007, pp. 2508-2519. doi:10.1093/brain/awm216
- M. E. Shenton, H. M. Hamoda, J. S. Schneiderman, et al., “A Review of Magnetic Resonance Imaging and Diffusion Tensor Imaging Findings in Mild Traumatic Brain Injury,” Brain Imaging and Behavior, Vol. 6, No. 2, 2012, pp. 137-192. doi:10.1007/s11682-012-9156-5
- L. M. French, “Military Traumatic Brain Injury: An Examination of Important Differences,” Annals of the New York Academy of Sciences, Vol. 1208, 2010, pp. 38-45. doi:10.1111/j.1749-6632.2010.05696.x
- M. Chavko, W. A. Koller, W. K. Prusaczyk and R. M. McCarron, “Measurement of Blast Wave by a Miniature Fiber Optic Pressure Transducer in the Rat Brain,” Journal of Neuroscience Methods, Vol. 159, No. 2, 2007, pp. 277-281. doi:10.1016/j.jneumeth.2006.07.018
- S. Connell, J. Gao, J. Chen and R. Shi, “Novel Model to Investigate Blast Injury in the Central Nervous System,” Journal of Neurotrauma, Vol. 28, No. 7, 2011, pp. 1229- 1236. doi:10.1089/neu.2011.1832
- I. Cernak, R. Vink, D. N. Zapple, et al., “The Pathobiology of Moderate Diffuse Traumatic Brain Injury as Identified Using a New Experimental Model of Injury in Rats,” Neurobiology of Disease, Vol. 17, No. 1, 2004, pp. 29-43. doi:10.1016/j.nbd.2004.05.011
- I. Cernak, Z. Wang, J. Jiang, X. Bian and J. Savic, “Ultrastructural and Functional Characteristics of Blast Injury-Induced Neurotrauma,” The Journal of Trauma, Vol. 50, No. 4, 2001, pp. 695-706. doi:10.1097/00005373-200104000-00017
- A. Saljo, F. Bao, J. Shi, et al., “Expression of C-Fos and C-Myc and Deposition of Beta-APP in Neurons in the Adult Rat Brain as a Result of Exposure to Short-Lasting Impulse Noise,” Journal of Neurotrauma, Vol. 19, No. 3, 2002, pp. 379-385. doi:10.1089/089771502753594945
- Y. Bhattacharjee, “Neuroscience. Shell Shock Revisited: Solving the Puzzle of Blast Trauma,” Science, Vol. 319, No. 5862, 2008, pp. 406-408. doi:10.1126/science.319.5862.406
- I. Cernak, “The Importance of Systemic Response in the Pathobiology of Blast-Induced Neurotrauma,” Frontiers in Neurology, Vol. 1, 2010, p. 151.
- V. Newcombe, G. Williams, J. Outtrim, et al., “Serial Diffusion Tensor Imaging Suggests Progressive Pathophysiology for Weeks Following Traumatic Brain Injury, and Possible White Matter Repair Months after Injury,” Proceedings of the 19th ISMRM Scientific Meeting & Exhibition, 2011, p. 4211.
- F.-P. G. Yang, C. Shetty, H. Lee, et al., “A Longitudinal Study of Microstructural White Matter Changes after Mild Traumatic Brain Injury,” Proceedings of the 19th ISMRM Scientific Meeting & Exhibition, 2011, p. 346.
- M. L. Lipton, N. Kim, Y. K. Park, et al., “Robust Detection of Traumatic Axonal Injury in Individual Mild Traumatic Brain Injury Patients: Intersubject Variation, Change over Time and Bidirectional Changes in Anisotropy,” Brain Imaging and Behavior, Vol. 6, No. 2, 2012, pp. 329-342. doi:10.1007/s11682-012-9175-2
- Z. Kou, Z. Wu, K. A. Tong, et al., “The Role of Advanced MR Imaging Findings as Biomarkers of Traumatic Brain Injury,” Journal of Head Trauma Rehabilitation, Vol. 25, No. 4, 2010, pp. 267-282. doi:10.1097/HTR.0b013e3181e54793
- R. W. Van Boven, G. S. Harrington, D. B. Hackney, et al., “Advances in Neuroimaging of Traumatic Brain Injury and Posttraumatic Stress Disorder,” Journal of Rehabilitation Research and Development, Vol. 46, No. 6, 2009, pp. 717-757. doi:10.1682/JRRD.2008.12.0161
- K. Zhang, B. Johnson, D. Pennell, et al., “Are Functional Deficits in Concussed Individuals Consistent with White Matter Structural Alterations: Combined FMRI & DTI Study,” Experimental Brain Research, Vol. 204, No. 1, 2010, pp. 57-70. doi:10.1007/s00221-010-2294-3
- H. S. Levin, E. Wilde, M. Troyanskaya, et al., “Diffusion Tensor Imaging of Mild to Moderate Blast-Related Traumatic Brain Injury and Its Sequelae,” Journal of Neurotrauma, Vol. 27, No. 4, 2010, pp. 683-694. doi:10.1089/neu.2009.1073
- M. Catani, “Diffusion Tensor Magnetic Resonance Imaging Tractography in Cognitive Disorders,” Current Opinion in Neurology, Vol. 19, No. 6, 2006, pp. 599-606. doi:10.1097/01.wco.0000247610.44106.3f
NOTES
*Corresponding author.
1Equation (3) is only valid for narrow gradient pulses.