Open Journal of Orthopedics
Vol.2 No.2(2012), Article ID:20110,6 pages DOI:10.4236/ojo.2012.22007
Direct Visualisation of the Depth-Dependent Mechanical Properties of Full-Thickness Articular Cartilage*
![]()
1Division of Biomedical Sciences, St George’s University of London, London, UK; 2Department of Physics, Oakland University, Rochester, USA.
Email: #mszarko@sgul.ac.uk, xia@oakland.edu
Received December 19th, 2011; revised March 8th, 2012; accepted March 18th, 2012
Keywords: Depth-Dependent Properties; Articular Cartilage; Cartilage Mechanics
ABSTRACT
Objective: The structural anisotropy of articular cartilage controls its deformation response. As proteoglycans and collagen vary with depth, simple uniaxial compression results in inhomogeneous deformation with distinct depth-dependent mechanical properties. Investigations into depth-dependent mechanical properties of articular cartilage have previously required tissue modification after specimen isolation. Such modifications include histological processes, freezing, subchondral bone removal, and fluorescent staining that may alter the tissue, limiting in vivo applicability. Design: Using a custom tissue-sectioning device, 0.1 mm thick unfixed, unstained, osetochondral samples were obtained. A customized apparatus loaded samples to 12.5%, 24%, and 29% compression in under a microscope with 10× magnification. Equilibrium load was measured after stress relaxation. Intra-tissue displacement was measured by tracing groups of cells between the different compression levels using a digital imaging program. Cell distance from the subchondral bone was measured to identify intra-tissue displacement and calculate strain. Results: The results reveal that stress levels and intra-tissue displacement increased with greater tissue compression (p < 0.05). Intra-tissue displacement decreased as depth from the articular surface increased (p < 0.01). This occurred for each level of tissue compression. Overall compressive resistance is seen to increase with depth from the articular surface. Conclusions: The current study identifies a method directly visualising and assessing the depth-dependent structural response to compression. The ability to avoid tissue modification after specimen isolation, allows this procedure to more closely approximate in vivo conditions and may provide an important method for analyzing the coordinated changes in cartilage composition and function due to ageing and disease.
1. Introduction
Articular cartilage is a complex connective tissue with a depth-dependent extracellular structure. Structural nonuniformities within the tissue reveal that both proteoglycans (PG) and collagen vary as a function of depth. PG content has previously been shown to increase with depth to the lower transitional zone [1,2]. The depth-dependent arrangement of collagen has been used to divide cartilage into three structural zones; a superficial zone (SZ) where collagen fibres are oriented parallel to the articular surface, a transitional zone (TZ) where collagen is oriented more randomly, and a deep zone (DZ) where collagen fibres are oriented perpendicular to the articular surface [3]. This structural configuration within the extracellular matrix affects the mechanical properties of the tissue. For example, differences in PG concentration, which has been associated with the compressive stiffness of articular cartilage, throughout the tissue may alter the compressive resistance within those specific areas [4].
The relationship between the depth-dependent structure and mechanical properties of articular cartilage has long been of interest. Investigations have involved the use of techniques requiring tissue to be substantially modified from its fresh, functional condition. Modifications including histological processes, freezing, subchondral bone removal, and fluorescent staining all occur after specimen procurement and may potentially obscure or alter the understanding of the mechanical role of the extracellular matrix in articular cartilage [5-12]. The current study proposes a novel method that limits tissue modification after specimen procurement while providing direct visualisation of the structural response of articular cartilage to compressive loading. A novel tissue-sectioning device allowed the samples to remain fresh, unfixed, unstained, and attached to subchondral bone. The thin cross-section of the samples allowed direct viewing of the tissue’s structural response to compressive loading. This method, requiring very little tissue modification may be particularly applicable to degenerate conditions of articular cartilage that may nonuniformly alter the extracellular matrix.
2. Methods
2.1. Samples
Articular cartilage samples were obtained from 3 healthy skeletally mature (>2 years old) mongrel dogs weighing between 25 - 31 kg. The central load-bearing region of the humeral head from the right limb of each animal was cut into full thickness osteochondral blocks (1.5 mm × 1.5 mm) using a variable speed diamond saw. Using a customized cutting device (Figure 1), 6 - 7 full thickness 0.1 mm thick by 1.5 mm wide osteochondral samples were obtained from each block. In total, 20 samples were obtained. The device consisted of a linear positioning stage (Parker Automation, UK) driven by a digital micrometer (Parker Automation, UK) with an accuracy of 0.0001 mm. A vertically sliding platform with a single bevelededge razor blade attached was mounted on top of the stage. The single beveled edge allowed for precise blade placement, ensuring accurate tissue sectioning. A customized specimen clamp was affixed to the far end of the metal base allowing the razor blade to be moved towards the sample. The osteochondral block was clamped and the razor blade advanced to the edge of the specimen. The razor blade was raised above the sample and advanced 0.1 mm with the micrometer. The razor was then brought down creating a 0.1 mm thick full thickness cartilage sample with subchondral bone attached. The subchondral bone was cut to 1 mm in length and the cut was
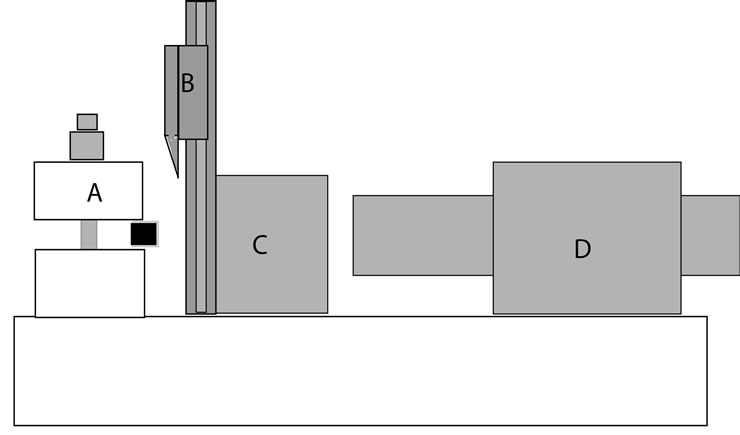
Figure 1. Diagram of the tissue-sectioning device. The osteochondral sample is held in the customized clamp (A). The single bevel-edged razor blade is able to move up and down to slice the 0.1 mm osteochondral slices (B). C shows the movable metal block holding the cutting apparatus. D is a digital micrometer (Parker Automation, UK) with an accuracy of 0.0001 mm that was used to move the blade towards the tissue sample.
parallel to the articular surface. Samples were then placed on edge and a digital photo taken and thickness measured using the imaging equipment described below. In this way, multiple specimens could be obtained from one tissue block. The tissue was continually hydrated with PBS + PI throughout storage, specimen procurement, and mechanical testing.
2.2. Mechanical Testing
A customized compressive loading apparatus (Figure 2) was used to load samples in laterally unconfined compression between the objective and light source of an inverted microscope (Nikon) in transmission mode. The loading device consisted of an aluminum plate attached to the microscope stage with a micrometer on one side and a load cell (National Instruments, USA) on the other side of a centrally placed standard microscope slide (Fisher, USA). The specimen was placed between two glass loading platens (one contacting the subchondral bone, the other contacting the articular surface). The loading platen contacting the subchondral bone was 0.1 mm thick standard cover glass (Thomas Scientific, USA) and was advanced by a micrometer to contact the subchondral bone of the specimen. Two additional pieces of 0.1 mm cover glass were affixed to the underlying microscope slide to act as a guide limiting lateral movement of the loading platen. Limiting the lateral constraint to the
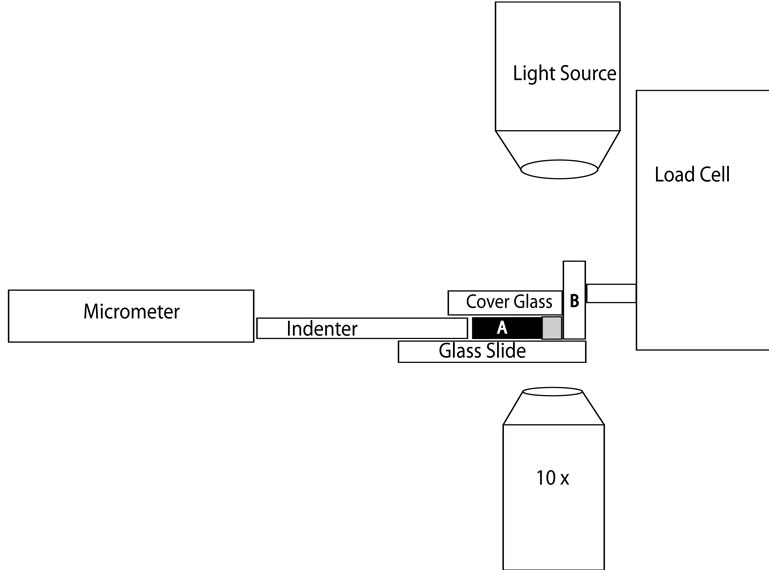
Figure 2. Diagram of the compression device. The micrometer was used to advance the indenter towards the tissue sample (A). The indenter consisted of 0.1 mm cover glass and was prevented from lateral movement as it was advanced through two 0.1 mm pieces of cover glass affixed to the underlying microscope glass slide. A 0.1 mm piece of cover glass covered the specimen and indenter, preventing the cartilage from folding up when compressed. This cover glass was weighed down with two, 10 g weights outside of the field of view of the microscope. The cartilage specimen was advanced against a loading platen (B) that consisted of a microscope slide placed on end and was attached to the load cell (National Instruments, USA).
loading platen also allowed water to flow out of the cartilage during compression. The loading platen contacting the articular surface of the cartilage was a microscope slide (Thomas Scientific, USA) placed on end and attached to a load cell. Once placed between the loading platens, the cartilage specimen was covered by a piece of standard No. 1 cover glass (22 × 30 × 0.130 mm; Thomas Scientific, USA) and was weighted down on either side of the specimen with two, 10 gram weights to prevent cartilage buckling during compression.
Prior to placing the osteochondral sample on the microscope slide, PBS + PI was placed on the microscope slide. Additional PBS + PI was added before covering the sample with the No. 1 cover glass. This ensured that a thin film of fluid was present between the cartilage and the glass both above and below the cartilage that both guarded against tissue dehydration and served as a lubricant to decrease friction associated with specimen movement towards the loading platen attached to the load cell. The micrometer advanced the glass loading platen to contact the subchondral bone and compress the tissue to bulk strains of 12.5%, 24%, and 29% at a compression rate of 30 μm/s. The loading platen in contact with the cartilage was also attached to the load cell. The load cell was attached to a power source and a digital multimeter. Before experimentation, signals from the load cell (mV) were calibrated in the milligram range up to 100g and found to be linear. The signal from the load transducer was converted into nominal stress (by dividing force by the cross-sectional contact area of the tissue) at each level of bulk tissue strain. At each bulk tissue strain level, the sample was allowed to stress relax until the stress changed by less than 0.001 MPa in 5 minutes and then the equilibrium load was measured.
2.3. Imaging and Strain Calculation
Both bulk and intra-tissue displacements were measured optically using a Nikon Diaphot microscope (Nikon, USA) with a 10× objective. Specimen images were obtained before loading and after each compression level using a digital camera (Diagnostic Instruments, USA). A microcomputer running Spot Imaging Software (v.4.6.1.26; Diagnostic Instruments, USA) allowed cells throughout the thickness of the tissue to be identified and changes in displacement at various bulk tissue strains to be calculated. Since the cartilage deformations extended over length scales much larger than the size of an individual cell, they were used as intrinsic fiducial markers [13]. As the chondrocytes are roughly three orders of magnitude greater than the effective pore size of the extracellular matrix, they are essentially affixed to the matrix and their movement in response to tissue compression may be considered indicative of the movement of the matrix surrounding them [13].
Tissue displacement was calculated from digital images of the full thickness tissue. The resulting 16-bit, grayscale images captured the field of view of the microscope (1597 × 1119 pixel resolution in a field of view of 1.2 mm × 0.9 mm). Measurements were calibrated with a ruler with 0.1 mm divisions (Diagnostic Instruments, USA). Using Spot Imaging Software, bulk tissue displacement was calculated by measuring the distance between the articular surface and the subchondral bone at each compression level. Each measurement was then subtracted the original uncompressed tissue thickness. Intra-tissue displacements were calculated by measuring the distance between the inferior border of selected chondrocytes and the subchondral bone. These measurements were taken at each bulk tissue compression level. The distance between the chondrocyte and the subchondral bone was subtracted from the reference distance of the same cells from the subchondral bone in the uncompressed tissue. The measured chondrocytes were placed into the following groups: superficial zone (0 μm - 60 μm beneath the articular surface), transitional zone (61 μm - 180 μm beneath the articular surface), and radial zone (181 μm beneath the articular surface—subchondral bone). Cells were placed into these groups based on measurements from the uncompressed sample. They were subsequently traced through the different bulk tissue compressions and used as fiducial markers of the different cartilage zones. These zonal thicknesses have previously been determined for canine humeral cartilage by our lab [2]. Both bulk and intra-tissue displacements were converted into nominal strain by dividing the displacement (either of the bulk tissue or the cells within each zone) by the uncompressed tissue thickness (when calculating bulk tissue strain) or distance between inferior border of the chondrocytes and the subchondral bone in the uncompressed state (when calculating intra-tissue strain).
2.4. Statistics
One-way analysis of variance (ANOVA) with Tukey post hoc tests were used to compare the average stresses associated with bulk tissue compression as well as to compare the average intra-tissue strains within the structural zones between bulk compression levels. Significance was determined at α < 0.05 unless otherwise stated and all statistical analysis was conducted using SPSS v.16 (Chicago).
3. Results
In accordance with research in our lab we define the superficial zone as 0 - 60 mm, the transitional zone as 61 - 180 mm, and the deep zone as 181 - 600 mm depth from the articular surface [2]. Figure 3 shows a representative cartilage sample with distinctive groups of chondrocytes identified at each level of bulk tissue compression (0%, 12.5%, 24%, and 29%). The cellular movement associated with increased compression shows non-uniform tissue deformation. Cells in the superficial part of the tissue underwent greater displacement than those cells closer to the subchondral bone. At 12.5% bulk tissue strain, the intra-tissue strains were 0.087 ± 0.0088, 0.048 ± 0.0019, and 0.029 ± 0.002 for the SZ, TZ and DZ respectively. At 24% bulk compression, intra-tissue strains increased to 0.23 ± 0.007, 0.18 ± 0.02, and 0.06 ± 0.01 for the SZ, TZ, and DZ respectively. Intra-tissue strains were greatest at 29% bulk compression and increased to 0.33 ± 0.02, 0.30 ± 0.01, 0.17 ± 0.04 for the SZ, TZ, and DZ respectively.
Within each bulk tissue compression level, displacement in the SZ was significantly greater than in both the TZ and DZ (p < 0.01) (Figure 4). Displacement in the TZ was significantly greater (p < 0.01) than in the DZ. When bulk tissue levels are compared, displacement in both the SZ and TZ increased significantly (p < 0.05) at each level of increasing bulk tissue compression (Figure 4). Displacement in the DZ was significantly increased (p < 0.05) only at 29% bulk tissue compression.
Stress values significantly increased (p < 0.05) at each level of bulk tissue compression. Stress increased from 0.14 ± 0.0002 MPa, to 0.15 ± 0.0004 MPa, and 0.16 ± 0.007 MPa for 12.5%, 24%, and 29% bulk tissue compression respectively. Figure 5 shows stresses plotted against intra-tissue strain values. The resultant slopes of the lines are not intended as a formal modulus calculation since the stress values correspond to the bulk tissue strain rather than the intra-tissue strain. However, the graph does show that as tissue depth increases, the slope of the corresponding lines becomes steeper. This qualitative observation does give an indication of the stiffness differences between structural zones and further identifies the substantially different mechanical properties between each zone.
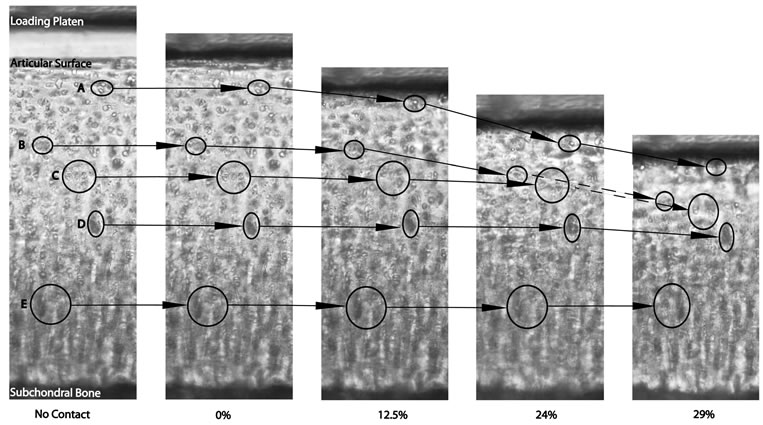
Figure 3. Representative sample of the tissue under the various compression levels. The circles correspond to cells that were tracked through the increasing compression in the superficial zone (A), transitional zone (B, C) and deep zone (D, E).
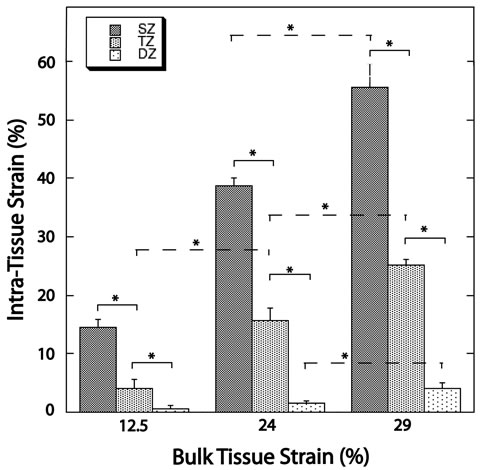
Figure 4. Graph summarizing the depth-dependent properties of intra-tissue strain within the three bulk tissue strain levels (12.5%, 24%, 29%). Significantly decreased intratissue strains were seen with increasing tissue depth. Intratissue strains also significantly increased with increasing bulk tissue strains (although the increase in the DZ was only significant upon 29% bulk tissue strain). The * symbol indicates significance at the p < 0.05 level.
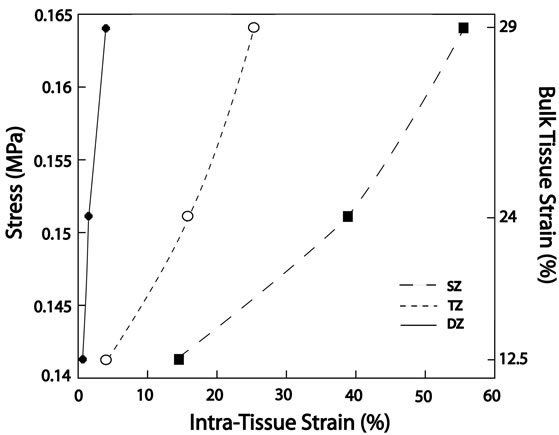
Figure 5. Graph of bulk tissue stress against intra-tissue strain for each bulk tissue compression level. The three lines correspond to the superficial zone (SZ), transitional zone (TZ), and the deep zone (DZ). Stress increased in each zone at each bulk tissue strain level. The lines are not curve fittings and are included to provide a qualitative understanding of the differential amounts of intra-tissue strain for each zone at each level of bulk tissue strain. The increasing slopes of the lines from SZ to DZ, while not quantitative, does show that for a given stress there is decreased intra tissue strain. This may be interpreted as increased compressive resistance with increased tissue depth.
4. Discussion
This study reports a novel procedure that allows visualisation of the nonuniform structural changes within articular cartilage compression while simultaneously measuring the depth-dependent mechanical properties of the tissue. Previous investigations in this area have used techniques that involve tissue modification after specimen procurement including; histological procedures, freezing, subchondral bone removal, or fluorescent staining [5-12]. Such modification may alter the tissue structure resulting in the observation of tissue that differs from its in vivo condition. The present study, in using a novel tissue sectioning device, is able to procure 0.1 mm, full thickness osteochondral slices from fresh, unfixed, unfrozen tissue (requiring no tissue modification after specimen procurement) that is able to more closely approximate in vivo conditions. The use of 0.1 mm thick specimen slices and a compression device comprised of thin glass allows direct visualisation of articular cartilage without the use of fluorescent dyes or other tissue labeling. The use of chondrocytes as fiducial markers, a method previously used to track intra-tissue strains, was used in the current investigation and is shown in Figure 3 [8-13].
Both the bulk tissue strain and intra-tissue strain results (Figure 4) from the current study confirm previous findings that under compression, the superficial zone shows the greatest displacement and the deep zone the least [5,8-12]. Intra-tissue strains of 0.2 have previously been reported in the superficial parts of articular cartilage at lower levels of bulk tissue compression (8% - 16%). This compares favourably to the 0.087 and 0.23 strains found in the current study (at 12.5% and 24% bulk tissue compression respectively) [11]. Additionally, previous reports of stress levels for 24% (0.11 ± 0.037 MPa ) and 32% (0.168 ± 0.05 MPa) bulk tissue compression levels are similar to the values at 24% (0.14 ± 0.0002 MPa) and 29% (0.16 ± 0.007 MPa) bulk tissue compression found in the current study [11]. The specific differences between the current study and previous investigations are likely influenced by a number of factors. 1) Our definitions of SZ, TZ, and DZ thickness were previously confirmed using FTIR, while comparative studies found within the literature had divided tissue into 125 mm thick levels [2,11]; 2) The difference between studies utilizing post-procurement modifications and our study, which did not use such modifications [2,11]; 3) A difference in animal model. We used a canine model whereas other studies have used a bovine model [2,11].
Numerous studies have found that the compressive resistance of the deep zone is greater than the transitional zone [6,8,10,11]. The current study also confirms this finding (Figure 5). While only qualitatively, Figure 5 does show that with increased depth from the articular surface, there is less strain for a given stress. With modulus values being calculated as stress divided by strain, a smaller strain value will result in a larger modulus value. This indicates an increase in compressive resistance. The authors acknowledge that the slopes in Figure 5 may not be used to calculate true modulus values as the stress values correspond to bulk tissue strains, but feel they adequately characterize previous findings that show compressive resistance increases with increasing depth from the articular surface [6,8,10,11]. Such depth-dependent properties most likely reflect structural differences within the extracellular matrix. The depth-dependency of PG concentration is likely critically important in explaining these mechanical differences as these macromolecules have long been associated with the compressive stiffness of articular cartilage [4,11].
It is important to note that while the method described in the current study confirmed previous findings, it did so while avoiding the use of substantial tissue modification procedures after specimen procurement. This testing in a more in vivo condition has not previously been conducted on osteochondral specimens. This relatively easy to use and inexpensive method allows direct visualisation and quantification of the depth-dependent mechanical properties of articular cartilage. The ability of this method to allow the tissue to remain in a relatively unmodified state may be of particular use for studies intending to investigate the progression of disease states such as osteoarthritis that exacerbate the spatial variations existing in normal, healthy articular cartilage. When dealing with such disease states, tissue modifications may have unknown consequences that may cause artifacts in data interpretation. Keeping tissue close to its in vivo condition will allow a more direct study of the tissue and any changes that may occur that affect the mechanical properties.
5. Acknowledgements
Y. Xia is grateful to the National Institutes of Health for the R01 grants (AR 45172, AR 52353) to support this project. The authors thank Drs. C. Les and H. Sabbah (Henry Ford Hospital, Detroit) for providing the canine joints, and Mr. F. Badar (Oakland University) for setting up the imaging system. Work completed at Oakland University, Rochester MI, USA. Funding from the National Institutes of Health R01 grants (AR 45172, AR 52353) supported this project.
REFERENCES
- A. Maroudas, “Physico-Chemical Properties of Articular Cartilage,” In: M. A. S. Freeman, Ed., Adult Articular Cartilage, Pitman Medical, Tunbridge Wells, 1979, pp. 215-290.
- Y. Xia, N. Ramakrishnan and A. Bidthanapally, “The Depth-Dependent Anisotropy of Articular Cartilage by Fourier-Transform Infrared Imaging (FTIRI),” Osteoarthritis and Cartilage, Vol. 15, No. 7, 2007, pp. 780-788. doi:10.1016/j.joca.2007.01.007
- J. M. Clark, “The Organisation of Collagen Fibrils in the Superficial Zones of Articular Cartilage,” Journal of Anatomy, Vol. 171, 1990, pp. 117-130.
- E. R. Myers and V. C. Mow, “Biomechanics of Cartilage and Its Response to Biomechanical Stimuli,” In: B. K. Hall, Ed., Cartilage: Structure, Function, and Biochemistry, Academic Press, Toronto, 1983, pp. 313-341.
- W. C. Bae, C. W. Lewis, M. E. Levenston and R. L. Sah, “Indentation Testing of Human Articular Cartilage: Effects of Probe Tip Geometry and Indentation Depth on Intra-Tissue Strain,” Journal of Biomechanics, Vol. 39, No. 6, 2006, pp. 1039-1047. doi:10.1016/j.jbiomech.2005.02.018
- S. S. Chen, Y. H Falcovitz, R. Schneiderman, A. Maroudas and R. L. Sah, “Depth-Dependent Compressive Properties of Normal Aged Human Femoral Head Articular Cartilage: Relationship to Fixed Charge Density,” Osteoarthritis and Cartilage, Vol. 9, No. 6, 2001, pp. 561-569. doi:10.1053/joca.2001.0424
- D. M. Gore, G. R Higginson and R. J. Minns, “Compliance of Articular Cartilage and Its Variation through the Thickness,” Physics in Medicine and Biology, Vol. 28, No. 3, 1983, pp. 233-247. doi:10.1088/0031-9155/28/3/004
- T. J. Klein, M. Chaudhry, W. C. Bae and R. L. Sah, “Depth-Dependent Biomechanical and Biochemical Properties of Fetal, Newborn, and Tissue-Engineered Articular Cartilage,” Journal of Biomechanics, Vol. 40, No. 1, 2007, pp. 82-190. doi:10.1016/j.jbiomech.2005.11.002
- P. O’Connor, C. R. Orford and D. L. Gardner, “Differential Response to Compressive Loads of Zones of Canine Hyaline Articular Cartilage: Micromechanical, Light and Electron Microscopic Studies,” Annals of the Rheumatic Diseases, Vol. 47, No. 5, 1988, pp. 414-420. doi:10.1136/ard.47.5.414
- R. M. Schinagl, M. K. Ting, J. H. Price and R. L. Sah, “Video Microscopy to Quantitate the Inhomogeneous Equilibrium Strain within Articular Cartilage during Confined Compression,” Annals of Biomedical Engineering, Vol. 24, No. 4, 1996, pp. 500-512. doi:10.1007/BF02648112
- R. M. Schinagl, D. Gurskis, A. C. Chen and R. L. Sah, “Depth-Dependent Confined Compression Modulus of Full-Thickness Bovine Articular Cartilage,” Journal of Orthopaedic Research, Vol. 115, No. 4, 1997, pp. 499- 506. doi:10.1002/jor.1100150404
- C. C. B. Wang, J. M. Deng, G. A. Ateshian and C. T. Hung, “An Automated Approach for Direct Measurement of Two-Dimensional Strain Distributions within Articular Cartilage under Unconfined Compression,” Journal of Biomechanical Engineering, Vol. 124, No. 5, 2002, pp. 557-567. doi:10.1115/1.1503795
- A. C. Chen, S. M. Klisch, W. C. Bae, M. M. Temple, K. B. McGowan, K. R. Gratz, B. L. Schumacher and R. L. Sah, “Mechanical Characterization of Native and Tissue Engineered Cartilage,” In: M. Sabatini, F. DeCeuninck and P. Pastoureau, Eds., Cartilage and Osteoarthritis, Humana Press, Totowa, 2004, pp. 157-190. doi:10.1385/1-59259-821-8:157
NOTES
*There are no conflicts of interest involved with this study or the manuscript.
#Corresponding author.