Natural Resources
Vol.5 No.4(2014), Article ID:44365,15 pages DOI:10.4236/nr.2014.54015
Visualizing Relationships between Drivers of Environmental Change and Pressures on Land-Based Ecosystems
Jason Jabbour1*, Carol Hunsberger2
1United Nations Environment Programme, Scientific Assessment, Nairobi, Kenya
2Department of Geography, University of Western Ontario, London, Canada
Email: *jason.jabbour@gmail.com
Copyright © 2014 by authors and Scientific Research Publishing Inc.
This work is licensed under the Creative Commons Attribution International License (CC BY).
http://creativecommons.org/licenses/by/4.0/


Received 10 January 2014; revised 12 February 2014; accepted 26 February 2014
ABSTRACT
The pursuit of human needs and demands is placing more pressure on land resources than ever before. The challenge of feeding 7 billion people is increasingly competing with rising demands for materials and biofuels. Deforestation and land degradation are among the pressing outcomes of these trends. Drivers of environmental change—including population growth, economic activity, consumption, urbanization, trade, conflict, and governance—clearly play a role in aggravating or mitigating these pressures on land. Despite advances in understanding causality in complex systems, navigating the interactions between these drivers remains a major challenge. This paper analyzes and visualizes the relationships between multiple, interacting drivers of environmental change and specific pressures on land-based ecosystems. Drawing on experience from the development of the Drivers and Land chapters of the UN Environment Programme’s Fifth Global Environment Outlook report (GEO-5), we use a series of Kiviat diagrams to illustrate the relative influence of key drivers on selected pressures on land. When individual diagrams are overlaid, patterns of influence emerge that can provide insight into where policy responses might best be targeted. We propose that, subject to some limitations, the Kiviat exercise can provide an accessible and potentially valuable “knowledge-intermediary” tool to help link science-based information to policy action.
Keywords:Drivers; Environmental Pressure; Land Use Change; Integrated Assessment; Science-Policy

1. Introduction
Human activities are intensifying stresses on the Earth System—and producing biophysical surprises. Recently, planetary-scale transitions to a disturbance-dominated regime have become a major focus of research [1] -[3] . The Amazon basin provides emerging evidence of a terrestrial ecosystem experiencing such a biophysical transition, due largely to human influence. Loss of carbon storage and altered energy and water cycles, beyond the magnitude of natural variability, are among the most pressing potential consequences of repeated, prolonged disturbances in the Amazon basin [4] . Near-surface permafrost represents another system potentially undergoing a major shift: permafrost temperatures across the Arctic have increased by about 2˚C over the past 20 - 30 years [5] , and climate projections indicate a substantial and irreversible loss of up to 85% to 90% of near-surface permafrost by 2100 [6] [7] . Such rapid thawing would increase atmospheric CO2 concentrations, amplify surface warming and initiate a positive carbon feedback that could lead to a directional change in the carbon balance for the Arctic (from a sink to a source) as early as the mid-2020s; nullifying up to 88% of the total global land sink [8] .
Such critical transformations highlight the need to manage competition between current demands and future scenarios for biophysical systems, as well as to improve knowledge of the implications associated with altering the prevailing pressures on the environment [3] [4] [9] . In particular, pressures on land-based natural resources are increasing; despite internationally agreed goals intended to improve their management [10] . Recent studies, including large-scale integrated assessments, have modeled interrelated factors affecting land competition and suggest that future policy decisions across the agriculture, forestry, energy and conservation sectors will profoundly affect the intensification of both environmental stresses and future demand [11] .
Demand is rising simultaneously for food, livestock feed, biofuels, and materials such as timber, alongside other competing demands (e.g. for carbon stocks, biodiversity conservation and subsistence livelihoods). Deforestation and land degradation are among the pressures on the environment that are intensified by these trends. For example, recent research finds that 40% of terrestrial ecosystems have now been transformed to agricultural land [12] . The area harvested for soybean crops alone has doubled in the last 30 years, while oil palm production has expanded rapidly—from 4.2 million ha in 2000 to 7.1 million ha in 2009 in Indonesia alone [13] . Coastal wetlands continue to be lost at the rate of about 100,000 ha per year, while dry land plant productivity is in persistent decline [12] . Global forest loss, while slightly slower than in the 1990s, remained at 13 million ha per year from 2000-2010 [14] . These changes reflect a particularly acute convergence of rising human demands for a finite resource base.
Anticipating the outcomes of these environmental changes—and acting to mitigate or avoid them—requires an improved ability to identify root causes of human-driven global change. In particular, better understanding the interactions between drivers of environmental change and their influence on specific pressures on land could help inform policy decisions to more effectively alleviate these pressures. However, an improved understanding of causality and complex interactions by itself is not enough to motivate such decisions. Enhancing communication among scholars, practitioners and decision makers, and fostering an accessible and deeper mutual understanding of this improved knowledge, is also crucially important.
The twin goals of understanding complex interactions and effectively conveying them to policy makers, educators and the public can be facilitated by the strategic use of visualization techniques. Moreover, we argue that such techniques could help address some of the challenges facing sustainability scientists and the integrated environmental assessment community (i.e., linking scientific analysis with policy narratives). This paper employs a series of conceptual diagrams—building on the Kiviat or “spider chart” technique—to display and analyze relationships between multiple drivers and pressures on land. The analysis presented here grew out of the process of developing the Land and Drivers chapters of UNEP’s fifth Global Environment Outlook (GEO-5) assessment.
This paper takes on three tasks. First, by adapting and applying the Kiviat diagramming method to the problem of drivers and pressures, it contributes to the development of techniques for effectively visualizing, investigating and communicating complex human-environment interactions. Second, by analyzing specific sets of interactions between drivers and pressures in terrestrial systems and overlaying them to identify patterns, it produces insights that could help to inform improved policy strategies for sustainable natural resource and land management.
Finally, developing this work through the GEO-5 process creates an opportunity to reflect on the possibilities of leveraging a collaborative, integrated environmental assessment process to advance research beyond the specific mandate for which it was convened. The analysis presented here adds to a growing body of research that suggests that mechanisms that enhance communication, mutual understanding, integration and engagement on both ends of the producer-user knowledge spectrum have a crucial role to play in improving the interface between science and policy with respect to global environmental change.
2. Environmental Drivers, Pressures and Global Environmental Change
A range of large-scale integrated environmental assessments (IEAs) have studied the current state of ecosystems and their future capacity to deliver key services for humans while maintaining natural functions in the context of global environmental change e.g., [15] -[18] . Each of these assessments and the analytical frameworks behind them assert that understanding the driving forces (or “drivers”) of change is a precondition for managing human influence on the environment. Moreover, the effectiveness of interventions to mitigate adverse impacts, they argue, depends not merely on identifying correlations but also on understanding the causal mechanisms linking specific actions to environmental outcomes.
The challenge is that the impacts of human activities do not occur in a simple, linear manner. Altered ecosystems—the result of interactions between humans and their environs—are almost always caused by multiple, interacting drivers [11] [19] [20] .
Drivers are important to understanding and managing natural resources and environmental problems for many reasons. First, they exert influence on environmental conditions. Drivers are defined as underlying factors or forces that—together with actors’ decisions—lead to pressures, seen as proximate influences on environmental change [10] [21] . For example, if conversion of land to agriculture is a pressure, then demand for agricultural products can be considered a driver. The Millennium Ecosystem Assessment describes two analogous categories of global driving forces along a spectrum of influence. “Direct” or proximate drivers are seen to yield an unequivocal effect on environmental processes or an ecosystem, while “indirect” or underlying drivers operate more diffusely by influencing one or more direct drivers [15] [19] [22] -[24] . Most drivers operate synergistically. In the case of land cover change resulting from agricultural conversion, population growth, economic development, and globalization could all be considered relevant drivers that exert varying degrees of influence on both the processes and outcomes of land cover change. Similarly, technological advances can stimulate the rate of economic development, and vise-versa.
Second, drivers do more than account for known pressures. They can combine in time and space in novel ways to create new pressures and influences. For example, the combined forces of technological advancements and new consumption patterns resulted in the explosive growth of the mobile phone industry and other compact electronic devices in the 1990s, leading to a surge in demand and sudden price boom for the mineral ore “coltan” (columbite-tantalite). This in turn led to dramatic excavation activity in the eastern Democratic Republic of the Congo where large concentrations of coltan were found [25] . Lucrative revenue streams from rebel-controlled mining enclaves were in turn used to finance the long-standing violent conflict and perpetuate (at least indirectly) ongoing insecurity in the region [26] -[28] . This has resulted in environmental consequences that go beyond the direct impacts of the mining operations [29] .
Third, drivers can combine to create dynamic patterns of pressures that in turn give rise to systemic interactions—across spatial, temporal, and institutional scales. For example, concerns about climate change impacts, including increased crop vulnerability and food insecurity, gave rise to climate policies which included mandates for increasing the use of biofuels such as ethanol and biodiesel. The resulting demand for agricultural goods as fuel feed stocks generated a cascading set of pressures, including crop diversion, which drove up food prices and in turn increased food insecurity [10] [30] . In this respect, the high inertia and path dependencies typically associated with drivers can give rise to different obstacles to effective action. The complex evolution of US farm policy, for example, has produced a system that favors the production of both ethanol and unhealthy foods—through its history of subsidies for “overproducing” corn and other “low-cost” commodity crops—and has thereby amplified existing policy challenges in changing long-term health trajectories including the childhood obesity epidemic [31] [32] .
Finally, drivers are important targets of policy innovation. GEO-5 asserts that policy interventions that look beyond sectoral issues, and are instead designed and framed to target drivers, could conceivably reduce pressure across a range of environmental problems simultaneously and achieve co-benefits. As such, the study of drivers is attracting greater interest.
Environmental drivers are influenced by variable policies. For some drivers, the dominant existing policy mechanisms actively encourage outcomes that increase pressure on the environment. Examples include economic growth and trade. Success of mainstream policies with regard to these drivers generally leads to higher resource and energy use. For other drivers, the dominant policy mechanisms encourage outcomes that reduce environmental pressure. Examples include conflict and weak governance. Success of mainstream policies with regard to these drivers can ease competition over resources and create conditions that favor the development and implementation of long-term environmental management plans. For still other drivers, there are no significant policy mechanisms at work, one way or the other.
Understanding the interactions between drivers, and their influence on pressures, remains a major challenge. Research has typically focused on the emergent consequences of drivers and pressures on ecosystems, not on the effects of changed ecosystems on drivers and pressures—thus addressing only one part of a feedback loop. Meanwhile, policy interventions tend to focus on pressures—through responsive courses of action—even though transformational change and the transition to a more sustainable world is more likely to be achieved by influencing underlying drivers of change [10] [33] [34] . Stirling [35] contends that in order for a more reflexive or anticipatory style of decision-making and intervention to succeed, drivers (and pressures) must be framed in tractable ways such that they offer specific moments, modes and loci for action. Engaging this notion, however, creates both the predicament and the challenge of differentiating between drivers and pressures—which are inherently conditional—and partitioning their properties and characteristics in relation to real-world instances.
Perhaps unsurprisingly, the integrated environmental assessment (IEA) research community has struggled to define such discrete, clear delineations between where a driver ends and a pressure begins [10] [19] [36] . Hence, GEO-5 conceptualizes drivers and pressures as parts of a continuum rather than as mutually exclusive or collectively complete domains. The process by which the set of drivers and pressures used in this analysis was derived is explained in Section 4.2 (Procedure: step 1).
Various conceptual frameworks exist for organizing drivers and pressures and these have been applied in different assessments. In the global environmental change community, the DPSIR framework—Driving forces, Pressures, State, Impacts, and Responses—has been widely accepted and commonly used in IEA (Figure 1).
Devised in the mid-1990s, initially as a visual model to help decision makers see the impacts of political choices [37] , DPSIR has evolved into an analytical tool to facilitate investigations of the causal interplay between determinants of change and proposed responses; it has subsequently been applied to several disciplinary areas including sustainable development [38] . While the DPSIR framework has been praised for its simplicity, it has also been criticized for being too linearly constrained. With insufficient capabilities to account for the dynamics of the systems it models, it has been described as both poorly suited for representing complex interactions and overstretched in its empirical application [39] -[42] . Svarstad et al. [39] identify a series of “discursive biases” of the framework, concluding that it lends itself to a limited range of perspectives and “discourse-selective” understanding of complex issues. Others have raised questions about DPSIR’s lack of methodological structure, or rigor, which they suggest has led to multiple interpretations and an inconsistent attribution of indicators across the framework’s five components [43] .
Ultimately, such organizing frameworks are useful to help nurture differentiated understandings and to foster
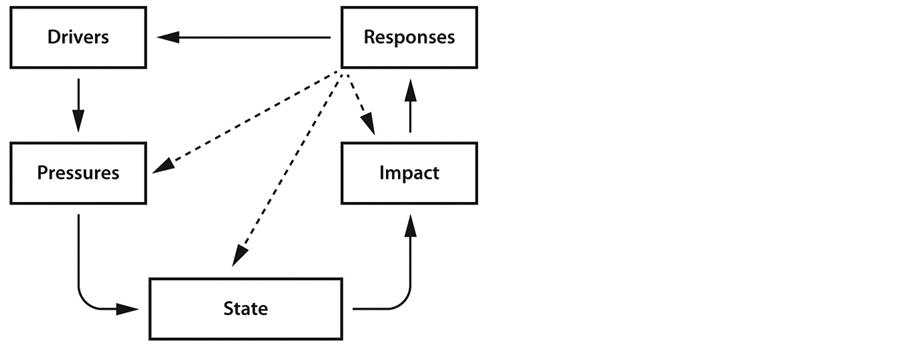
Figure 1. Simple DPSIR framework in the IEA context.
better communication, but by themselves, are insufficient to perform hypothesis testing or to systematically and comprehensively examine a wider range of drivers. These challenges compel a broadening of tools and techniques that can at once help address systematic analysis of drivers (and pressures) and serve to bridge complex information across different actors and disciplinary groups. Applying such “knowledge-intermediary” tools (as we will call them in this paper), through collaborative processes such as GEO—where different actors come together to understand environmental problems and contending pathways for decision-making—we argue, could offer possibilities to address certain tensions and communication challenges at the science-policy interface.
3. GEO and the Integrated Environmental Assessment Process
In line with its mandate of keeping the global environment under review, UNEP coordinates integrated environmental assessments—consultative and participatory processes—that inform environmental decision-making and aim to facilitate interaction between science and policy. Five Global Environment Outlook (GEO) assessment reports have been produced by UNEP, in 1997, 1999, 2002, 2007 and 2012. Each has analyzed environmental state and trends at the global and regional scales, described plausible outlooks and formulated policy options. The fifth and latest iteration, GEO-5: Environment for the future we want was launched in June 2012 alongside the second Earth Summit in Rio de Janeiro. Building on previous assessments, GEO-5 suggests a shift in the analysis and framing of problems and responses, emphasizing interventions that employ a more reflexive approach and strategies that are less circumscribed in their ambitions to engage with underlying driver.
The goal of the GEO process is to ensure that enviromental problems and emerging issues of international significance receive adequate and timely consideration by researchers, governments and other stakeholders. Given the complexity of global environmental issues and their interactions with society, a structured approach that includes political processes and the economic system is crucial. In its most basic form, the Integrated Environmental Assessment (IEA) process brings together knowledge from a wide range of scientific disciplines and stakeholders, so that integrated insights are made available to decision-makers. The IEA process provides a participatory, structured approach to linking knowledge and action. The framework for the IEA recognizes two key domains of the Earth System: human society and the environment. Over time, GEO has developed an increasingly integrated approach to environmental assessment, through the use of indicators and reporting [44] .
The character and environmental policy orientation of IEAs have shifted dramatically in recent years. The makers of IEAs are now expected to address more complex problems, diverse audiences and varied time horizons than ever before. Even as researchers increasingly appreciate the complexity and interconnectedness of environmental problems, the number of separate international environmental agreements has proliferated and the institutions responsible for administering them have become increasingly fragmented, thus complicating even further the task of IEAs to provide a clear link between science and policy in the environmental domain [45] . Although the messages are becoming more complex, IEAs must still find accessible ways to communicate them if they are to fulfill their goal of informing policy makers. Hence there is much to be gained from adopting visualization tools that can distill and help interpret dynamic patterns. The Kiviat or “spider chart” technique presented here represents one such visualization tool. Its potential contributions and caveats are discussed in the following sections.
4. Methods
4.1. Kiviat Diagraming
We propose a methodological approach inspired by the Kiviat diagramming technique to illustrate and analyze the relative influence of key drivers on selected pressures on land. Kiviat diagrams, also known as spider charts or spider-webs, display multivariate data in the form of two-dimensional line graphs consisting of a sequence of axes, or spokes of equi-angular position, where each spoke represents one factor of the analysis [46] . The length of each spoke (defined by a data point) is proportional to the influence or magnitude of the relevant variable or factor relative to the maximum possible influence of the variable across all data points plotted.
For example, if we consider eight separate factors—in this case, drivers of environmental change—the resulting diagram would have eight distinct spokes or axes (Figure 2). The relative value assigned for each distinct factor (i.e., the eight drivers) for each entity of interest—in this case, a selected pressure on land—is plotted on the appropriate axis. Data points are then connected to form patterns that represent the entity under investigation (i.e., the pressure on land). The resulting multi-vector diagram thus turns a complex, multivariate entity or problem into a simple presentation; where a user is able to visualize critical dependencies and analyze how multiple variables could interrelate.
Originally conceived in the 1970s as a classification tool to support performance evaluation in the field of computer engineering [47] , the Kiviat method has since been extended and applied to a variety of research problems oriented towards multivariate, pattern-analysis. In recent years, common uses of the technique have facilitated investigations including: performance metrics of competitive athletes; quality management improvements in organizations; evaluating design attributes in integrated supply chains; and testing large high performance computing systems e.g., [48] -[51] .
Here we present an empirical application of the Kiviat method with the goal of understanding and navigating the dynamic interactions between drivers of global environmental change and pressures on terrestrial ecosystems. Building on the method described above, we map multiple entities—land pressures—and superimpose them on the same diagram. Finally we interpret the rendered Kiviat shapes, reflecting on possible interdependencies that could suggest where targeted responses might meet, exceed or fail expectations for co-benefits in relation to the given land pressures.
We draw on narratives developed in the GEO-5 Land chapter to help choose which combinations of pressures to analyze, and to guide the interpretation of critical interdependencies. The limitations, advantages and possibilities of our modified Kiviat approach are discussed in Sections 5 and 6.
4.2. Procedure
In the following sections, we outline the process we used to produce our Kiviat diagrams. This can be summarized in four steps:
1) Selecting the drivers and pressures 2) Standardize performance definitions 3) Rate each performance category/assign values 4) Plot, overlay and interpret the results
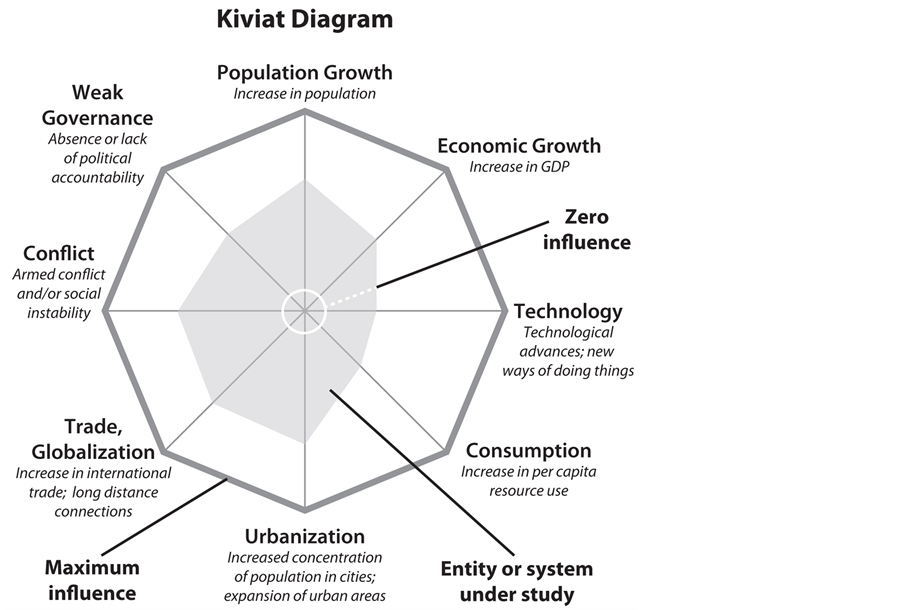
Figure 2. Hypothetical Kiviat diagram depicting eight distinct factors of influence.
4.2.1. Define Categories: Selecting the Drivers and Pressures
The first step was to create the analytical categories—in other words, to select the variables (underlying drivers) and entities (pressures on land) under investigation. The specific categories of drivers and pressures were generated inductively from preliminary discussions among GEO-5 expert working groups and emerging storylines of priority pressures on land. Authors of the Drivers chapter derived an initial list of priority, high-level drivers of change, informed by previous assessments (including past GEO reports) and modified to fit current thinking. Through an iterative process, expert working groups of each thematic chapter (Atmosphere, Land, Water, Biodiversity, and Chemicals and Waste) debated and compiled a list of environmental pressures of greatest concern to their respective themes. Provisional lists were then shared between working groups prior to the first production and authors meeting to stimulate cross-pollination of ideas, insights and synergies. In the end, we arrived at eight underlying drivers and 21 pressures for the Land chapter, of which six pressures were extracted for this analysis.
4.2.2. Standardize Performance Definitions
The degree to which a given driver influences a selected pressure on land is displayed as a point along the appropriate axis. Deriving these measurement scores (0 to 5) required that we normalize the factors (i.e., the selected drivers) to a standard performance definition. Table 1 presents the drivers considered in this analysis and their basic characteristics, including possible effects, key interactions and the direction of dominant policy

Table 1. Characteristics of selected drivers of environmental change1.
tendencies. While these are summarized in aggregate, there are important regional and other variations in both the policy tendencies and the effects of these drivers that we kept in mind during the scoring exercise as well as the interpretation and analysis of the results. Once performance definitions were established, we scaled the ranking intervals—testing a few options—to arrive at levels that could show an appropriate range of influence.
4.2.3. Rating Performance Category and Assigning Values
Given the findings of GEO-5, particularly those emerging from the Land Chapter, we reflected on the relative influence of each driver on each pressure, assigning a qualitative value from 0 (virtually no influence) to 5 (very strong influence). For each variable, the relative influence was assessed independently by individual authors of the Land Chapter. Responses were then brought together, discussed and negotiated, again through an iterative process of reflective dialogue and shared learning.
4.2.4. Connecting the Dots: Plotting, Overlaying and Interpreting the Results
In constructing the Kiviat diagrams, rankings (from the table) are plotted along the relevant axes. Lines are then drawn to connect the points on the adjacent spokes, and the resulting polygon shape—which in our analysis signifies a specific pressure on land—is then shaded. Superimposing multiple entities (pressures) by plotting them on the same graph revealed patters that allowed us to identify possible interdependencies and derive preliminary insights into where policy responses might best be targeted to alleviate environmental pressures. The interpretation of results is discussed in detail below.
5. Results and Discussion
This section presents the results of our analysis and discusses the insights it contributes to the three tasks identified in Section 1: identifying patterns of interaction between drivers and pressures for specific forms of environmental change related to land; assessing the strengths and limitations of the Kiviat technique for this type of analysis; and commenting on the role that this tool can play in supporting integrated environmental assessments.
5.1. On Drivers and Pressures
The world’s forests have long been under serious duress. In recent decades, tropical forest landscapes in particular, have faced disproportionate pressures due to various competing demands for productive land for agricultural commodities, meat consumption, palm oil production, and rising global demand for wood products. In the first Kiviat diagram (Figure 3) we consider three land pressures related to forests that are featured in the GEO-5 Land chapter: the expansion of large-scale oil palm plantations; commercial timber extraction—both regulated and unregulated—for wood and pulpwood products; and the production of traditional biomass
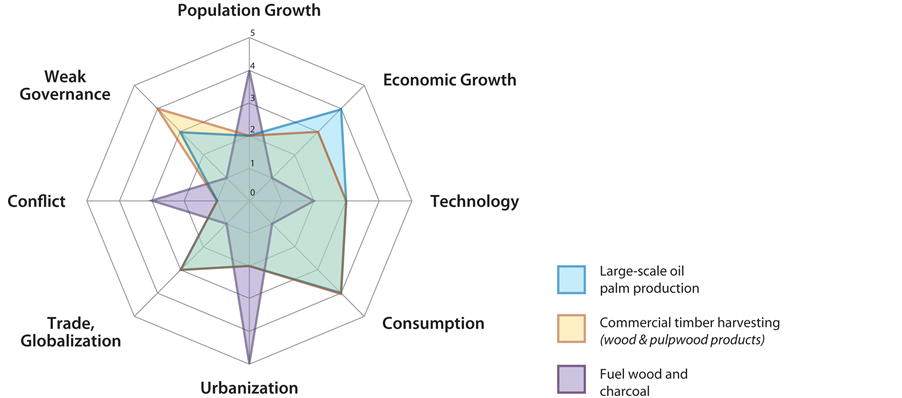
Figure 3. Overlaid Kiviat diagrams for large-scale plantations, commercial timber extraction and traditional biomass.
(fuelwood and charcoal). While all three pressures produce similar outcomes—deforestation and forest degradation—they are driven by markedly different combinations of processes that operate and interact at multiple scales.
Generally speaking, pressure on forests due to traditional biomass production is conditioned by fewer factors (or underlying drivers) that exert stronger relative influences—namely, population growth, urbanization trends, conflict or insecurity, and to a lesser extent technology. Rapid urbanization in developing countries coupled with high price elasticity and inadequate access to modern fuels has strongly influenced household energy demand, with a pronounced shift from fuelwood to charcoal; by some estimates a one percent increase in urbanization leads to as much as a 14% increase in charcoal consumption [52] . Given that charcoal, unlike fuelwood, is typically produced from intact natural forests, from a deforestation perspective this substitution trend is disconcerting; especially when many urban and peri-urban forested areas lack adequate forest management systems [53] [54] . This situation raises important questions regarding mainstream energy policies that place an over-emphasis on household income to explain fuel choices (i.e., the “ladder model”) and whether such postulations, as some researchers suggest, misleadingly imply that a socioeconomic move up to a new “superior” fuel is simultaneously a move away from traditional biomass fuels [55] [56] .
The aggregate pressures from commercial timber extraction and oil palm plantations on the other hand, are affected by a wider variety of factors with moderate degrees of relative influence, resulting in more diffuse Kiviat patterns. While enabling conditions and country circumstances vary, a growing body of evidence suggests that key barriers impeding the effective implementation of policies and interventions designed to address large-scale forest loss are symptoms of deeper deficiencies in global markets, trade structures and governance [57] -[59] . And as such, the latter two pressures, characterized by a dominance of commercial versus subsistence incentives are conditioned by several common critical drivers: weak governance, economic growth, and globalization and trade. In this sense, a convergence of interests between dominant actors—foreign and domestic—who stand to benefit from market distortions and “problematic” governance tendencies could be understood as a critical dependency and partial explanation for some of the complex and context-specific factors that are often unmitigated by policy interventions. This analysis resonates strongly with a key narrative in GEO-5 which suggests that distorted incentives and financial pressures (encouraged by a global economic system based on the pursuit of perpetual growth) have exaggerated the short-term returns from deforestation at the expense of natural capital [10] .
Contrasting the current policy discourse on REDD+ (Reducing Emissions from Deforestation and Forest Degradation2) against these results also reveals interesting signals about enabling factors consistent with the literature e.g. [60] -[63] , particularly that the efficacy, equitability and viability of REDD+ requires a stronger emphasis on safeguards against governance failures, conflict and instability in forest dependent-communities (stemming largely from restricted access to land), as well as preventing perverse incentives from the market and trade.
In the second Kiviat diagram (Figure 4) we consider three pressures based on simultaneous increases in demand for food, feed and biofuels. While all of these act to intensify competition for arable land, there are important differences in the processes at work.
This analysis finds that the production of food crops is more strongly affected by population growth than by any other driver. Demand for staple foods is generally less elastic than that for animal products and biofuels, meaning the total consumption of food crops remains closely linked to population. However, processed foods represent one way to increase the per capita consumption of some crops, particularly corn and sugar [64] [65] .
Demand for animal products—meat, dairy and eggs—varies more as a function of income, expressed here as stronger influence from the economic growth and consumption drivers. Livestock production creates pressure on land resources in (and downstream from) places where ranching and intensive livestock raising occur, as well as where crops are produced for feed. For example, the total area harvested for soy, an important feed crop, roughly quadrupled over the 30-year period up to 2009 [13] .
Governance and trade are seen as the most influential processes driving the increased production of biofuels. This reflects the crucial role that quantity-based biofuel mandates have played in creating markets and incentives for expanded biofuel production [66] . It also reflects the challenges that subsequent policy measures such as “sustainability criteria” and voluntary certification have faced in attenuating the environmental impacts of
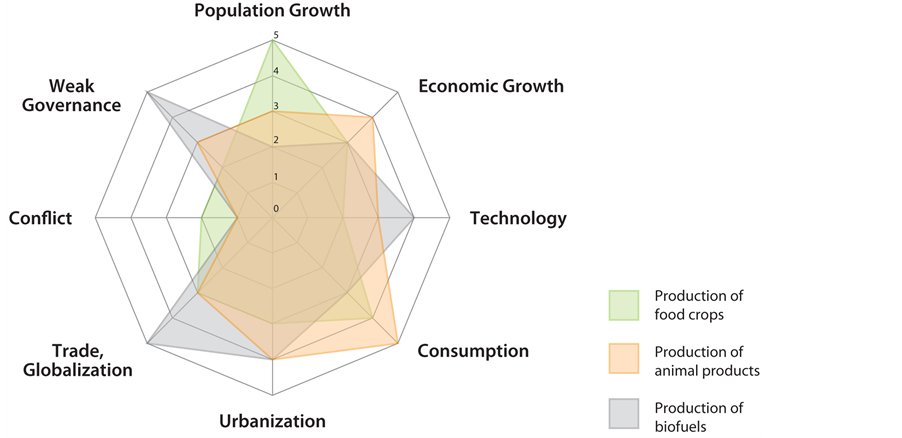
Figure 4. Overlaid Kiviat diagrams for production of food crops, animal products and biofuels.
widespread production of feedstocks such as sugarcane, corn, oil palm and soy [67] . Biofuel production has also been driven by technological advances that enable new ways of deriving biofuels and the ability to use them in a wider range of engines. Urbanization and consequently higher liquid fuel consumption also play a role.
Does this set of results suggest a strategy for intervention that could reduce pressure on land from food, feed and biofuel production simultaneously? This analysis resonates with Smith et al.’s [11] assertion that further policies addressing the primary drivers of competition for land (population growth, dietary preference, protected areas, forest policy) could significantly contribute to reducing competition for land. Population, economic growth and consumption have broad influence on food, feed and biofuel production, making them potentially attractive areas for intervention. However, these drivers are attached to deep-seated normative values and addressing them directly can be very difficult. In such cases indirect leverage points can be used to approach underlying drivers. For example, initiatives to improve education and technological capacity can reduce impacts linked to population growth, while resource efficiency strategies can help to curb some impacts of increased consumption and economic activity.
5.2. On the Use of the Kiviat Technique
The preceding diagrams explore the interactions between drivers and pressures of environmental change at a global level. How well suited is the Kiviat technique for this task? The “spider webs”, through the patterns they revealed, opened up a way of thinking about potentially synergistic policy interventions and trade-offs that did not otherwise find their way into the GEO-5 discussion. Moreover, generating the “spider webs” through an iterative process of reflective dialogue and mutual learning, as we have done, enabled an integration of different vantage points and illuminated, for example, new insights into less-obvious systemic interactions and possible feedbacks. However, the illustrative and analytical contributions of this exercise should not be confused with predictive power or nuanced explanation. Working at such a high level of aggregation and abstraction inevitably masks important differences in the political and institutional context in different locations and across scales. The Kiviat diagrams as applied here also cannot account for crucial place-specific social factors. While the global analysis presented here should not be generalized to local circumstances, we believe the same technique could be applied—with similar caveats—to analyze interactions at other scales.
Many drivers and pressures interact in unpredictable ways. While it may be impossible to completely avoid unintended consequences within complex systems, visualization techniques such as this one may help to better understand patterns of interaction and anticipate possible synergies and frictions.
Of course applying this method—on any complex system with high uncertainty—comes with limitations and warrants further study. One particular risk of Kiviat diagrams is that users may interpret the area of a graph as an indicator of the magnitude of impact associated with a given pressure. However, this is not accurate. If a localized pressure is strongly influenced by several drivers, it may generate a diagram with a greater area than a pressure with aggregate impact of continental proportions, if the latter is strongly influenced by fewer drivers.
5.3. A Knowledge-Intermediary Tool for IEAs
Based on the work presented here, we argue that the Kiviat exercise offers a unique conceptual tool for depicting and communicating complex relationships. Both a strength and limitation of the Kiviat diagramming exercise is this power to represent complex interactions at a glance. While the ability to recognize patterns through shapes could help non-specialist audiences or decision makers to rapidly take in the results of a collaborative assessment process, the Kiviat exercise (and resulting diagrams) should serve as an entry point for dialogue and mutual learning, rather than be interpreted as a prescription for desirable courses of action.
To this end, using this technique, as we try to show in this paper, can facilitate visualization of information in a way that supports intuitive interaction; stimulates and assists the analysis of causality in complex systems; and enables a way of communicating patterns that allows users to appreciate unpredictable interactions. Moreover, the Kiviat technique can evoke a productive interaction between actors—by collectively capturing, interpreting and visualizing multiple layers of analysis—that inadvertently exposes important assumptions and biases linked to people’s values, beliefs, policy orientations, cultural practice, and experience and expertise.
Taking these assertions a step further, we propose that the Kiviat exercise could provide an accessible and potentially valuable “knowledge-intermediary”3 tool at the science-policy interface addressing critical contemporary issues that require productive interactions among science, society and policy (i.e., making science-based information more effective components of societal discourse and public policy action). If strategically applied, for example during the framing and problem analysis stages of future Integrated Environmental Assessment processes, such an exercise could enable new opportunities to address certain barriers and broken bridges at the science-policy interface, not least the need for improved communication and engagement. Bridging science and policy (or practice), in virtually any context, involves a variety of actors and institutions, possible pathways, a complex web of interactions, and thus, by necessity, mutual responsibility towards a convergence of interests [65] [68] . The value of engaging a wider spectrum of knowledge types into scientific investigations of environmental change and land degradation is well recognized [69] . In the IEA context, “boundary” organizations that engage with more than one major community of knowledge and practice (e.g., UNEP) have faced formidable challenges in reconciling the inherent tensions and diverging motivations at the science-policy interface [45] . These are often amplified during the later phases of the knowledge production process. Jones et al. [70] suggest that a key friction exists between the need to encourage specialized expertise versus efforts to “democratize” knowledge, so as to deepen the engagement of certain actors. Thus agreement is emerging from a growing literature [68] [71] -[76] that suggests that improving productive interactions among science, society and policy in the 21st century will require a new generation of integrated tools and approaches that emphasize “two-way” communication and that facilitate improved dialogue and better engagement on both ends of the producer-user spectrum in co-generating actionable, evidence-based policy responses.
This paper has argued that the Kiviat diagram technique can help in understanding and communicating multivariate relationships, and arrived at this conclusion through a process that was set up to produce an integrated environmental assessment—GEO-5. It is worth reflecting on parallels between the content and the process of such an undertaking. Integrated environmental assessments are expected to address profoundly complex, multi-faceted problems and—crucially—to do so through a process of collaborative knowledge production involving large teams with diverse geographical, cultural and disciplinary backgrounds. Complex interactions are thus a feature of the process of conducting an integrated environmental assessment as well as its subject material. While this paper has discussed the contribution of the Kiviat technique in terms of visualizing, understanding and communicating causality in complex systems (drawing on discussions that had already occurred in the context of GEO-5), it is also worth considering the possibility that this technique could be used to help guide and focus problem analysis during the course of future IEA processes.
6. Conclusions
This work has presented a conceptual tool to stimulate and support the analysis of causality in complex systems in general, and land systems in particular. It has identified clusters of drivers with relatively strong influence on particular combinations of pressures, acknowledging both the importance and difficulty of addressing multiple drivers in an integrated way.
We argue that this technique is well suited for stimulating collective thinking, discussion and deliberation about causality in complex systems and the links between science and policy. While it can help identify areas where policies targeting particular drivers or combinations of drivers might produce synergistic benefits, it does not help answer the difficult question of what kinds of policy measures would be feasible or acceptable in specific contexts.
Finally, we have shown how applying this exercise as a knowledge-intermediary tool could contribute to integrated environmental assessments, and (relatedly) enable improved communication and inclusive dialogue between the science and policy communities—keeping in mind caveats related to nuance, unanticipated outcomes, political-institutional context and scale.
Acknowledgments
The authors are grateful to the experts and reviewers of the GEO-5 assessment, in particular the Land and Drivers working groups. We also thank the UNEP Secretariat for providing a platform for this research and two anonymous reviewers for their feedback and comments on the manuscript. While this paper draws on the GEO-5 process, it reflects the views of the authors and not the chapter working groups or UNEP as a whole. An earlier version of this work was presented as a poster at the 2012 Planet Under Pressure conference in London.
References
- Scheffer, M., Bascompte, M., Brock, J., Brovkin, W.A., Carpenter, V., Dakos, S.R., Held, V., van Nes, H., Rietkerk, E.H. and Sugihara, G. (2009) Early-Warning Signals for Critical Transitions. Nature, 461, 53-59. http://dx.doi.org/10.1038/nature08227
- Rockström, J., Steffen, W., Noone, K., Persson, Å., Chapin III, F.S., Lambin, E., Lenton, T.M., Scheffer, M., Folke, C., Schellnhuber, H., Nykvist, B., De Wit, C.A., Hughes, T., van der Leeuw, S., Rodhe, H., Sörlin, S., Snyder, P.K., Costanza, R., Svedin, U., Falkenmark, M., Karlberg, L., Corell, R.W., Fabry, V.J., Hansen, J., Walker, B., Liverman, D., Richardson, K., Crutzen, P. and Foley, J. (2009) Planetary Boundaries: Exploring the Safe Operating Space for Humanity. Ecology and Society, 14, 32.
- Barnosky, A.D., Hadly, E.A., Bascompte, J., Berlow, E.L., Brown, J.H., Fortelius, M., Getz, W.M., Harte, J., Hastings, A., Marquet, P.A, Martinez, N.D., Mooers, A., Roopnarine, P., Vermeij, G., Williams, J.W., Gillespie, R., Kitzes, J., Marshall, C., Matzke, N., Mindell, D.P., Revilla, E. and Smith, A.B. (2012) Approaching a State Shift in Earth’s Biosphere. Nature, 486, 52-58. http://dx.doi.org/10.1038/nature11018
- Davidson, E.A., de Araújo, A.C., Artaxo, P., Balch, J.K., Brown, I.F., Bustamante, M.M.C., Coe, S., DeFries, R.S., Keller, M., Longo, M., Munger, J.W., Schroeder, W., Soares-Filho, B.S., Souza, C.M. and Wofsy, S.C. (2012) The Amazon Basin in Transition. Nature, 481, 321-328. http://dx.doi.org/10.1038/nature10717
- AMAP (2011) Snow, Water, Ice, Permafrost in the Arctic: (SWIPA): Climate Change and the Cryosphere. Arctic Monitoring and Assessment Secretariat, Oslo, 538 p.
- Schaefer, K., Lantuit, H., Wegener, A., Romanovsky, V.E., Schuur, E.A.G and Gärtner-Roer, I. (2012) Policy Implications of Warming Permafrost. United Nations Environment Programme, Nairobi.
- Lawrence, D.M., Slater, A.G., Tomas, R.A., Holland, M.M. and Deser, C. (2008) Accelerated Arctic Land Warming and Permafrost Degradation during Rapid Sea Ice Loss. Geophysical Research Letters, 35, L11356. http://dx.doi.org/10.1029/2008GL033985
- Schaefer, K., Zhang, T., Bruhwiler, L. and Barrett, A.P. (2011) Amount and Timing of Permafrost Carbon Release in Response to Climate Warming. Tellus B, 63, 165-180. http://dx.doi.org/10.1111/j.1600-0889.2011.00527.x
- Herreroand, M. and Thornton, P.K. (2012) Production Systems for the Future: Balancing Trade-Offs between Food Production, Efficiency, Livelihoods and the Environment. CGIAR, Nairobi.
- UNEP (2012) Fifth Global Environment Outlook Report: Environment for the Future We Want. United Nations Environment Programme, Earthprint, Nairobi.
- Smith, P., Gregory, P.J., van Vuuren, D., Obersteiner, M., Havlík, P., Rounsevell, M., Woods, J., Stehfest, E. and Bellarby, J. (2010) Competition for Land. Philosophical Transactions of the Royal Society B, 365, 2941-2957. http://dx.doi.org/10.1098/rstb.2010.0127
- Foley, J.A., Ramankutty, N., Brauman, K.A., Cassidy, E.S., Gerber, J.S., Johnston, M., Mueller, N.D., O’Connell, C., Ray, D.K., West, P.C., Balzer, C., Bennett, E.M., Carpenter, S.R., Hill, J., Monfreda, C., Polasky, S., Rockström, J., Sheehan, J., Siebert, S., Tilman, D. and Zaks, D.P.M. (2011) Solutions for a Cultivated Planet. Nature, 478, 337-342. http://dx.doi.org/10.1038/nature10452
- FAO (2012) FAO Statistics. Food and Agriculture Organisation of the United Nations, Rome.
- FAO (2011) State of the World’s Forests. Food and Agriculture Organization of the United Nations, Rome.
- MA (2005) Millennium Ecosystem Assessment: Ecosystems and Human Well-Being. 1 Current State and Trends. Island Press, Washington, D.C.
- IPCC (2007) Climate Change 2007: The Physical Science Basis. Contribution of Working Group I to the Fourth Assessment Report of the Intergovernmental Panel on Climate Change. Cambridge University Press, Cambridge, New York.
- UNEP (2007) Fourth Global Environment Outlook Report (GEO-4). United Nations Environment Programme. Earthprint, Nairobi.
- IAASTD (2009) The International Assessment of Agricultural Science and Technology for Development. Island Press, Washington D.C.
- Nelson, G.C., Bennett, E., Berhe, A.A., Cassman, K., DeFries, R., Dietz, T., Dobermann, A., Dobson, A., Janetos, A., Levy, M., Marco, D., Nakicenovic, N., O’Neill, B., Norgaard, R., Petschel-Held, G., Ojima, D., Pingali, P., Watson, R. and Zurek, M. (2006) Anthropogenic Drivers of Ecosystem Change: An Overview. Ecology and Society, 11, 29.
- Liu, J., Dietz, T., Carpenter, S.R., Folke, C., Alberti, M., Redman, C.L., Schneider, S.H., Ostrom, E., Pell, A.N., Lubchenco, J., Taylor, W.W., Ouyang, Z., Deadman, P., Kratz, T. and Provencher, W. (2007) Coupled Human and Natural Systems. AMBIO: A Journal of the Human Environment, 36, 639-649.
- Hersperger, A.M., Gennaio, M., Verburgand, P.H. and Bürgi, M. (2010) Linking Land Change with Driving Forces and Actors: Four Conceptual Models. Ecology and Society, 15, 1.
- Carpenter, S.R., Bennett, E.M. and Peterson, G.D. (2006) Editorial: Special Feature on Scenarios for Ecosystem Services. Ecology and Society, 11, 32.
- Carpenter, S.R., Mooney, H.A, Agard, J., Capistrano, D., Defries, R.S. and Diaz, S. (2009) Science for Managing Ecosystem Services: Beyond the Millennium Ecosystem Assessment. Proceedings of the National Academy of Sciences, 106, 1305-1312. http://dx.doi.org/10.1073/pnas.0808772106
- Giest, H. and Lambin, E. (2002) Proximate Causes and Underlying Driving Forces of Tropical Deforestation. Bioscience, 15, 143-150. http://dx.doi.org/10.1641/0006-3568(2002)052[0143:PCAUDF]2.0.CO;2
- Hayes, K. (2002) Update on Coltan Mining in the Democratic Republic of Congo. Oryx, 36, 12-13.
- Sutherland, E. (2011) Coltan, the Congo and your Cell Phone: The Connection between Your Mobile Phone and Human Rights Abuses in Africa. LINK Centre, University of the Witwatersrand, South Africa.
- Smith, J.H. and Mantz, J.W. (2006) Do Cellular Phones Dream of Civil War? The Mystification of Production and the Consequences of Technology Fetishism in the Eastern Congo. In: Kirsch, M. and Nash, J., Eds., Inclusion and Exclusion in the Global Arena, Routledge, New York, 71-93.
- Jackson, S. (2003) Fortunes of War: The Coltan Trade in the Kivus. HPG Background Paper, London.
- Smith, J.H., (2011). Tantalus in the Digital Age: Coltan Ore, Temporal Dispossession, and “Movement” in the Eastern Democratic Republic of the Congo. American Enthologist, 38, 17-35. http://dx.doi.org/10.1111/j.1548-1425.2010.01289.x
- Pimentel, D., Marklein, A., Toth, M.A., Karpoff, M.N., Paul, G.S., McCormack, R., Kyriazisand, J. and Krueger, T. (2009) Food versus Biofuels: Environmental and Economic costs. Human Ecology, 37, 1-12. http://dx.doi.org/10.1007/s10745-009-9215-8
- Jackson, R.J., Minjares, R., Naumoff, K.S., Shrimali, B.P. and Martin, L.K. (2009) Agriculture Policy Is Health Policy. Journal of Hunger and Environmental Nutrition, 4, 393-408.
- Wallinga, D. (2010) Agricultural Policy and Childhood Obesity: A Food Systems and Public Health Commentary. Health Affairs, 29, 405-10. http://dx.doi.org/10.1377/hlthaff.2010.0102
- Adger, W.N. and Jordan, A. (2009) Governing Sustainability. Cambridge University Press, Cambridge.
- Marshall, N.A., Park, S.E., Adger, W.N., Brown, K. and Howden, S.M. (2012) Transformational Capacity and the Influence of Place and Identity. Environmental Research Letters, 7, 9 p. http://dx.doi.org/10.1088/1748-9326/7/3/034022
- Stirling, A. (2013) From Sustainability, through Diversity to Transformation: Towards More Reflexive Governance of Technological Vulnerability. In: Hommels, A.M.J. and Bijker, W.E., Eds., Vulnerability in Technological Cultures: New Directions in Research and Governance, MIT Press, Cambridge, 408 p.
- Carpenter, S.R., DeFries, R., Dietz, T., Mooney, H.A., Polasky, S. and Reid, W.V. (2006) Millennium Ecosystem Assessment: Research Needs. Science, 314, 257-258. http://dx.doi.org/10.1126/science.1131946
- EEA (1995) Europe’s Environment: The Dobris Assessment. European Environment Agency, Copenhagen.
- Carr, E.R., Wingard, P.M., Yorty, S.C., Thompson, M.C., Jensen, N.K. and Robertson, J. (2007) Applying DPSIR to Sustainable Development. International Journal of Sustainable Development and World Ecology, 14, 543-555. http://dx.doi.org/10.1080/13504500709469753
- Svarstad, H., Petersen, L.K., Rothman, D., Siepel, H. and Wätzold, F. (2008) Discursive Biases of the Environmental Research Framework DPSIR. Land Use Policy, 25, 116-125. http://dx.doi.org/10.1016/j.landusepol.2007.03.005
- Rekolainen, S., Kämäri, J., Hiltunen, M. and Salorantac, T.M. (2003) A Conceptual Framework for Identifying the Need and Role of Models in the Implementation of the Water Framework Directive. International Journal of River Basin Management, 1, 347-352.
- Berger, A.R. and Hodge, R.A. (1998) Natural Change in the Environment: A Challenge to the Pressure-State-Response Concept. Social Indicators Research, 44, 255-265. http://dx.doi.org/10.1023/A:1006888532080
- Gabrielson, P. and Bosch, P. (2003) Environmental Indicators: Typology and Use in Reporting. EEA Internal Working Paper, Copenhagen.
- Giupponi, C. (2002) From the DPSIR Reporting Framework to a System for a Dynamic and Integrated Decision Making Process. Venice.
- Pintér, L., Swanson, D. and Chenje, J. (2007) GEO Resource Book: A Training Manual on Integrated Environmental Assessment and Reporting (Module Overviews). UN Environment Programme and International Institute for Sustainable Development, Nairobi.
- Jabbour, J., Keita-Ouane, F., Hunsberger, C., Sánchez-Rodríguez, R., Gilruth, P., Levy, M.A., Patel, N., Singh, A. and Schwarzer, S. (2012) Internationally Agreed Environmental Goals: A Critical Evaluation of Progress. Environmental Development, 3, 5-24. http://dx.doi.org/10.1016/j.envdev.2012.05.002
- Friendly, M. and Denis, D.J. (2001) Milestones in the History of Thematic Cartography, Statistical Graphics, and Data Visualization. York University, Toronto.
- Kolence, K.W. and Kiviat, P.J. (1973) Software Unit Profiles and Kiviat Figures. ACM Sigmetrics. Performance Evaluation Review, 2, 34-39.
- Bamford, J. (2005) Implementing Quality: A Practical Guide to Tools and Techniques. International Journal of Operations and Production Management, 25, 1034.
- Shepherd, C. and Günter, H. (2006) Measuring Supply Chain Performance: Current Research and Future Directions. International Journal of Productivity and Performance Management, 55, 242-258. http://dx.doi.org/10.1108/17410400610653219
- Horatiu, C. (2008) Performance Metrics in Downstream Supply Chain. Doctoral Dissertation, University of Padova, Padova.
- Stewart, C.A., Link, M., McCaulay, D.S., Rodgers, G., Turner, G., Hancock, D., Wang, P., Saied, F., Pierce, M., Aiken, R., Mueller, M.S., Jurenz, M., Lieber, M., Tillotson, J. and Plale, B.A. (2010) Implementation, Performance, and Science Results from a 30.7 TFLOPS IBM Blade Center Cluster. Concurrency and Computation: Practice and Experience, 22, 157-174.
- World Bank (2009) Environmental Crises or Sustainable Development Opportunity? Transforming the Charcoal Sector in Tanzania. The World Bank, Washington DC.
- Girard, P. (2004) Charcoal Production and Use in Africa: What Future? Unasylva: An International Journal of Forestry and Forest Industries, 54, 30-33.
- Kuser, J.E. (2007) Urban and Community Forest in the Northeast. 2nd Edition, Springer, Berlin. http://dx.doi.org/10.1007/978-1-4020-4289-8
- Heltberg, R. (2005) Factors Determining Household Fuel Choice in Guatemala. Environmental and Development Economics, 10, 337-361.
- Nyembe, M. (2011) An Econometric Analysis of Factors Determining Charcoal Consumption by Urban Households: The Case of Zambia. Master’s Thesis, Swedish University of Agricultural Sciences, Ultuna.
- Agrawal, A., Chhatre, A. and Hardin, R. (2008) Changing Governance of the World’s Forests. Science, 320, 1460- 1462. http://dx.doi.org/10.1126/science.1155369
- Turner, A., Buongiorno, J., Katz, A., Zhu, S. and Li, R. (2008) Economic Incentives Exist to Support Measures to Reduce Illegal Logging. International Forestry Review, 10, 74-80. http://dx.doi.org/10.1505/ifor.10.1.74
- Nellemann, C. (2012) INTERPOL Environmental Crime Programme. In: Green Carbon, Black Trade: Illegal Logging, Tax Fraud and Laundering in the Worlds Tropical Forests. A Rapid Response Assessment, United Nations Environment Programme, GRID Arendal.
- Angelsen, A., Brockhaus, M., Kanninen, M., Sills, E., Sunderlin, W.D. and Wertz-Kanounnikoff, S. (2009) Realising REDD+: National Strategy and Policy Options. CIFOR, Bogor.
- Larson, A.M. and Petkova, E. (2011) An Introduction to Forest Governance, People and REDD+ in Latin America: Obstacles and Opportunities. Forests, 2, 86-111. http://dx.doi.org/10.3390/f2010086
- Corbera, E. and Schroeder, H. (2011) Governing and Implementing REDD+. Environmental Science and Policy, 14, 89-99. http://dx.doi.org/10.1016/j.envsci.2010.11.002
- Kissinger, G., Herold, M. and De Sy, V. (2012) Drivers of Deforestation and Forest Degradation: A Synthesis Report for REDD+ Policymakers. Lexeme Consulting, Vancouver.
- Vos, M.B., Kimmons, J.E., Gillespie, C., Welsh, J. and Blanck, H.M. (2008) Dietary Fructose Consumption among US Children and Adults: The Third National Health and Nutrition Examination Survey. Medscape Journal of Medicine, 10, 160-168.
- Monteiro, C.A., Levy, R.B., Claro, R.M., de Castro, R.R.I. and Cannon, G. (2010) Increasing Consumption of UltraProcessed Foods and Likely Impact on Human Health: Evidence from Brazil. Public Health Nutrition, 14, 5-13.
- Mitchell, C., Sawin, J.L., Pokharel, G.R., Kammen, D., Wang, Z., Fifita, S., Jaccard, M., Langniss, O., Lucas, H., Nadai, A., Trujillo Blanco, R., Usher, E., Verbruggen, A., Wüstenhagen, R., and Yamaguchi, K. (2011) Policy, Financing and Implementation, In: Edenhofer, O., Pichs-Madruga, R., Sokona, Y., Seyboth, K., Matschoss, P., Kadner, S., Zwickel, T., Eickemeier, P., Hansen, G., Schlömer, S. and Von Stechow, C., Eds., IPCC Special Report on Renewable Energy Sources and Climate Change Mitigation, Cambridge University Press, Cambridge, New York..
- Bailis, R. and Baka, J. (2011) Constructing Sustainable Biofuels: Governance of the Emerging Biofuel Economy. Annals of the Association of American Geographers, 101, 827-838.
- Vogel, C., Moser, S.C., Kasperson, R.E. and Dabelko, G.D. (2007) Linking Vulnerability, Adaptation and Resilience Science to Practice: Pathways, Players and Partnerships. Global Environmental Change, 17, 349-364. http://dx.doi.org/10.1016/j.gloenvcha.2007.05.002
- Reed, M.S., Buenemann, M., Atlhopheng, J., Akhtar-Schuster, M., Bachmann, F., Bastin, G., Bigas, H., Chanda, R., Dougill, A.J., Essahli, W., Evely, A.C., Fleskens, L., Geeson, N., Glass, H.J., Hessel, R., Holden, J., Ioris, A.A.R., Kruger, B., Liniger, H.P., Mphinyane, W., Nainggolan, D., Perkins, J., Raymond, C.M., Ritsema, C.J., Schwilch, G., Sebego, R., Seely, M., Stringer, L.C., Thomas, R., Twomlow, S. and Verzandvoort, S. (2011) Cross-Scale Monitoring and Assessment of Land Degradation and Sustainable Land Management: A Methodological Framework for Knowledge Management. Land Degradation Development, 22, 261-271. http://dx.doi.org/10.1002/ldr.1087
- Jones, N., Jones, H. and Walsh, C. (2008) Political Science? Strengthening Science-Policy Dialogue in Developing Countries. ODI Working Paper 294, London.
- Komiyama, H. and Takeuchi, K. (2006) Sustainability Science: Building a New Discipline. Sustainability Science, 1, 1-6. http://dx.doi.org/10.1007/s11625-006-0007-4
- Weichselgartner, J. and Kasperson, R.E. (2010) Barriers in the Science-Policy-Practice Interface: Toward a Knowledge Action-System in Global Environmental Change Research. Global Environmental Change, 20, 266-277.
- Solinís, G. and Bayá-Laffite, N. (2011) Mapping out the Research-Policy Matrix: A Report on the Outputs from the First International Forum on the Social Science-Policy Nexus. UNESCO, Paris, 245.
- Jones, H., Jones, N., Shaxson, L. and Walker, D. (2012) Knowledge, Policy and Power in International Development: A Practical Guide. The Policy Press, Bristol.
- Salas-Zapata, W.A., Rios-Osorio, L.A. and Trouchon-Osorio, A.L. (2012) Typology of Scientific Reflections Needed for Sustainability Science Development. Sustainability Science, 7, 25-43.
- McCollum, D.L., Krey, V. and Riahi, K. (2011) An Integrated Approach to Energy Sustainability. Nature Climate Change, 1, 428-429.
NOTES

*Corresponding author.

1GEO-5 identifies population and economic development as two major drivers with particularly strong influence on systemic interactions. Other drivers include technology, urbanization, globalization and trade, values, conflict and governance. The pressures that these drivers exert can include resource extraction, land use change, land degradation, and modification and movement of organisms.

2REDD+ is a financial mechanism—currently being negotiated under the UN Framework Convention on Climate Change—to shift the incentives from deforestation and land use change, a significant factor of emissions, to forest conservation and sustainability .

3Use of the term knowledge intermediary here borrows from and builds on the work of Jones et al. regarding the critical role of individuals or institutions at the science-policy interface—beyond information provisioning—toward facilitating and brokering a mutual understanding between research and policy communities through more effective and inclusive dialogue.