Natural Resources
Vol. 3 No. 2 (2012) , Article ID: 20224 , 8 pages DOI:10.4236/nr.2012.32008
Water Saturation Dependence on CO2 Sorption Potential of Sandstones
![]()
1Institute for Geo-Resources and Environment, National Institute of Advanced Industrial Science and Technology (AIST), Tsukuba, Japan; 2Fracture and Reliability Research Institute, Tohoku University, Sendai, Japan; 3Research Center of Supercritical Fluid Technology, Tohoku University, Sendai, Japan.
Email: takashi.fujii@aist .go.jp
Received February 13th, 2012; revised March 16th, 2012; accepted March 25th, 2012
Keywords: CO2; Water Saturation; Sorption Potential; Sandstones
ABSTRACT
For the assessment of the carbon dioxide (CO2) storage potential of water-filled reservoir rocks (i.e., saline aquifers), it should be first important step for a thorough understanding of the effect of water content on CO2/water/rock interactions during CO2 injection. The purpose of this study is to examine the CO2 sorption amount for Kimachi sandstone and Berea sandstone at different water content using the manometric method at temperature of 50˚C and pressures of up to 20 MPa. Our results document that a significant quantity of CO2 was sorbed on the two types of sandstone on all water-saturated bases, which corresponded to the amount adsorbed on the air-dry basis. Also, all the wet samples had significantly higher sorption capacity than the theoretical values calculated from the solubility model based on dissolution of CO2 in pore water and the pore-filling model, which assumes that the pore volume unoccupied by water is filled with CO2. Furthermore, the observations indicated a certain degree of correlation between the sorbed amount and the water content, except at pressures below the critical point for Berea sandstone. This investigation points out that CO2 sorption is a possible mechanism in CO2 geological storage even under water-saturated conditions and that the mechanism of sorption on silica and silicate minerals plays an essential role in the reliable and accurate estimation of the CO2 storage capacity of water-saturated reservoirs.
1. Introduction
In recent years, the development and deployment of new low-carbon technologies have been identified to be necessary for reducing carbon dioxide (CO2) emissions to a sufficient degree and thus stabilizing the CO2 levels in the atmosphere. Among these methods, the CO2 capture and sequestration (CCS) technology, which entails CO2 capture from large-scale industrial processes, mainly power generation based on fossil fuels, and injection into deep geological formations, is considered a potentially vital tool in achieving this goal. An important benefit of CCS is its potential for mitigating damage to the atmosphere without requiring profound changes to current lifestyles [1]. CO2 can be stored in a number of geological formations, including deep saline aquifers, depleted oil/gas fields, and unmineable coal seams.
CO2 storage in depleted oil/gas fields or coal seams associated with CO2 enhanced oil recovery (CO2-EOR) or CO2 enhanced coalbed methane (CO2-ECBM) technologies can be implemented, where such opportunities exist, and the cost of CO2 storage can be reduced by producing additional oil or methane. However, such gas fields and coal seams have limited capacity and geographic distribution [2]. In contrast, deep saline aquifers have large volumes of pore space that may be used to store CO2 and are widely distributed around the world [3]. This entails the need for accessing and developing deep saline aquifers for several years to come.
It is well known that estimating the CO2 storage capacity is very important for screening and assessing suitable storage sites relevant to CO2 geological sequestration. Currently, the methods used to calculate the CO2 storage capacity of deep saline aquifers suffer from major shortcomings of low accuracy, high complexity, and inappropriate scale. This is because the influence of various trapping mechanisms that do not operate in isolation but in complex, interdependent, and time-dependent ways is neglected in these calculations [4-8]. In fact, global assessment of the CO2 storage capacity gives a wide range of estimates, reflecting the different assumptions used as well as the uncertainty in the parameters [5].
Therefore, detailed analysis of the CO2 storage capacity essentially requires a thorough understanding of the CO2/water/rock interaction processes in deep saline aquifers. This will be an important step for the precise prediction of the fate of the injected CO2, which is relevant to the long-term security of CO2 storage, and for a reliable and accurate estimation of the CO2 storage capacity in deep saline aquifers.
In general, CO2 injected into water-filled reservoir rocks such as aquifers stays in the injection zone for a geologic time, eventually dissolves in the formation brine, and remains trapped by carbonate minerals. However, ideally, a large portion of the injected CO2 remains in the immiscible state [9]. Consequently, within the aquifer, CO2 may predominantly occur in two forms: 1) a CO2-rich dense phase that may contain some water and 2) an aqueous phase in which either CO2 dissolves in the formation water or reacts with the minerals in the rocks [10].
Up to now, hydrothermal autoclave experiments on CO2-rich dense and aqueous phases have only been conducted by Lin et al. [11] to understand the geochemical reactions in water-free supercritical CO2 (scCO2)/rock (scCO2/vapor/granite) and scCO2/water/granite reaction systems at geologically relevant temperatures and pressures that simulate the abovementioned CO2-rich dense and aqueous phases. They indicated that in the scCO2/ vapor/granite system, the amounts of major elements dissolved from the granite are much larger than those found in the CO2/water/granite system. They further indicated that calcite precipitates as a secondary mineral from Ca-rich water containing aqueous carbonate ions buffered by the coexisting scCO2 in the vapor/granite system within a short reaction period. Therefore, these results demonstrate that dissolution and precipitation reactions in the CO2/water/rock system are strongly dependent on the mole fraction of CO2 and water in scCO2/water/rock interaction processes.
Furthermore, CO2 sorption experiments carried out on a variety of rocks and minerals on air-dry and as-received bases have been reported [12-14], but the effect of water molecules on the CO2 sorption behavior in the pores of rocks has not been investigated.
The purpose of this study is to measure the CO2 sorption amount of sandstones for different water content at 50˚C and pressures of up to 20 MPa using the manometric method and to provide useful information for assessing the influence of water content on CO2 sorption on silica and silicate minerals.
The experimental temperature and pressure conditions are chosen for this paper because within geological reservoirs that could potentially be used to store CO2, its temperature and pressure conditions will lie around 50˚C and pressures up to 20 MPa at a depth of 1 to 2 km.
2. Experimental
2.1. Materials and Preparation
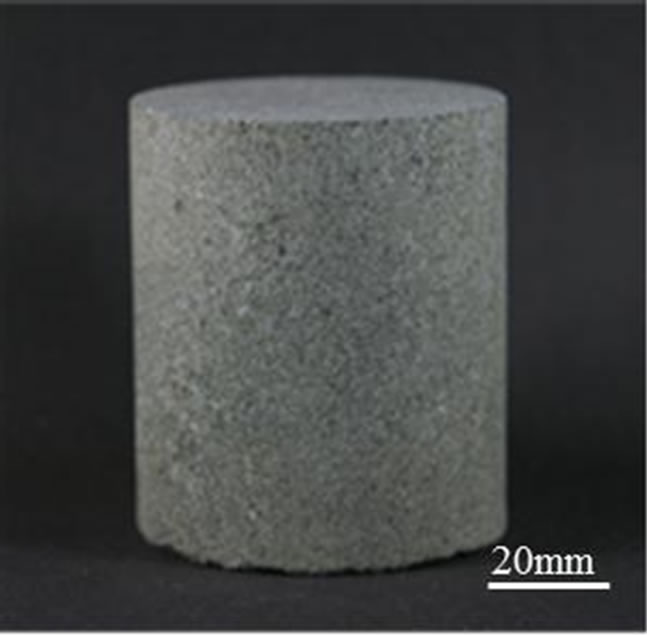
The samples used in this study were Kimachi sandstone (from Shishido-cho, Shimane, Japan) and Berea sandstone (from Ohio, USA), as shown in Figure 1. The bulk density and porosity of the samples were measured based on the principle of the Archimedes method [15]. The results are listed in Table 1. The chemical and mineral components of Kimachi sandstone and Berea sandstone have been described in detail by Lie et al. [16] and Wang and Nur [17], respectively.
Core test specimens were drilled perpendicular to the bedding plane by use of a diamond core bit and cut from each rock block with a diamond saw. The dimensions of each of the core specimens were about 60 mm in diameter and about 72 mm in length. All the cut samples were washed with distilled water.
The test specimens for the experiments on air-dry (water-free) and water-saturated bases were prepared by
 (a)
(a)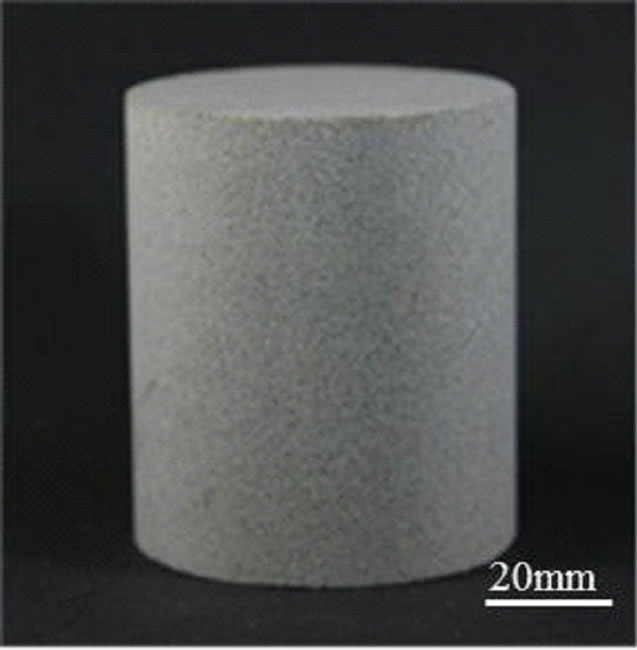 (b)
(b)
Figure 1. Photographs of test core specimens for (a) Kimachi sandstone and (b) Berea sandstone.
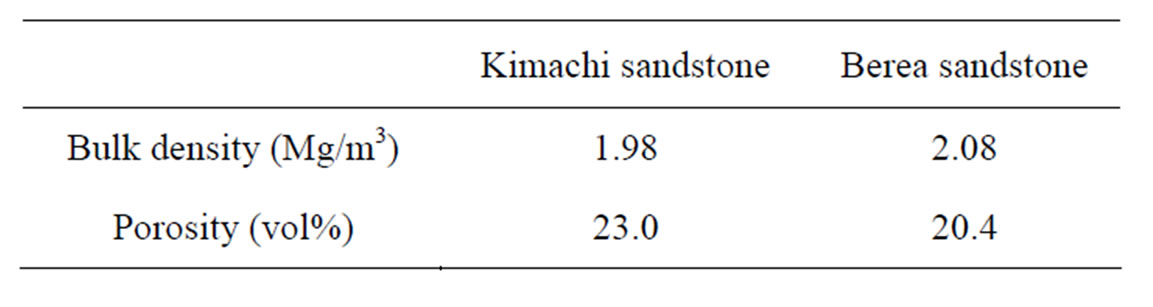
Table 1. Rock properties of test specimens.
the following procedure. For the experiment on the airdry basis, core specimens were dried under vacuum in an oven equipped with a rotary vacuum pump at 105˚C for at least 24 h. On the other hand, the samples for the experiment on the water-saturated basis were placed in a sealed desiccator containing distilled water and degassed under vacuum using a rotary pump for approximately 6 h, so that the pores of the samples were saturated with water. Then, these wet samples were preserved by immersion in water overnight.
The water content of the wet samples was determined from the mass gain resulting from the abovementioned immersion, by direct measurements at atmospheric pressure. In this paper, “water content” is defined as the volume fraction of water saturated in the pores of the sample, which in turn is calculated by the Archimedes principle.
Furthermore, for CO2 sorption measurements at different water content, after the immersion process, the wet samples were wrapped with a plastic film (Saran Wrap) to avoid uneven distribution of water in the pores and dried again in an oven at 105˚C until required for use of these tests. In this study, the sorption experiments were performed on twelve samples for Kimachi sandstone and four samples for Berea sandstone at different water content. The test conditions of water content for each sample are summarized in Table 2.
2.2. CO2 Sorption Measurements
The manometric method (i.e., pressure decay method), which has been described in detail previously [18], was employed. The experimental apparatus (AKICO, Tokyo, Japan), shown in Figure 2, has been used successfully for previous measurements on shale, limestone, and marlstone [12,13]. The experimental setup is mainly composed of a high-CO2-supply system, which allows for CO2 feed by pressuring CO2 from the gaseous state to the supercritical state, and a CO2 sorption measurement system to expose the test sample to CO2 at elevated temperatures and pressures. The sorption measurement system consists of a buffer tank and a sorption chamber, both of which are maintained a constant temperature by immersion in an air bath (accuracy: ±0.1˚C) throughout the experiment, as can be seen in Figure 2. The temperature and pressure readings for the two cells (buffer tank and sorption chamber) were independently monitored through a calibrated platinum resistance thermometer with ±0.05˚C accuracy and two high-pressure transducers (max. pressure 25 MPa for Druck: accuracy of 0.08% of F.S.), respectively. In this study, CO2 sorption measurements were performed at 50˚C and at pressures of up to 20 MPa. The volumes of the two cells containing fitting pipe lines were measured
|
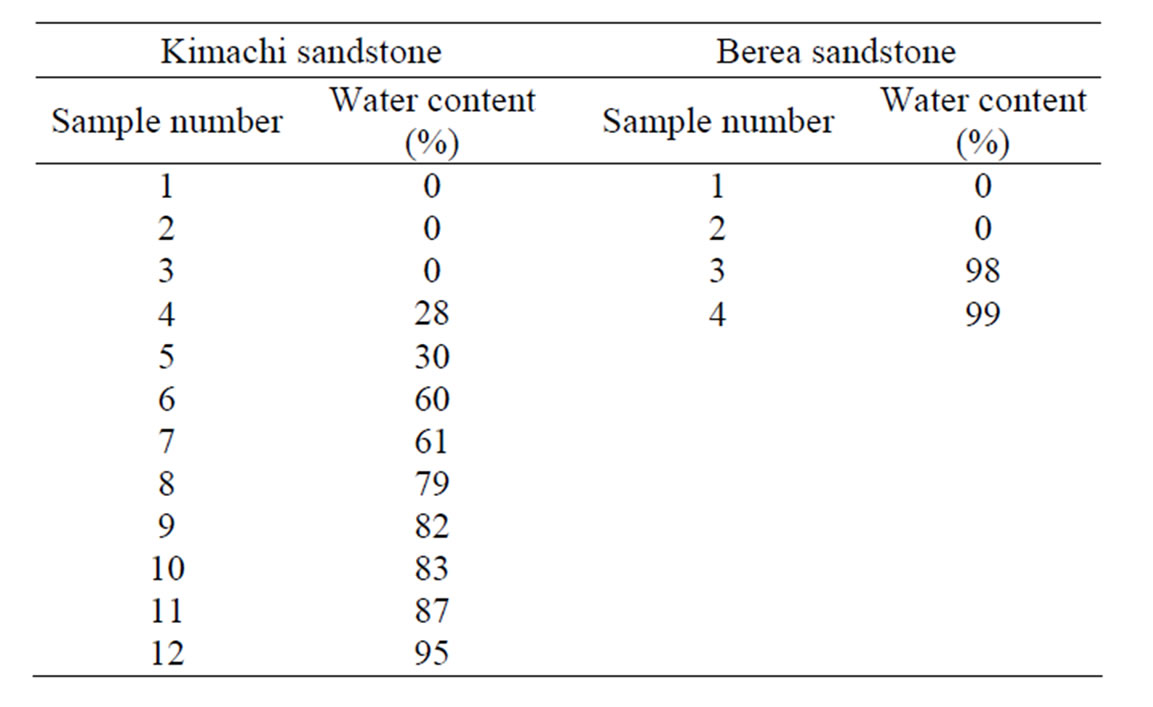
Table 2. Test conditions of water content for Kimachi sandstone and Berea sandstone.
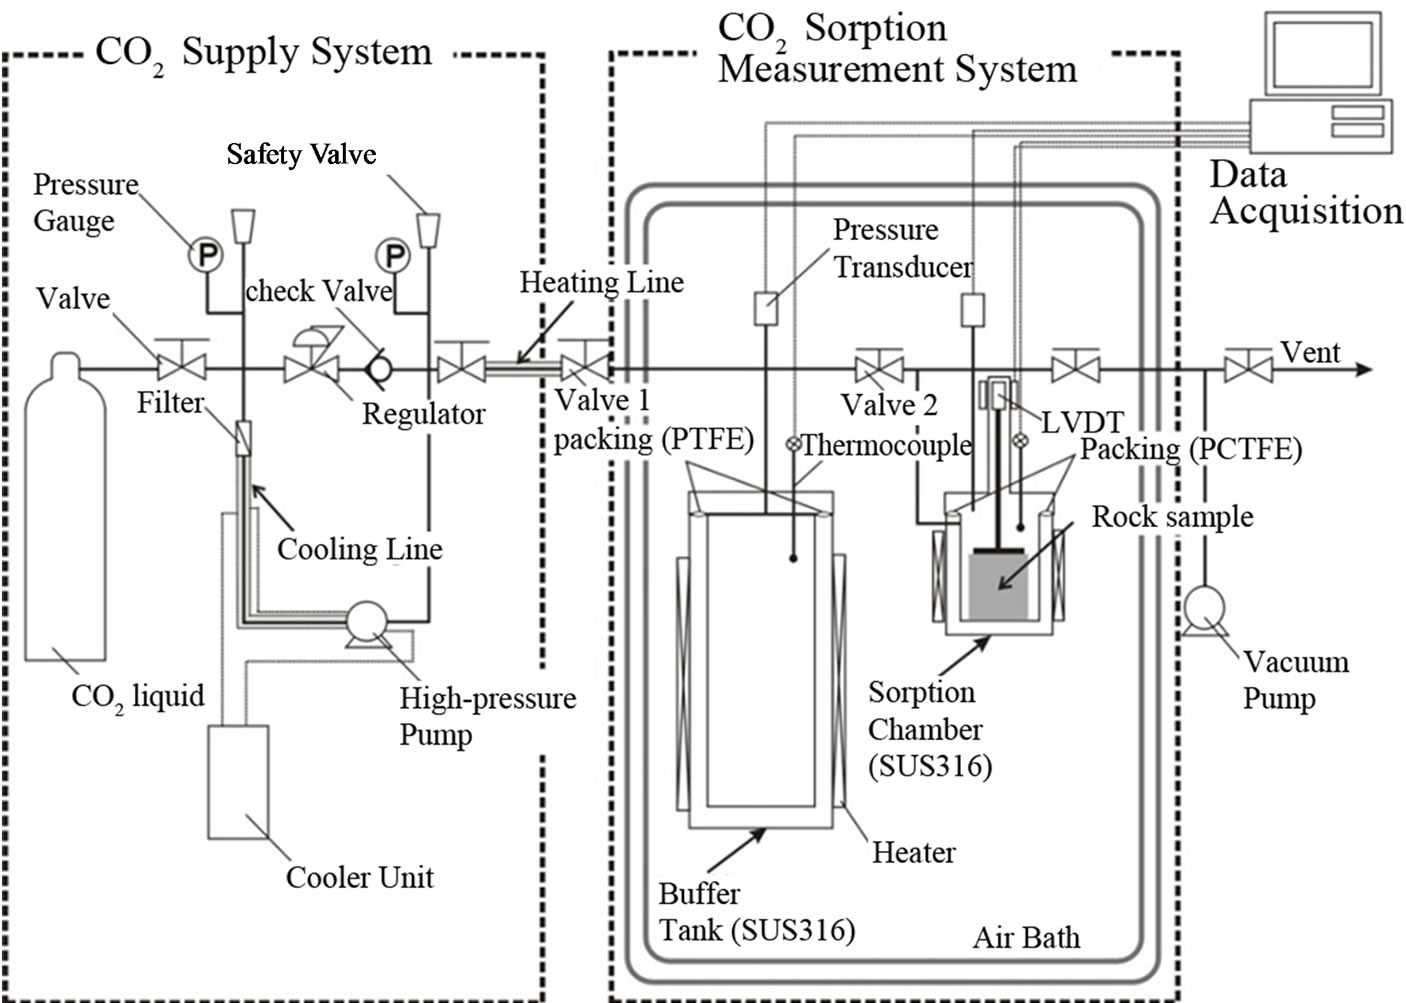
Figure 2. Schematic diagram of the experimental apparatus for CO2 sorption measurement system based on the manometric method.
The calibrated volumes were approximately 670 cm3 for the buffer tank and approximately 413 cm3 for the sorption chamber. In addition, the expected uncertainties in the volumes estimated by replicate runs were found to yield deviations of <2.0% and 1.3% in the mean volumes of the buffer tank and sorption chamber, respectively.
2.3. Experimental Procedure
The samples, which were prepared as explained in Section 2.1, were placed in the sorption chamber. After the temperature of the air bath was allowed to reach the desired level overnight, the samples were degassed by evacuating the two cells under vacuum by using a rotary pump for the experiment on the air-dry basis. In experiment under water-saturated conditions, however, the cells were purged with CO2 gas at low pressures (less than 1 MPa) in several cycles to prevent evaporation of water from the pores of the samples.
CO2 was transferred to the heating line by passing it through the cooling line and a high-pressure pump from a gas cylinder and then expanded into the buffer tank at the desired pressure through valve 1. During this period, the total number of moles of CO2 in the buffer tank is defined as the product of the buffer tank volume and the density of CO2, which can be calculated using the equation of state proposed by Span and Wagner [19].
Some CO2 was then transferred to the void volume in the sample chamber (the volume unoccupied by the samples) from the buffer tank via valve 2. The number of moles of CO2 transferred was calculated from the initial and final pressures in the buffer tank. The pressure in the sorption chamber then decayed because of the sorption of CO2 in the sample. Once equilibrium was reached, the amount of CO2 sorbed could be calculated by the mass balance in the two cells. These steps were repeated at sequentially higher pressures to yield a complete sorption isotherm. The CO2 sorption amount, determined by considering the dissolution of CO2 into the pore water of the sample, can provide the storage capacity, which is calculated using the following equation:
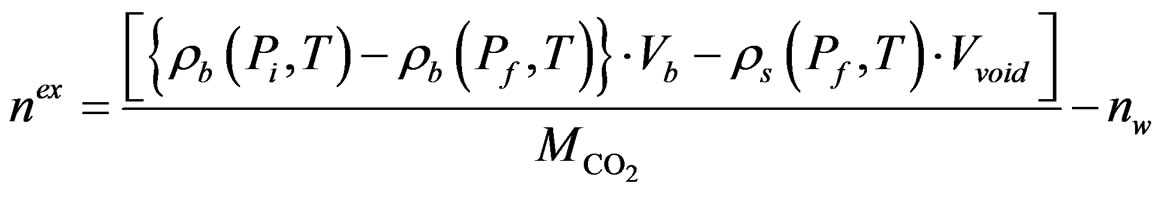 (1)
(1)
where  (P,T),
  (P,T) are the density of CO2 in the buffer tank and the sorption chamber, respectively, at pressure P and temperature T, Vb is the volume of the buffer tank, and Vvoid is the void volume, which is the difference between the sample volume and the calibrated volume of the sorption chamber determined using the helium expansion method.
  is the molecular mass of CO2. i, f represent initial and final stages, respectively. nw is the number of moles of CO2, which is determined by assuming that CO2 dissolved completely in the entire pore water of the sample (the “solubility model”) and is given as:
![]() (2)
(2)
here, Vr,  are the volume and porosity of the sample, respectively. ρw is the density of pore water in the liquid state (1000 kg/m3).
  is the CO2 solubility in distilled water, and the dissolution amount of CO2 is calculated using the literature data reported by Wiebe and Gaddy [20].
In this study, we attempt to compare the calculated sorbed amount determined using Equation (1) with the theoretical values based on two models: the solubility model and the pore-filling model. In the latter model, the CO2 storage capacity of the rock mass, np, is assumed to be equal to the amount of CO2 required for filling the entire pore volume of the sample and is given as:
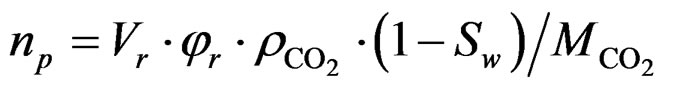 (3)
(3)
where , Sw are the density of CO2 and the degree of water saturation of the sample, respectively.
3. Results and Discussion
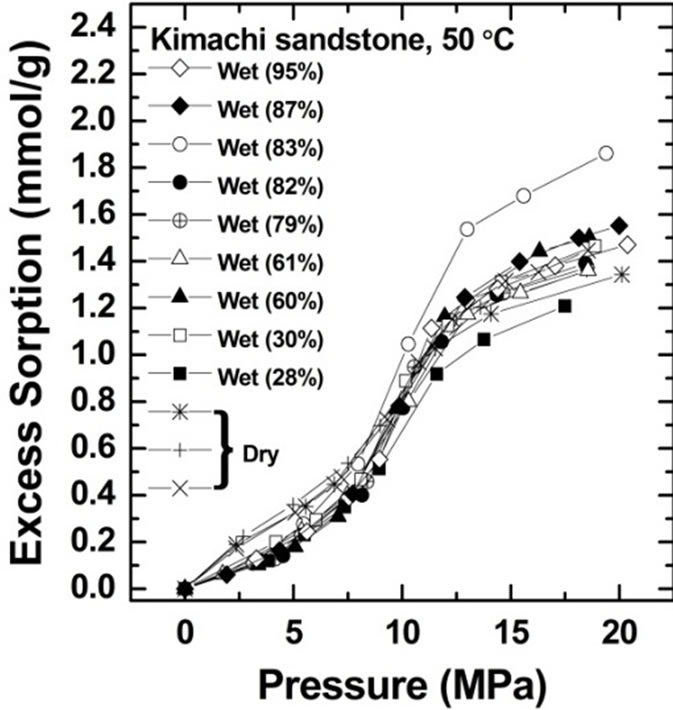
The CO2 sorption amount was measured for Kimachi sandstone at 50˚C and at pressures of up to 20 MPa. Figure 3 shows the CO2 sorption isotherms on water-saturated and air-dry (water-free) bases for Kimachi sandstone (Figure 3(a)) and Berea sandstone (Figure 3(b)).
All the rock samples tested on the water-saturated basis were found to have significant sorption capacity, similar to the samples tested on the air-dry basis by Busch et al. [12] and Fujii et al. [14].
Excess CO2 sorption isotherm data for Kimachi sandstone obtained from these experiments indicated that at pressures below the critical point (31˚C, 7.4 MPa), the CO2 sorption capacities of the wet samples were lower than those of the dry samples. At pressures above the critical point, the wet samples showed sorption capacities comparable to or higher than those in the case of the air-dry basis.
At low pressures, the wet samples of Berea sandstone exhibited sorption capacity comparable to that of the dry samples. In the supercritical region, the sorbed amount showed a trend similar to that observed for Kimachi sandstone and was in good agreement with the literature data for shale and kaolinite [12]. It should be noted that except in the low pressure region for Kimachi sandstone, this behavior is unexpected because water and CO2 are believed to compete for the same sorption sites.
As can be seen in Figure 3, the data for both Kimachi sandstone and Berea sandstone indicated that the sorbed amount increased sharply with increasing CO2 pressure
 (a)
(a)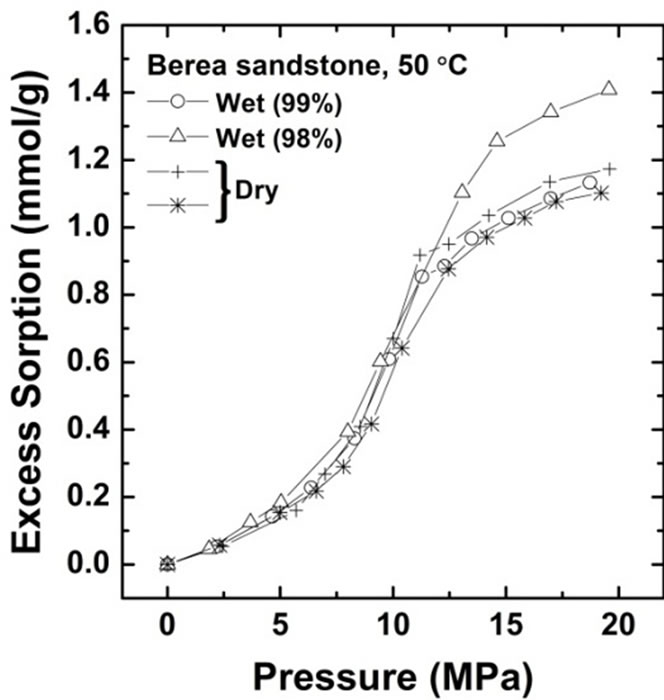 (b)
(b)
Figure 3. Gravimetric CO2 excess sorption uptake for Kimachi sandstone and Berea sandstone on air-dry and watersaturated bases at 50˚C.
beyond the critical point and began to level off after approximately 12 MPa. The observed increase sharply in excess sorption might be due to the bulk density and pressure dependence for CO2 in the vicinity of the critical temperature [21]. In fact, our observation seemed to be consistent with the previously reported variation in the CO2 bulk density with the CO2 pressure [19].
All the test samples showed an increasing trend in the excess sorption at pressures above 12 MPa.
In general, for coal [22-24], shale [12], and limestone [13], the high-pressure CO2 sorption isotherm data obtained using the manometric method indicates that the sorbed amount begins to decrease after approximately 10 MPa. This is in contrast to the data obtained in our experiment. Krooss et al. [22] stated that at pressures above 10 MPa, the CO2 sorption amount decreases because the difference in the CO2 density between the bulk and sorbed phases becomes smaller owing to a steep increase in the CO2 bulk density with pressure in the vicinity of the critical temperature. In this case, hence, the excess sorption evaluated after neglecting the sorbed phase volume is no longer justified. The sorbed phase density has mostly been predicted by fitting the sorption isotherm data calculated from some equation of states [25,26] and has been assumed to be almost equal to the liquid density at the triple point of CO2 [23]. However, no direct evaluation of the density of the sorbed CO2 phase has been conducted so far.
Moreover, the observed increasing trend in the sorption at high pressures was consistent with the literature data for the sorption isotherm of Berea sandstone determined using the gravimetric method under the same temperature and pressure conditions [21]. Thus, factors such as equipment (manometric, volumetric, and gravimetric), sample size, and apparatus dimensions do not explain the major difference between our experimental data and these literature data reported by aforementioned researchers.
From the above information and our experimental data, it is suggested that the two sandstone samples may have higher density of the sorbed CO2 phase than do coal, shale, and limestone, but the reason for this is unclear and requires further investigation.
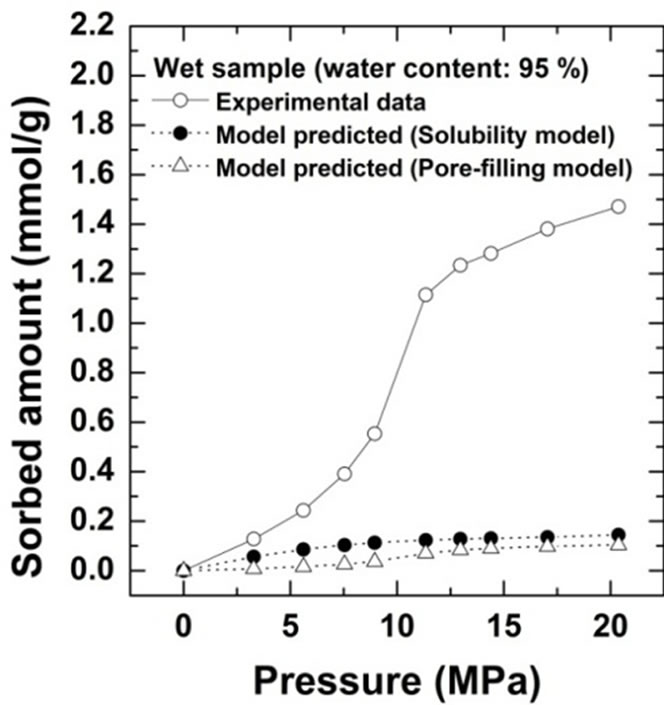
Comparison of the sorption amount obtained from this study with the two theoretical values based on the solubility and pore-filling models calculated from Equations (2) and (3) are shown for Kimachi sandstone, which has approximately 95% water content, in Figure 4(a) and for Berea sandstone, which has approximately 99% water content, in Figure 4(b).
 (a)
(a)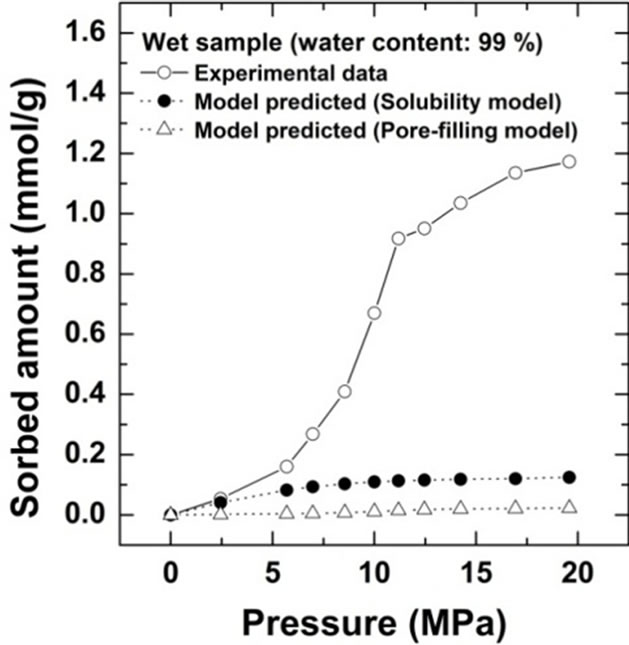 (b)
(b)
Figure 4. Comparison of CO2 excess sorption data on the wet samples for Kimachi sandstone and Berea sandstone with theoretical values calculated from the solubility and pore-filling models.
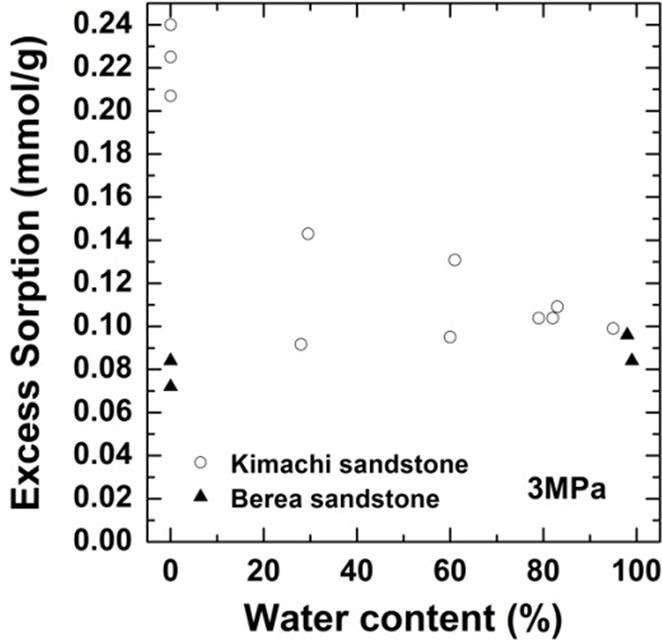
As shown in Figure 4, the wet samples have significantly larger sorption capacity than the two theoretical values in the given pressure region. It should be noted that CO2 sorption might have an impact on the dissolution and pore-filling effects in CO2 storage processes and contribute significantly to the storage capacity in a rock mass. The CO2 sorption amounts for both the sandstone types have been plotted as functions of the water content at 3 MPa in Figure 5(a) and at 18 MPa in Figure 5(b). At the lower pressure of 3 MPa, the sorbed amount of Kimachi sandstone decreased rapidly with increasing water content and reached approximately 0.2 mmol/g when the water content exceeded 40% and 50%, whereas for Berea sandstone, there was no significant change in the sorbed amount with the water content. The aforementioned difference may be attributed to several factors (mineral component, pore distribution, and pore structure), but detailed analysis is still underway. In contrast, at the higher pressure of 18 MPa, the sorbed amount for both types of sandstone showed a more or less increasing trend with an increase in the water content.
As can be seen in Figure 5, the experimental data for both the sandstones varied widely for each water content. The results of our study demonstrate that drying with appropriate control of the water content plays a major role and that the sorbed amount reflects unevenly distributed
 (a)
(a)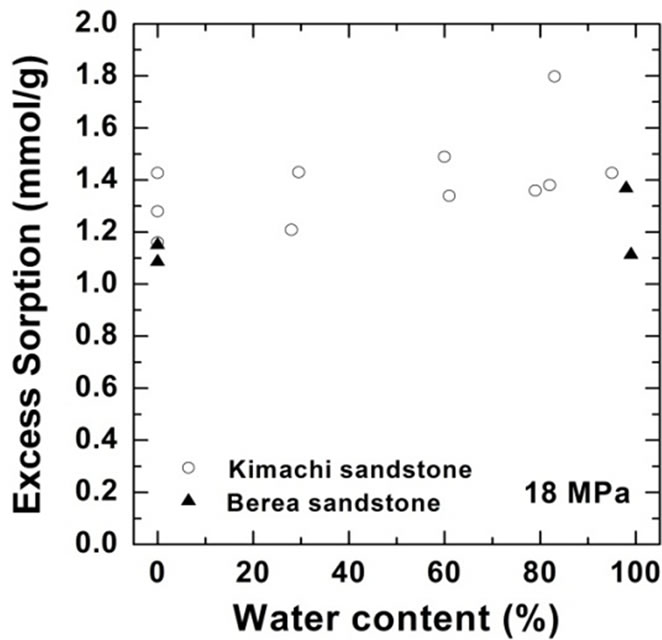 (b)
(b)
Figure 5.Variations in CO2 sorption amount as a function of water content for Kimachi sandstone and Berea sandstone (a) at 3 MPa; (b) at 18 MPa.
pore water as well as variations in the properties of each type of rock. These observations indicate a certain degree of correlation between the sorbed amount and the water content, except for lower sorption amounts in the case of Berea sandstone. However, a greater number of data points would be needed to define the dependence of the sorption capacity on the water content.
Therefore, it can be said with reasonable certainty that in the supercritical region, the wet samples obtained from both Kimachi sandstone and Berea sandstone has significantly higher CO2 sorption capacity than do the dry samples. Nevertheless, the greatest variation in the sorption amount could be observed at around 80% water content for Kimachi sandstone (0.4 mmol/g) and 100% water content for Berea sandstone (0.5 mmol/g).
A molecular dynamics (MD) simulation study on the interaction potentials between scCO2/hydroxylated silica and scCO2/silylated silica was conducted by Qin et al. [27]. They reported that the hydroxylated silica surface confines scCO2 more strongly than does the silylated silica surface. Thus, it was suggested that in the rock samples tested in this study, the hydroxyl groups on the silica and silicate surfaces play an essential role in attracting and sorbing CO2 molecules during the sorption process.
As mentioned earlier in this section, at higher pressures of above 12 MPa, the observed comparable and deviation trends (shown in Figure 3) can be due to a specific CO2/water/minerals (quartz, feldspars, etc.) interacttions in pores of rock. To better understand the interacttion of CO2 with silica, Tripp and Combes [28] proved using infrared spectroscopy onto deuterated silica surface before and after exposing to scCO2. They found that the intensity of the peak due to water adsorption on the surface hydroxyl groups reduced in the presence of scCO2, and then, a weak band appeared, which was due to sorption of CO2 on the hydroxyl groups. This indicated that scCO2 fluid extracts the adsorbed water from the silica surface, resulting in additional isolated hydroxyl groups associated with the sorption sites of CO2 through the extraction process.
In most recent studies [29-31], contact angle measurements have been conducted on CO2-water or brinesolid substrates (hydrophilic glass, quartz, mica, and calcite) in the gaseous CO2, liquid CO2, and scCO2 states. The results demonstrated that for all the materials, the CO2/water/solid contact angle increases slightly as the CO2 pressure increases in the gaseous CO2 phase and there is a sudden dip in the contact angle in the liquid CO2 and scCO2 phases. Thus, it was concluded that this difference may cause partial wetting of CO2, indicative of an improvement in the CO2 displacement efficiency during CO2 migration.
Furthermore, to provide a deeper insight into the phase distribution and mobilization on the micropore scale, pore scale wettability studies were conducted by Chalbaud et al. [32] using a glass micromodel of different hydrophilicities. They stated that a thin film of water is formed on the glass beads (solid substrate) in the gaseous CO2 phase, but since the external phase (CO2) becomes liquid or supercritical CO2, a greater part of such films was not clearly visible. In addition, this observation seemed to support the displacement of adsorbed water by the CO2 fluid during the extraction process reported by Tripp and Combes [28]. Therefore, even if migration of CO2 occurs on the micropore scale, CO2 partial wetting may occur in the pores of the rocks at geological pressures and temperatures.
In light of the abovementioned studies, significant changes in the sorption isotherms at different water content may be attributed to the partial wettability of CO2 in the pores of rocks during the extraction process. However, no obvious trend could explain the divergence of the isotherm data on water-saturated basis from that on the air-dry basis at pressures above 12 MPa. More data pertaining to the mechanism of CO2 sorption on silica and silicate minerals are needed for a better understanding of the findings of this study. Further investigation of sorption mechanisms is now underway.
4. Conclusions
In order to examine the impact of the water content on CO2 sorption in the pores of rocks, CO2 sorption measurements for Kimachi sandstone and Berea sandstone were performed at 50˚C and pressures of up to 20 MPa for different water content using the manometric method.
All the rock samples showed CO2 sorption in their internal structures on both air-dry and water-saturated bases. At pressures above 12 MPa, the wet samples of Kimachi sandstone and Berea sandstone showed CO2 sorption amounts comparable to or higher compared than those of the dry samples; this trend was in contrast to the lower CO2 sorption isotherm data for Kimachi sandstone. These observations also indicated that the sorption amount is somewhat correlated with the water content, except in the low-pressure region for Berea sandstone.
Furthermore, predictions based on solubility and porefilling models suggested that CO2 sorption may have a significant impact on the CO2 geological storage mechanisms, in addition to dissolution and pore-filling effects.
The present study indicates that CO2 sorption is possible even when the storage reservoir is filled with water. Further, the mechanism of sorption on silica and silicate minerals might play an important role in the reliable and accurate estimation of the CO2 storage capacity of deep saline aquifers and in the precise prediction of the movement of CO2 in host reservoir rocks and seal rocks.
REFERENCES
- R. A. Chadwick, S. Holloway, S. Brook and G. A. Kirby, “Geological Storage of Carbon Dioxide,” In: S. J. Baines and R. H. Worden, Eds., The Case for Underground CO2 Sequestration in Northern Europe, Geological Society, Special Publications, London, 2004, pp. 17-28.
- S. Bachu, “CO2 Storage in Geological Media: Role, Means, Status and Barriers to Deployment,” Progress in Energy and Combustion Science, Vol. 34, No. 2, 2008, pp. 254-273. doi:10.1016/j.pecs.2007.10.001
- F. M. Orr Jr., “Onshore Geologic Storage of CO2,” Science, Vol. 325, No. 5948, 2009, pp. 1656-1658. doi:10.1126/science.1175677
- IPCC-Intergovernmental Panel on Climate Change, “Underground Geological Storage (Chapter 5), Special Report on Carbon Dioxide Capture and Storage,” In: B. Metz, O. Davidson, H. C. de Coninck, M. Loos and L. A. Mayer, Eds., Geographical Distribution and Storage Capacity Estimates, Cambridge University Press, Cambridge, 2005, pp. 220-224.
- J. Bradshaw, S. Bachu, D. Bonijoly, R. Burruss, S. Holloway, N. P. Christensen and O. M. Mathiassen, “CO2 Storage Capacity Estimation: Issues and Development of Standards,” International Journal of Greenhouse Gas Control, Vol. 1, No. 1, 2007, pp. 62-68. doi:10.1016/S1750-5836(07)00027-8
- S. Bachu, D. Bonijoly, J. Bradshaw, R. Burruss, S. Holloway, N. P. Christensen and O. M. Mathiassen, “CO2 Storage Capacity Estimation: Methodology and Gaps,” International Journal of Greenhouse Gas Control, Vol. 1, No. 4, 2007, pp. 430-443. doi:10.1016/S1750-5836(07)00086-2
- A. Kopp, H. Class and R. Helming, “Investigations on CO2 Storage Capacity in Saline Aquifers-Part 2: Estimation of Storage Capacity Coefficients,” International Journal of Greenhouse Gas Control, Vol. 3, No. 3, 2009, pp. 263-276. doi:10.1016/j.ijggc.2008.10.002
- M. Szulczewski and R. Juanes, “A Simple but Rigorous Model for Calculating CO2 Storage Capacity in Deep Saline Aquifers at the Basin Scale,” Energy Procedia, Vol. 1, No. 1, 2009, pp. 3307-3314. doi:10.1016/j.egypro.2009.02.117
- J. W. Johnson, J. J. Nitao and K. G. Knauss, “Geological Storage of Carbon Dioxide,” In: S. J. Baines and R. H. Worden, Eds., Geological Society, Special Publications, London, 2004, pp. 107-128.
- R. van der Straaten, “Calulating the CO2 Storage Capacity (Chapter 4.2), The Underground Disposal of Carbon Dioxide,” In: S. Holloway, Ed., Final Report of Joule II Project, Non-Nuclear Energy, 1996, pp. 19-21.
- H. Lin, T. Fujii, R. Takisawa, T. Takahashi and T. Hashida, “Experimental Evaluation of Interactions in Supercritical CO2/Water/Rock Minerals System under Geologic CO2 Sequestration Conditions,” Journal of Materials Science, Vol. 43, No. 7, 2008, pp. 2307-2315. doi:10.1007/s10853-007-2029-4
- A. Busch, S. Alles, Y. Gensterblum, D. Prinz, D. N. Dewhurst, M. D. Raven, H. Stanjek and B. M. Krooss, “Carbon Dioxide Storage Potential of Shales,” International Journal of Greenhouse Gas Control, Vol. 2, No. 3, 2008, pp. 297-308. doi:10.1016/j.ijggc.2008.03.003
- J. Wollenweber, S. Alles, A. Busch, B. M. Krooss, H. Stanjek and R. Littke, “Experimental Investigation of the CO2 Sealing Efficiency of Caprocks,” International Journal of Greenhouse Gas Control, Vol. 4, No. 2, 2010, pp. 231-241. doi:10.1016/j.ijggc.2010.01.003
- T. Fujii, S. Nakagawa, Y. Sato, H. Inomata and T. Hashida, “Sorption Characteristics of CO2 on Rocks and Minerals in Storing CO2 Processes,” Natural Resources, Vol. 1, No. 1, 2010, pp. 1-10.
- ASTM C 20-80a, “Standard Test Methods for Apparent and Bulk Density of Burned Refractory Brick and Shapes by Boling Water,” Annual Book of ASTM Standards, 1981.
- L. Liu, Y. Suto, G. Bignall, N. Yamasaki and T. Hashida, “CO2 Injection to Granite and Sandstone in Experimental Rock/Hot Water Systems,” Energy Conversion and Management, Vol. 44, No. 9, 2003, pp. 1399-1410. doi:10.1016/S0196-8904(02)00160-7
- Z. J. Wang and A. M. Nur, “Effects of CO2 Flooding on Wave Velocities in Rocks with Hydrocarbons,” SPE Reservoir Engineering, Vol. 4, No. 4, 1989, pp. 429-436. doi:10.2118/17345-PA
- A. Busch and Y. Gensterblum, “CBM and CO2-ECBM Related Sorption Processes in Coal: A Review,” International Journal of Coal Geology, Vol. 87, No. 2, 2011, pp. 49-71. doi:10.1016/j.coal.2011.04.011
- R. Span and W. Wagner, “A New Equation of State for Carbon Dioxide Covering the Fluid Region from the Triple-Point Temperature to 1100 K at Pressures up to 800 MPa,” Journal of Physical and Chemical Reference Data, Vol. 25, No. 6, 1996, pp. 1509-1596. doi:10.1063/1.555991
- R. Wiebe and V. L. Gaddy, “The Solubility in Water of Carbon Dioxide at 50, 75 and 100˚, at Pressures to 700 Atmospheres,” Journal of the American Chemical Society, Vol. 61, No. 2, 1939, pp. 315-318. doi:10.1021/ja01871a025
- T. Fujii, H. Lin, Y. Sato, Y. Sugai, K. Sasaki, H. Inomata and T. Hashida, “Sorption Behavior of CO2 on Rocks and Minerals in CO2 Rich Dense Phase,” Journal of MMIJ, Vol. 126, No. 3, 2010, pp. 84-94. doi:10.2473/journalofmmij.126.84
- B. M. Krooss, F. van Bergen, Y. Gensterblum, N. Siemons, H. J. M. Pagnier and P. David, “High-Pressure Methane and Carbon Dioxide Adsorption on Dry and MoistureEquilibrated Pennsylvanian Coals,” International Journal of Coal Geology, Vol. 51, No. 2, 2002, pp. 69-92. doi:10.1016/S0166-5162(02)00078-2
- N. Siemons and A. Busch, “Measurement and Interpretation of Supercritical CO2 Sorption on Various Coals,” International Journal of Coal Geology, Vol. 69, No. 4, 2007, pp. 229-242. doi:10.1016/j.coal.2006.06.004
- A. L. Goodman, A. Busch, R. M. Bustin, L. Chikatamarla, S. Day, G. J. Duffy, J. E. Fitzgerald, K. A. M. Gasem, Y. Gensterblum, C. Hartman, C. Jing, B. M. Krooss, S. Mohammed, T. Pratt, R. L. Robinson Jr., V. Romanov, R. Sakurovs, K. Schroeder and C. M. White, “Inter-Laboratory Comparison II: CO2 Isotherms Measured on MoistureEquilibrated Argonne Premium Coals at 55˚C and up to 15 MPa,” International Journal of Coal Geology, Vol. 72, No. 3-4, 2007, pp. 153-164. doi:10.1016/j.coal.2007.01.005
- J. E. Fitzgerald, Z. Pan, M. Sudibandriyo, R. L. Robinson Jr., K. A. M. Gasem and S. Reeves, “Adsorption of Methane, Nitrogen, Carbon Dioxide and Their Mixtures on Wet Tiffany Coal,” Fuel, Vol. 84, No. 18, 2005, pp. 2351-2363. doi:10.1016/j.fuel.2005.05.002
- R. Humayun and D. L. Tomasko, “High-Resolution Adsorption Isotherms of Supercritical Carbon Dioxide on Activated Carbon,” AICHE Journal, Vol. 46, No. 10, 2000, pp. 2065-2075. doi:10.1002/aic.690461017
- Y. Qin, X. N. Yang, Y. F. Zhu and J. L. Ping, “Molecular Dynamics Simulation of Interaction between Supercritical CO2 Fluid and Modified Silica Surface,” Journal of Physical and Chemical C, Vol. 112, No. 33, 2008, pp. 12815-12824. doi:10.1021/jp711964e
- C. P. Tripp and J. R. Combes, “Chemical Modification of Metal Oxide Surfaces in Supercritical CO2: The Interaction of Supercritical CO2 with the Adsorbed Water Layer and the Surface Hydroxyl Groups of a Silica Surface,” Langmuir, Vol. 14, No. 26, 1998, pp. 7348-7352. doi:10.1021/la9805701
- J. L. Dickson, G. Gupta, T. S. Horozov, B. P. Binks and K. P. Johnson, “Wetting Phenomenon at the CO2/Water/Glass Interface,” Langmuir, Vol. 22, No. 5, 2006, pp. 2161-2170. doi:10.1021/la0527238
- P. Chiquet, D. Broseta and S. Thibeau, “Wettability Alteration of Caprock Minerals by Carbon Dioxide,” Geofluids, Vol. 7, No. 2, 2007, pp. 112-122. doi:10.1111/j.1468-8123.2007.00168.x
- P. K. Bikkina, “Contact Angle Measurements of CO2-Water- Quartz/Calcite Systems in the Perspective of Carbon Sequestration,” International Journal of Greenhouse Gas Control, Vol. 5, No. 5, 2011, pp. 1259-1271. doi:10.1016/j.ijggc.2011.07.001
- C. Chalbaud, M. Robin, J.-M. Lombard, F. Martin, P. Egermann and H. Bertin, “Interfacial Tension Measurements and Wettability Evaluation for Geological CO2 Storage,” Advances in Water Resources, Vol. 32, No. 1, 2009, pp. 98-109. doi:10.1016/j.advwatres.2008.10.012