Modern Mechanical Engineering
Vol.06 No.01(2016), Article ID:63651,12 pages
10.4236/mme.2016.61004
Response Surface Methodology Approach for Transmission Optimization of V-Belt Drive
Nurudeen A. Raji1, Andrew A. Erameh2, Abiodun A. Yussouff3, Rasheed O. Durojaye4
1Department of Mechanical Engineering, Lagos State University, Lagos, Nigeria
2Department of Mechanical Engineering, Igbinedion University, Okada, Nigeria
3Department of Computer Engineering, Grace Polytechnic, Omu, Nigeria
4Department of Structure and Aerodynamic, National Space Research and Development Agency, Lagos, Nigeria

Copyright © 2016 by authors and Scientific Research Publishing Inc.
This work is licensed under the Creative Commons Attribution International License (CC BY).
http://creativecommons.org/licenses/by/4.0/


Received 5 December 2015; accepted 20 February 2016; published 23 February 2016
ABSTRACT
The aim of this study was to develop an efficient and realistic response surface optimization technique for the design of V-belt drive for optimum power output of the drive in machinery design. Optimization mathematical model of the V-belt drive was constructed. The power output of the belt drive was modeled and optimized by the Response Surface Methodology (RSM). Analysis of variance was used to evaluate the extent of influence of each independent variables on the power output response of the belt drive. A RSM optimization process was proposed to calculate optimal power output for V-belt drive given a set of pulley diameter for the drive employed in a tilling machine. The analysis showed that optimum power output of the drive for workshop light operation machinery could be obtained at driving and driven pulley radius range of 550 - 900 mm and 250 - 500 mm. An optimum power output of 1418.76 kW was obtained at driving and driven pulley radius of 846 and 486 mm respectively for a farm tilling machine.
Keywords:
Pulley, V-Belt, Radius, Power Output, RSM, Optimization

1. Introduction
The V-belt drive system is usually designed for specific function and operating conditions in machinery [1] . It is used for the transmission of power in many engineering applications from a driver pulley to the driven pulley through friction between the belt and the pulleys. The belt drive has been successfully used as drive mechanism in fans and blowers, automotive engines, pump equipment, industrial machines [2] - [4] and agricultural equipment [5] among other applications. The drive is frequently used because of its ability to absorb shock, and its ease of installation [6] [7] . The V-belt drive consists a V-belt mounted on two grooved pulleys kept at distance apart. The pulley groove angle is made smaller than the belt section angle so the belt can wedge itself into the groove thus increasing friction. The side compression of the pulley walls yields elastic penetration into the groove resulting into radial components of the friction forces [8] - [10] . The groove angle depends upon the belt section, pulley radius, and the angle of contact of the belt and pulley. In view of this, optimum groove angle is required for the system in order to avoid excessive belt pull on the pulley-shaft elements which can result in unwanted vibration.
The wedging of the V-belt in the pulley groove increases the force of friction between the belt and pulley. The wedging action and the transmitted torque increase with reducing groove angle. The groove angle for V-belt is usually between 300 - 400. During the operation of the belt drive, the belt is carried forward by the driving pulley via the interfacial friction between the belt and the driving pulley, the belt then carries the driven pulley forward via the interfacial friction between the belt and the driven pulley [11] . The power requirement of the drive, the speed of the driving and the driven pulleys, the pulleys radius, and the pulley center distance are important design consideration for the V-belt drive. It is evident that the friction between the belt and pulleys is responsible for the power transmission and effective power transmission will depend upon the friction developed between the belt and the pulley contact surface [12] . The mechanics between belt and pulley in their contact zone has been well studied [13] [14] and considerable experimental studies have been done on the contact between the pulley groove and the V-belt as discussed in [15] [16] . The Coulomb friction law has been successfully used to model the contact forces [17] - [20] . Nishizawa [21] proposed a friction expression model for V-belt drive. The model is able to predict the power transmission output for the belt by incorporating the macro influence of the belt slip during operation. The state of power transmission for the belt with the influence of the macro slip limit is clarified and a new macro slip limit is obtained for the belt operation.
The belts are usually tightened to ensure friction between the belt and the pulleys. However, the installation tension should not be more than necessary to transmit the rated torque otherwise excessive bearing loads and shaft stresses may occur [22] . The pre-tensioning of the V-belt drive is based upon the total tightening force required to transmit the power. In automobile industry, the belt tensions are required to be as small as possible to reduce belt fatigue and prolong bearing life. However the small tension could results in power loss and belt slip which is not acceptable. The belt-pulley function model and the belt interaction with the pulley groove have been identified as a major source of error in the use of such belt drive for power transmission [13] . Therefore an understanding of the belt-pulley interaction for optimum contact phenomena cannot be overemphasized.
In machine design optimization process for machine parameters are usually carefully evaluated to determine output performance characteristics for each design candidate [23] [24] . Such optimization approach has been successfully used in engineering components design and related activities [25] [26] . Some optimization technique using response surface methodology (RSM) had been attempted for mechanical systems, [25] combined the RSM and the Hybrid Mean Value method for reliability based design optimization which tends to eliminate the effect of uncertain that may arise from design variables which may cause large variation in the performance parameter of the mechanism. The RSM often used for computational efficiency had also been applied in solving reliability based design optimization (RBDO) problems. [26] used the method to estimate the effect of the response surface error on engineering systems whose variance in input variables causes subsequent variances in the product output performance of the system. Belt drives allow achieving optimum design solutions for power transmission in industrial machines. Model for searching optimal parameter for undamped multi-ribbed belt drive system used in passenger vehicles was developed in [27] . The model incorporate sensitivity of the frequency and steady state harmonic responses of the system. The model was able to optimize the belt drive performance especially in reducing the influence of vibration during operation. Nonlinear model for maximizing the fatigue life in the design of V-belt had been developed [28] , the model present an effective algorithm and its efficiency involving mechanical design problems. The relative sliding of the belt with respect to the pulley resulting in belt drive speed loss was investigated in [29] . The relation between the belt-drive parameters and the speed loss was obtained using response surface methodology and the optimum operating conditions were determined using the design optimization procedure. The prediction of the RSM was found to be in good agreement with the empirical results often encountered in literatures.
The present study tends to use the RSM approach for the optimization of the output power transmission of a V-belt drive considering the various constraint associated with the effective performance of the drive.
2. Problem Formulation
The parameter of the V-belt drive include the length of the belt, the belt speed, the size of the pulleys, the pulleys center distance, the belt tensions, and the belt size. It is desired to choose a subset of these as design variables and formulates the objective function which will model the power transmission of the drive subject to the appropriate constraint which depend upon the performance and geometry of the drive.
2.1. Design Variables
The design variables are chosen to define the geometry of the belt drive. This includes the radii of the driving and the driven pulley, and the pitch length of the V-belt. Figure 1 provides a schematic drawing of the belt drive showing the variables employed.
2.2. Objective Function Formulation
The basic characteristics essential for the design of the belt drive transmission are the input and output power,  ,
,  and the rotational speed
 ,
, . The objective of this study is to maximize the power transmission of the drive. The input power to the belt from the driving pulley could be written as;
 (1)
(1)
And the output power received from the belt by the driven pulley could be written as;
 (2)
(2)
where  is the torque that pulley-A delivers on the belt and
  is the torque that pulley-B received from the belt.
Belt drives depend for their operation on friction between the belt and the pulleys. The relation between the belt friction coefficient m and the transmission torque t could be obtained for the driving and driven pulleys respectively as follows;
 and
and  (3)
(3)

Figure 1. Scematic drawing of belt drive.
To develop adequate traction, the belt must be given a certain amount of pretension, . As the torques are transmitted by the system a tension difference
  between the tight and slack sides will occur and induce friction on the contact surfaces between the V-belt and the pulleys. The frictional contact behavior on the frictional surfaces and the tension existing in the V-belt is well discussed in [6] . The changing in the belt tension causes changes in strain in the elastic belt which make the belt move relative to the rotating pulleys [7] . A speed differential known as creep is then developed between the belt and the pulley causing the belt span at the tight side to travel slightly faster than the belt span at the slack side. This creep phenomenon may be expressed as a ratio of the speeds [30] ,
 (4)
(4)
where the slippage factor ε lies between the values 0.005 to 0.03. Denoting an assumed constant belt speed by vb, the output power by the belt can be obtained as expressed;
 (5)
(5)
The tensions  and
and  transmitting the power is defined by considering the influence of the centrifugal force on the belt system in operation as follows [31] ;
 and
and  (6)
(6)
where  and
and  are the tensions on the tight side and slack side of the belt respectively.
  is the centrifugal force. The maximum torque that can be transmitted between the belt and the pulley occurs when limiting friction is developed around the arc of contact. The forces acting on a short length of the belt which subtends an angle ofdqat the centre of the pulley are shown in Figure 2. Consequently the maximum possible ratio of tensions between the “tight” and “slack” sides of the belt for a drive between pulleys of unequal radius was determined as [32] ;
 (7)
(7)
b is the V-half angle of groove in degree. The power output for the drive is obtained as expressed in Equation (8).
An accurate running tension can be achieve for the drive by setting an initial installation tension to which
 (8)
(8)
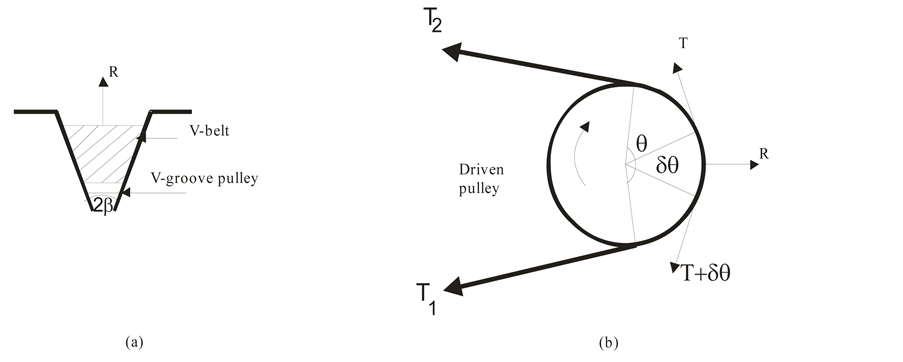
Figure 2. Ratio of driving tension for V-belt. (a) V-groove belt-pulley contact of friction force (mR/sinb). (b) Driving Tensions.
usually depends upon the belt length, belt elasticity, pulley geometry, and the center to center distance of the pulleys. Assuming that the length of the belt is constant and the belt elasticity is linear, the following equation applies [10] ;
 (9)
(9)
The effect of the initial tension as determined in Equation (9) could be obtain with the re-expression of the power output Equation (8) as obtained in Equation (10).
 (10)
(10)
where R is the design vector of the system taken as follows:
 (11)
(11)
Assuming that m, b, and  are constants, then the parameters T0 and
  provides the measure of the power transmitted and are used as the basis for the objective function in the problem formulation.
2.3. Formulation of the Constraints
In the constraint set, a condition for maximum power transmission could be obtained by the limitation on the initial tension in the belt expressed as [33] ;
 (12)
(12)
A geometrical relation could be captured with coordinate system as defined in Figure 2 and the following geometrical relations are obtained for the angle of lap on the driven pulley;
 (13)
(13)
 (14)
(14)
where  and
and  are the radii measured from the pulley center to the centroidal axis of the V-belt. C is the center-to-center distance of the drive system.
The calculations involving the belt length are usually based on the pitch length,  of the drive. For any given belt section, the pitch length and center-to-center distance are obtained as [8] ;
 (15)
(15)
 (16)
(16)
The center-to-center distance of the V-belt drive is limited to the following inequalities to prevent excessive vibration of the slack side [9] ;
 and
and  (17)
(17)
The constraint on the ratio of tension could be obtained from Equations (7), (13) and (14) as follows:
 (18)
(18)
Combining Equations (14) and (17) the constraint on the center-to-center distance can be obtained as:
 (19)
(19)
and
 (20)
(20)
The optimization problem could therefore be stated as follows:
Maximize 
Subject to 


2.4. Optimization
The above system of the objective function equation and the constraints are nonlinear functions of the design variables. Response surface methodology was used for the optimization of the power output. FORTRAN 90 code was developed to simulate the objective function subject to the constraints as shown in flowchart Figure 3. The actual values from the FORTRAN 90 code simulation for the model Equations (10)-(20) were used directly for the RSM experiment design. The behavior of the power output, P, obtained in the simulation data were modeled as functions of the driving pulley radius, RA, and driven pulley radius, RB using the Response Surface Methodology (RSM). The response surface methodology was obtained from the design expert software version 7.0.0.
Response surface methodology usually aim at determining the optimum settings for the variables and to see how the variables perform over the whole experimental domain, including any interactions such as the simultaneous influence of the deriving and driven pulley parameters on the power output of the V-belt drive system. The driving pulley and driven pulley radius were taking as two independent variables which determine the response of the power output P of the belt drive. The experimental design and statistical analysis were performed according to the response surface analysis method using Design Expert 7.0.0 software. Historical data obtained from the FORTRAN simulation was employed to study the combined effect of the pulley radii RA and RB. The dependent variable (P) measured is the power output of the belt drive system.
A cubic order three dimensional surface model was obtained to describe the relationship between the power output and the pulley radii. The model was able to account for the curvature of the response and the interaction of the independent variables in the response surface. The data point (P, RA, RB) defines a curved surface in 3D space represented by the following polynomial [33] .
 (21)
(21)
The parameters  are constant coefficients known as the regression coefficients. These coefficients measure the expected change in the response P per unit increase in Ra when the Rb is held constant and vice versa and is established by regression analysis in the RSM programme.
  is the main effect,
  and
and  are the curvature,
  is the interaction and e is the error. All the coefficients were obtained by the use of the Design Expert software package. The goodness of fit for each property model was confirmed by the R2 values and the probability obtained from the analysis of variance (ANOVA). The optimum values of the power output was obtained from the numerical analysis of the RSM package.
3. Results and Discussion
3.1. Simulation
The simulation results as obtained from the FORTRAN 90 code is shown in Table 1.

Figure 3. Flow of optimal power output for V-belt drive.
Table 1 shows the dependency of the power output on the Pulley radii for the combined influence of the pulley radii the power output of the V-belt drive. The data in the table was populated in the RSM actual-design value frame for the 100 observations obtained. The RSM capable of developing model fits for the data was used to develop the model describing the relationship of the power output on the combined influence of the driving and driven pulley radii. Table 2 shows the result of the model fit for the data as analyzed using the RSM.

Table 1. Actual data as obtained from FORTRAN 90 code simulation for the V-belt drive.
Table 2. Model summary statistics for power output of V-belt drive.
The results suggest cubic order polynomials for the description of the power output relationship with the pulley radii. This was obtained by focusing on the model that maximizes the adjusted and predicted R-square values for the system. The cubic order model compared to the other models has the lowest standard deviation, higher R2 values and low predicted residual sum (PRESS) of squares for the drive indicating that the cubic model is the most suitable for describing the power output of the system.
3.2. Analysis of Variance
The Analysis of Variance (ANOVA) for the response surface cubic model of the power output is as shown in Table 3 with estimated values of the regression coefficients. The ANOVA is employed in order to determine which of the pulley parameter is significant in describing the behavior of the power output. The R2 values were obtained from the F-test. The significant parameters are as shown in Table 3. Parameters with P-values less than 0.05 are significant to the description of the power output.
The F-values for the model with p-values <0.0001 implied that such model is significant. This means that there is only 0.01% chance that the model F-values as large as obtained could occur due to noise.
The model terms with p-values less than 0.05 are considered to be significant and influence the power output considerably. The smaller values of the p-values suggest that there is curvature in the response surfaces. This is in line with rejecting the hypothesis that a particular regression coefficient does not influence the power output. The driven pulley main effect B, the curvature term B2 and the driving pulley main effect term A has the most significant influence on the power output of the drive with F-value of 31.46, 25.70 and 23.96 respectively. This is followed by the curvature term B3 of the driven pulley and interaction term AB with F-value of 19.08 and 8.46.
The normal probability of the power output is shown in Figure 4.
Table 3. ANOVA for power output of V-belt drive.

Figure 4. Normal plot of residuals for the Poer out of the V-belt drive.
It was observed that the residuals tend to aligned with the normal distribution assumptions as defined by the straight lines. This implies that the errors are normally distributed. Predicted values from the model could therefore be considered useful for information extraction for the belt drive.
3.3. Power Output
The surface response and the contour plots of the power output are as shown in Figure 5 and Figure 6.

Figure 5. Surface plot for power output.

Figure 6. Contour plot for power output.
The plots show the combined influence of the pulley radii on the power output of the V-belt drive. The contour plots of the power output of the drive shows increasing power output with increasing driving pulley radius and reducing driven pulley radius. The power output however reduces as the driving pulley radius increases above 550 mm for small driven pulley radius. This phenomenon places limit on the pulleys parameter. Improved power output could therefore be obtained from driven pulley radius of 225 mm. Also the power output is limited to a maximum driving pulley radius of about 900 mm beyond which the power output of the drive reduces. The contour range of optimized power output could therefore be obtained at driven pulley radius range of 250 - 500 mm and driving pulley radius range of 550 - 900 mm. the limitation could be explained as due to the design constraint of the minimum range pulley belt-pulley lap angle which should be less than 180 degrees as obtained in theoretical models.
The power output region for optimized value is exposed on the contour plot of Figure 6. It is cleared from the plot that the optimum power output could be obtained at 550 < Ra < 900 mm and 250 < Rb < 500. The predicted optimum power output is 1418.76 kW at driving and driven pulley radius of 846 and 486 mm respectively. The standard pulley radius for the belt drive operation could be selected within these limits for optimum power output delivery for such drive.
4. Conclusion
In this paper, we proposed a formulation for optimizing the V-belt drive design in machinery. The formulation attempted to optimize the power output from the drive. Constraints on the pulley sizes, belt pitch length, pulley center-to-center distance, and tension ratio were also proposed. The resulting optimal design showed that the driven pulley size had substantial influence on the optimal power output of the drive compared to the driving pulley size. The curvature of the power output response was however explicitly described by the driving pulley parameter which was investigated for its sensitivity to the active constraints. The predicted optimum power output was 1418.76 kW at driving and driven pulley radius of 846 and 486 mm respectively. The standard pulley radius for the belt drive operation could be selected within these limits for optimum power output delivery for such drive. The proposed formulation provided a good starting point for the power transmission design using the V-belt drive for machinery. Additional development of the formulation could consider the number of belts and pulleys required for power transmission mostly in heavy duty industrial machinery.
Cite this paper
Nurudeen A. Raji,Andrew A. Erameh,Abiodun A. Yussouff,Rasheed O. Durojaye, (2016) Response Surface Methodology Approach for Transmission Optimization of V-Belt Drive. Modern Mechanical Engineering,06,32-43. doi: 10.4236/mme.2016.61004
References
- 1. Jombo, P.P. and Adetona, G.A. (2003) Computer-Aided Design of Belts and Pulley Systems. Nigerian Journal of EngineeringResearch and Development, 2, 1-11.
- 2. Raji, N.A. (2005) Design and Fabrication of Narrow Belt Sanding Machine for Small Scale Workshops. Nigerian Journal of Industrial and Systems Studies, 4, 52-57.
- 3. Raji, N.A. and Kuku, R.O. (2003) The Analysis and Design of an Embedded Foundation for a Single Cylinder Reciprocation Engine. International Journal of Engineering and Engineering Technology, 3, 24-32.
- 4. Raji, N.A. and Ogunleye, R.O. (2008) Design and Construction of Tilling Machine for Small Scale Farming. Nigerian Society of Engineers Technical Transactions, 43, 14-26.
- 5. Ojolo, S.A., Orisaleye, J.I., Adelaja, A.O. and Kilanko, O. (2011) Design and Development of Waste Sorting Machine. Journal of Emerging Trends in Engineering and Applied Sciences, 2, 576-580.
- 6. Cepon, G. and Boltezar, M. (2009) Dynamics of a Belt-Drive System Using a Linear Complementarily Problem for the Belt-Pulley Contact Description. Journal of Sound and Vibration, 319, 1019-1035.
http://dx.doi.org/10.1016/j.jsv.2008.07.005 - 7. Cepon, G., Manin, L. and Boltezar, M. (2011) Validation of a Flexible Multibody Belt-Drive Model. Journal of Mechanical Engineering, 57, 539-546.
http://dx.doi.org/10.5545/sv-jme.2010.257 - 8. Sorge, F. (1996) A Qualitative-Quantitative Approach to V-Belt Mechanics. ASME Journal of Mechanical Design, 118, 15-21.
http://dx.doi.org/10.1115/1.2826850 - 9. Gerbert, G. (1999) Traction Belt Mechanics. Chalmers University of Technology, Göteborg.
- 10. Gerbert, G. and Sorge, F. (2002) Full Sliding “Adhesive-Like” Contact of V-Belts. ASME Journal of Mechanical Design, 124, 706-712.
http://dx.doi.org/10.1115/1.1514662 - 11. Sun, D.C. (1988) Performance Analysis of a Variable Speed-Ratio Metal V-Belt Drive. Journal of Mechanisms, Transmissions, and Automations in Design, 110, 472-481.
http://dx.doi.org/10.1115/1.3258947 - 12. Wei, Q.B., Chen, X. and Zheng, D.U. (2010) A Research of V-Belt Transmission Mechanics with Two Same Pulleys. Key Engineering Materials, 450, 357-360.
http://dx.doi.org/10.4028/www.scientific.net/KEM.450.357 - 13. Kong, L. and Parker, R.G. (2006) Mechanics and Sliding Friction in Belt Drives with Pulley Grooves. Journal of Mechanical Design, 128, 494-502.
http://dx.doi.org/10.1115/1.2168469 - 14. Zheng, D.Y., Guan, X.Y., Chen, X. and Zhang, L.Z. (2009) Study of Flat Belt Drive Mechanics. Key Engineering Materials, 419-420, 265-268.
http://dx.doi.org/10.4028/www.scientific.net/KEM.419-420.265 - 15. Gerbert, G. (1996) Belt Slip—A Unified Approach. Journal of Mechanical Design, 118, 432-438.
http://dx.doi.org/10.1115/1.2826904 - 16. Kátai, L. and Zabó, I. (2015) Identification of V-Belt Power Losses with Temperature Measurement. Journal of Mechanical Science and Technology, 29, 3195-3203.
http://dx.doi.org/10.1007/s12206-015-0719-4 - 17. Leamy, M.J. and Wasfy, T.M. (2002) Transient and Steady-State Dynamic Finite Element Modeling of Belt-Drives. Journal of Dynamic Systems, Measurement, and Control, 124, 575-581.
http://dx.doi.org/10.1115/1.1513793 - 18. Wasfy, T.M. and Leamy, M.J. (2002) Effect of Bending Stiffness on the Dynamic and Steady-State Responses of Belt-Drives. ASME 27th Biennial Mechanisms and Robotics Conference, Montreal, 29 September-2 October 2002, 217-224.
http://dx.doi.org/10.1115/detc2002/mech-34223 - 19. Kerkkanen, K.S., Vallejo, D.G. and Mikkola, A.M. (2006) Modeling of Belt-Drives Using a Large Deformation Finite Element Formulation. Nonlinear Dynamics, 43, 239-256.
http://dx.doi.org/10.1007/s11071-006-7749-5 - 20. Dufva, K., Kerkkanen, K.S., Maqueda, L.G. and Shabana, A.A. (2007) Nonlinear Dynamics of Three-Dimensional Belt Drives Using the Finite-Element Method. Nonlinear Dynamics, 48, 449-466.
http://dx.doi.org/10.1007/s11071-006-9098-9 - 21. Nishizawa, H.N., Yamaguchi, H. and Suzuki, H. (2005) Friction Characteristic Analysis for Damping Force Setup in Metal V-Belt Type CVTs. R&D Review of Toyota CRDC, 40, 14-20.
http://www.tytlabs.com/english/review/rev403epdf/e403_014nishizawa.pdf - 22. Kong, L. and Parker, R.G. (2005) Steady Mechanics of Belt-Pulley Systems. Journal of Applied Mechanics, 72, 25-34.
http://dx.doi.org/10.1115/1.1827251 - 23. Deihimi, A. (2009) Design Optimization of Switch Reluctance Machines for Maximum Torque/Current Using BEM-Based Sensitivity Analysis. International Journal of Recent Trends in Engineering, 2, 167-171.
http://ijrte.academypublisher.com/vol02/no05/ijrte0205167171.pdf - 24. Andrisano, A.O., Ansaloni, M., Leali, F., Pellicciari, M. and Vergnano, A. (2011) A Novel Method for Sensitivity Analysis and Characterization in Integrated Engineering Design. Proceedings of International Conference Innovative Methods in Product Design, Venice, 15-17 June 2011, 272-279.
http://www.improve2011.it/Full_Paper/87.pdf - 25. Youn, B.D. and Choi, K.K. (2004) A New Response Surface Methodology for Reliability-Based Design Optimization. Computers and Structures, 82, 241-256.
http://dx.doi.org/10.1016/j.compstruc.2003.09.002 - 26. Kim, C. and Choi, K.K. (2008) Reliability-Based Design Optimization Using Response Surface Method with Prediction Interval Estimation. Journal of Mechanical Design, 30, Article ID: 121401.
http://dx.doi.org/10.1115/1.2988476 - 27. Hou, Z.-C., Lao, Y.-X. and Lu, Q.-H. (2008) Sensitivity Analysis and Parameter Optimization for Vibration Reduction of Undamped Multi-Ribbed Belt Drive Systems. Journal of Sound and Vibration, 317, 591-607.
http://dx.doi.org/10.1016/j.jsv.2008.03.063 - 28. Wan, Z., Zhang, S. and Zhou, Y. (2013) Interval Solution for Nonlinear Programming of Maximizing the Fatigue Life of V-Belt under Polymorphic Uncertain Environment. Mathematical Problems in Engineering, 2013, Article ID: 712825.
http://dx.doi.org/10.1155/2013/712825 - 29. Balta, B., Sonmez, F.O. and Cengiz, A. (2015) Speed Losses in V-Belt Drives. Mechanisms and Machine Theory, 86, 1-14.
http://dx.doi.org/10.1016/j.mechmachtheory.2014.11.016 - 30. Chemilevsky, D., Lavrova, E. and Romanov, V. (1984) Mechanics for Engineers. MIR Publishers, Moscow, 616 p.
- 31. Sheieh, C.J. and Chen, W.H. (2002) Effect of Angular Speed on Behavior of a V-Belt Drive System. International Journal of Mechanical Sciences, 44, 1879-1892.
http://dx.doi.org/10.1016/S0020-7403(02)00136-4 - 32. Khurmi, R.S. and Gupta, J.K. (2005) A Textbook of Machine Design. Eurasia Publishing House (PVT) Ltd., New Delhi, 1250 p.
- 33. Jung, S.P., Park, T.W., Jun, K.J., Yoon, J.W., Lee, S.H. and Chung, W.S. (2009) A Study on the Optimization Method for a Multi-Body System Using the Response Surface Analysis. Journal of Mechanical Science and Technology, 23, 950-953.
http://dx.doi.org/10.1007/s12206-009-0319-2