Open Journal of Biophysics
Vol.4 No.2(2014), Article ID:45372,9 pages DOI:10.4236/ojbiphy.2014.42009
Accuracy of Protein Size Estimates Based on Light Scattering Measurements
Ken Takeuchi, Yoichi Nakatani, Osamu Hisatomi*
Department of Earth and Space Science, Graduate School of Science, Osaka University, Toyonaka, Japan
Email: *hisatomi@ess.sci.osaka-u.ac.jp
Copyright © 2014 by authors and Scientific Research Publishing Inc.
This work is licensed under the Creative Commons Attribution International License (CC BY).
http://creativecommons.org/licenses/by/4.0/


Received 31 March 2014; revised 16 April 2014; accepted 23 April 2014
Abstract
There are two types of light scattering measurements: static light scattering (SLS) and dynamic light scattering (DLS). The SLS method is used to estimate the molecular weight (MW) of particles by measuring the time-averaged intensity of light scattered by the particles, whereas the DLS method is used to estimate the diffusion coefficient of particles by observing the time-correlation of scattered light intensity. These techniques have recently been applied to the investigation of the aggregation, denaturation and folding, and complex formation of proteins in solution. However, the accuracy of protein size measurement by light scattering is poorly understood. In the present study, we carried out the size measurements of five globular proteins by SLS and DLS at a detection angle of 90˚ and compared these data to measurements made by size exclusion chromatography (SEC). The difference (%) between the MW estimated from each method and the MW calculated from the amino acid sequence (namely the calibration residual error) was regarded as an index of measurement accuracy. The averaged calibration residual errors were 5.2 and 4.7 for SEC and SLS measurements, respectively. For the DLS measurements, the extrapolation of the apparent hydrodynamic radii to a protein concentration of zero may effectively eliminate the interparticle and hydrodynamic interactions and significantly reduced the averaged calibration residual error to 4.8%. Our results suggested that the size of globular proteins can be estimated using light scattering measurements with an accuracy equivalent to that of SEC.
Keywords
Size Measurement; Light Scattering; Size Exclusion Chromatography

1. Introduction
To clarify the physical properties of biomolecules, it is necessary to measure their native sizes. Biochemical methods such as sodium dodecyl sulfate-polyacrylamide gel electrophoresis and size exclusion chromatography (SEC) are generally used for the characterization of proteins. However, these methods are necessarily performed under restrictive conditions of temperature, salt concentration and pH, which are not always representative of the proteins’ native environments. Biophysical techniques such as sedimentation equilibrium analytical ultracentrifugation and small angle X-ray scattering (SAXS) are therefore used to determine the molecular weight (MW) of proteins in their native state. However, these methods are complex with limited availability to most researchers. Sedimentation equilibrium analytical ultracentrifugation generally requires sophisticated and expensive equipment and takes several hours to measure the size of each protein [1] . The SAXS method requires operation in a controlled area as an intense X-ray beam is used, which may result in radiation damage of the samples.
Recently, a nondestructive technique has gained popularity for exploring the size of macromolecules in solution [2] . Light scattering estimates the size and shape of particles by measuring the intensity of scattered light. There are two types of light scattering measurements: static light scattering (SLS) and dynamic light scattering (DLS). The SLS method estimates the MW of molecules by measuring the time-averaged intensity of light scattered by the particles, whereas the DLS method estimates the diffusion coefficient of particles by observing the time-correlation of scattered light intensity. The major advantages of light scattering over other techniques include the short time required to obtain data and its relative simplicity and accessibility to most researchers [2] . Light scattering has therefore frequently been used to investigate the aggregation [3] [4] , denaturation and folding [5] [6] , and complex formation [7] -[9] of proteins in solution. However, the accuracy of protein size measurement using light scattering methods such as DLS has been poorly evaluated thus far.
For the DLS measurements, the apparent hydrodynamic radii (RH-app) of the proteins in solution were calculated as follows:
 (1)
(1)
where kB is the Boltzmann constant, T is absolute temperature, η is the viscosity coefficient and D is the diffusion coefficient of the protein. Since the intensity of scattered light is very low for small proteins, high protein concentrations are required to obtain the RH-app with a sufficiently high signal-to-noise ratio. The diffusion coefficient may also be influenced by the interparticle interaction and by the hydrodynamic interaction that arises because a moving molecule induces solvent flow and hence exerts viscous forces on diffusing protein molecules nearby [5] [10] . Therefore, for DLS measurements, the protein concentration of the sample needs to be considered in order to obtain precise protein sizes.
In the present study, we measured the sizes of globular proteins by SLS and DLS at a detection angle of 90˚ and compared the results to those obtained by SEC. The RH-app of five proteins estimated from DLS measurements increased linearly relative to their concentration, and the extrapolation of RH-app to a protein concentration of zero significantly increased the measurement accuracy. Our results suggest that the size of globular proteins in their physiological states can be estimated by light scattering methods with an accuracy equivalent to that obtained by SEC analysis.
2. Materials and Methods
2.1. Materials
We used five globular proteins: aprotinin (bovine lung; 6.5 kDa), ribonuclease A (bovine pancreas; 13.7 kDa), carbonic anhydrase (bovine erythrocytes; 29.0 kDa), ovalbumin (hen egg white; 43.0 kDa) and conalbumin (chicken egg white; 75.0 kDa) present in the Gel Filtration LMW Calibration Kit (GE Healthcare, Buckinghamshire, UK). All proteins were diluted with PBS buffer containing 300 mM NaCl and 50 mM phosphate (pH 7.2). The molecular extinction coefficient at 280 nm (ε280, M−1cm−1) of each protein was calculated with the following formula [11] :
 (2)
(2)
where NTrp, NTyr and Ns−s are the number of tryptophans, tyrosines and disulfide bonds, respectively, in each protein. Protein concentrations were determined from their absorbance at 280 nm with a UV-160 spectrophotometer (Shimadzu, Kyoto, JP), using an ε280 of 6335 for aprotinin, 9440 for ribonuclease A, 50,420 for carbonic anhydrase, 31,775 for ovalbumin and 88,165 for conalbumin.
2.2. SEC Measurements
SEC was performed using an AKTA Purifier column chromatography system with a Superdex G-75 30/10 column (GE Healthcare) in PBS buffer at room temperature (25˚C ± 1˚C). The concentrations and volumes of the applied samples were 22 ± 6 µM and 140 ± 13 µL, respectively. The flow rate was 0.5 mL/min. The partition coefficient (Kav) of each protein was calculated as , where VE is the peak elution volume of each protein, Vc is the column volume (24 mL), and V0 is the void volume (7.65 mL). The calibration line was obtained by the least squares method, and the differences between the MWaa calculated from the amino acid sequences and the MWSEC calibrated from Kav were used as indices of measurement accuracy.
2.3. SLS Measurements
SLS measurements of the globular protein solutions were carried out with a Zetasizer µV system (Malvern Instruments, Worcestershire, UK) and the data were analyzed according to the method described in the handling manual. The stock solutions of each protein were diluted with PBS buffer to 1.78 - 2.59 mg/mL (275 - 400 µM) for aprotinin, 1.35 - 2.73 mg/mL (100 - 300 µM) for ribonuclease A, 0.57 - 1.45 mg/mL (20 - 50 µM) for carbonic anhydrase, 0.43 - 1.1 mg/mL (10 - 25 µM) for ovalbumin and 0.37 - 0.94 mg/mL (5 - 12.5 µM) for conalbumin. 70 µL of the protein solutions were incubated at 20˚C for 30 min, centrifuged at 36,000 × g for 10 min at 20˚C to remove aggregates, and 50 µL of each resulting supernatant were transferred to a quartz sub-micro fluorimeter cuvette (Starna Scientific, London, UK). The cuvette was placed in the cell holder of the Zetasizer µV and SLS measurements were performed without any equilibration time. Light scattering was detected at 830 nm with a fixed detection angle of 90˚ and data were collected in automatic mode at 20˚C. The Rayleigh ratio (Rθ) was measured several times and the MWdeb was determined using the Zetasizer Software (Version 6.20; Malvern Instruments). The following mathematical relationship was observed between Rθ and MWdeb in the SLS data:
 (3)
(3)
where , n0 is the refractive index of the solvent, dn/dc is the refractive index increment, c is the solute concentration, NA is Avogadro’s number, λ0 is the wavelength of the laser, MWdeb is the molecular weight of particles obtained from Equation (3) and A2 is the second virial coefficient. Kc/Rθ was plotted against the concentration, using a solvent refractive index of 1.334 and a refractive increment of 0.186 mL/g at 20˚C [12] .
2.4. DLS Measurements
DLS of the globular protein solutions was measured with a Zetasizer μV system and the data were analyzed according to the method described in the handling manual. Proteins were diluted with PBS buffer (viscosity, η = 0.9236 × 10⁻³ Pa·s) to a concentration of 300 - 450 μM for aprotinin, 100 - 250 μM for ribonuclease A, 6 - 41 μM for carbonic anhydrase, 30 - 60 μM for ovalbumin and 2.1 - 6.2 μM for conalbumin. 70 μL aliquots of the protein solutions were incubated at 25˚C for 30 min and then centrifuged at 36,000 × g for 10 min at 25˚C to remove aggregates. 45 μL of each resulting supernatant were transferred to a quartz sub-micro fluorimeter cuvette, placed in the cell holder and subjected to DLS measurements without any equilibration time. Light scattering was detected at 830 nm with a fixed detection angle of 90˚ and data were collected in automatic mode at 25˚C using a solvent refractive index of 1.334. The z-average molecular sizes in terms of the RH-app in solution were determined using the Zetasizer Software (Version 6.20). DLS of each globular protein was measured several times. Standard deviations (SDs) of all RH-app values obtained from the measurements were less than 0.05 nm. In these analyses, DLS data yielding a polydispersity index of greater than 0.3 were omitted.
3. Results and Discussion
3.1. SEC
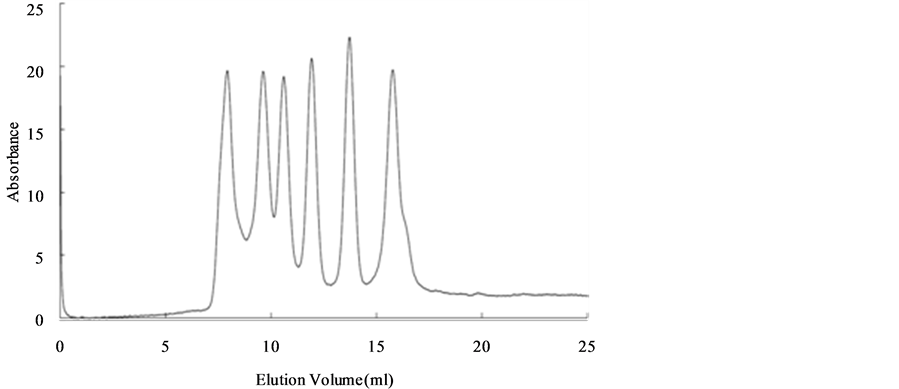
Figure 1(a) shows the elution profiles of blue dextran (a marker to confirm V0), conalbumin, ovalbumin, carbonic anhydrase, ribonuclease A and aprotinin. The Kav at peak volumes of the five proteins show a linear relationship with the log (MWaa) (Figure 1(b)). From the regression line, the calibrated MWSEC were expressed as follows:
 (a)
(a)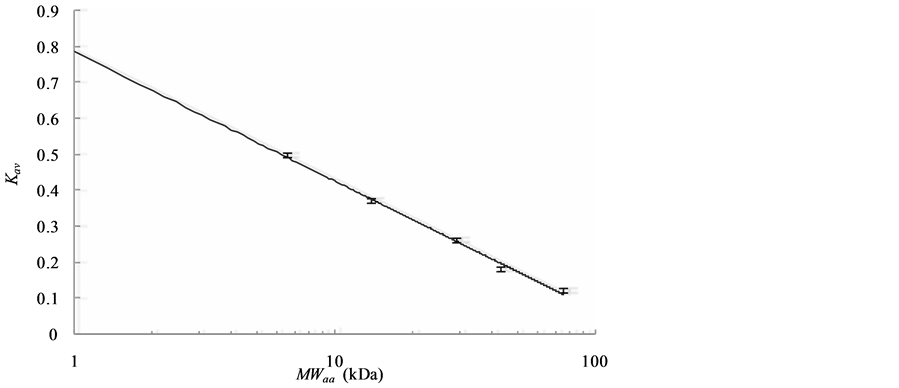 (b)
(b)
Figure 1. (a) Elution profiles of SEC monitored by the absorption at 280 nm. The six peaks in the profiles correspond with blue dextran (200 kDa), conalbumin (75 kDa), ovalbumin (43 kDa), carbonic anhydrase (29 kDa), ribonuclease A (13.7 kDa) and aprotinin (6.5 kDa), respectively; (b) Relationship between MWaa and Kav. Bars represent the Kav of each protein with standard deviation (SD; n = 3); the regression line was obtained by the least squares method.
 (4)
(4)
The difference between MWaa and MWSEC, i.e. the calibration residual error for each protein, which can be regarded as an index of the accuracy of SEC measurement, is shown in Table 1. The calibration residual error for each protein was 1.5% - 9.8% with an averaged error of 5.2% for MWSEC.
3.2. SLS
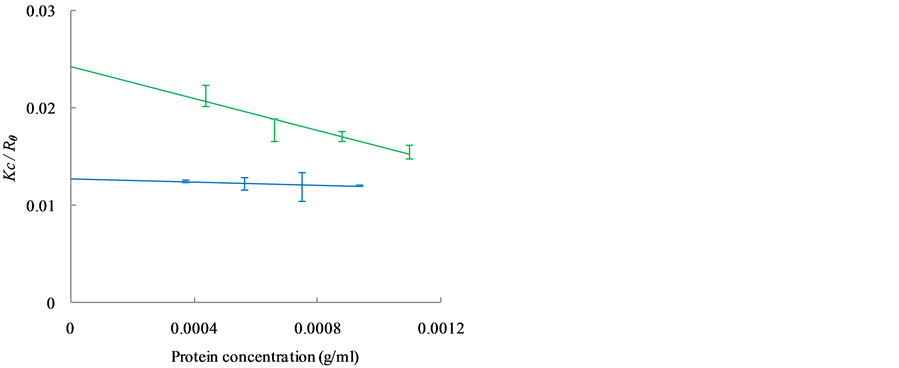
The Kc/Rθ values of carbonic anhydrase (red), ribonuclease A (gray) and aprotinin (black) are shown in Figure 2(a), while those of conalbumin (blue) and ovalbumin (green) are shown in Figure 2(b). The Kc/Rθ values show a linear dependence on concentration, as expected from Debye’s relationship (Equation (3)). The MWdeb of each protein was obtained by extrapolation to a protein concentration of 0 g/mL. Figure 2(c) shows the relationship between the MWdeb and the MWaa. From the regression line, the calibrated MWSLS were expressed as follows:
 (5)
(5)
The calibration residual error of MWSLS for each protein is 0.1% - 7.6% as summarized in Table 1. The averaged error was 4.7%, suggesting that the SLS method for estimating the MW of globular proteins can yield measurement accuracy comparable to that of SEC.
3.3. DLS
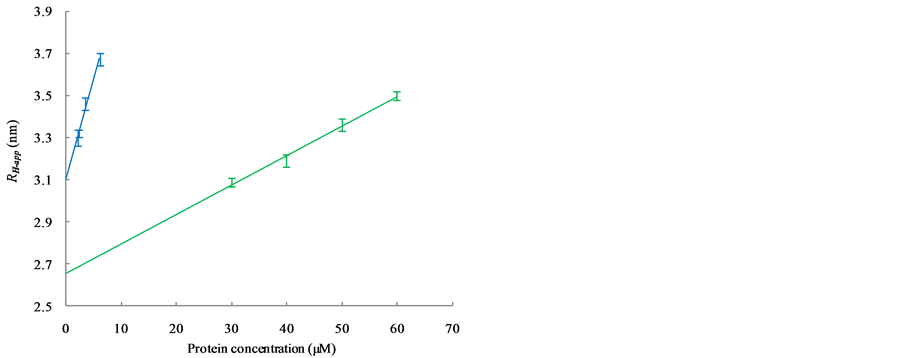
Figure 3(a) shows the relationship between RH-app and the concentrations of carbonic anhydrase (red), ribonuclease A (gray) and aprotinin (black), while Figure 3(b) shows that of conalbumin (blue) and ovalbumin (green). The RH-app were observed to depend linearly on the protein concentration, as  [13] , where c
 (a)
(a)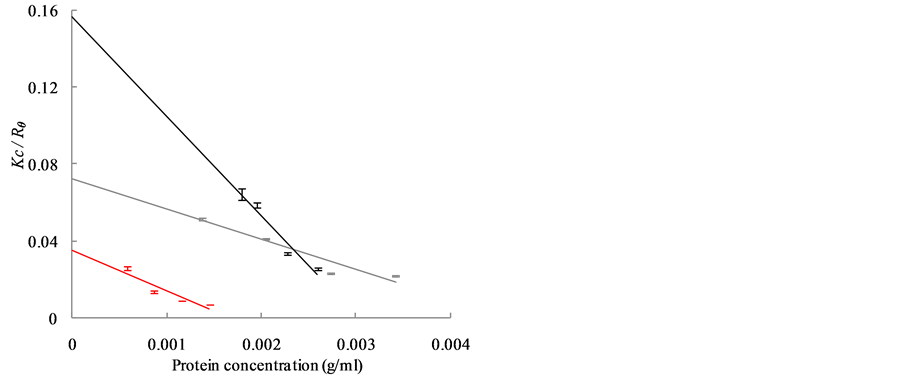 (b)
(b)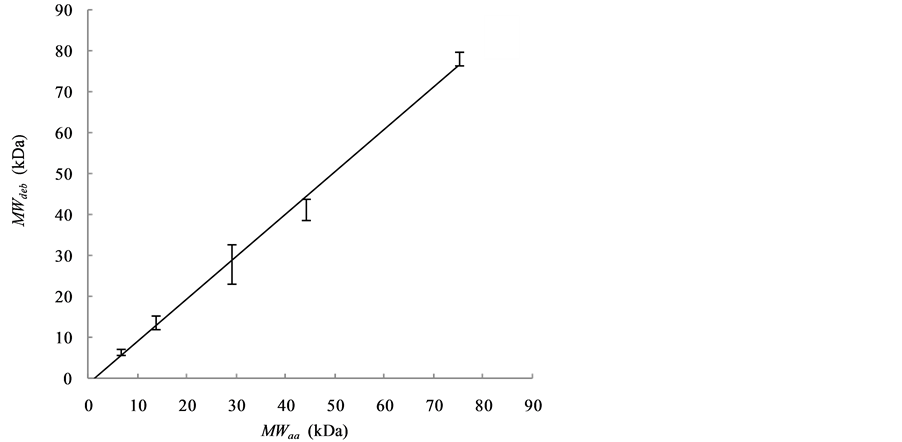 (c)
(c)
Figure 2. Dependence of Kc/Rθ on the concentration of globular protein as observed with SLS is shown in (a) and (b). (a) The data and regression lines of carbonic anhydrase (red), ribonuclease A (gray) and aprotinin (black); (b) The data and regression lines of conalbumin (blue) and ovalbumin (green); (c) The linear relationship between MWdeb and MWaa is shown by the regression line. SDs were obtained from more than seven independent measurements.

Table 1. Calibration residual errors (%) and calibrated MWs (kDa) for each protein.
*Calibrated from the RH-app at the lowest protein concentration.
is the concentration of the protein and θ is a parameter that account for the first order effect of both interparticle and hydrodynamic interactions (corresponding to the interaction parameter of the diffusion coefficient) [5] [10] . This concentration dependency strongly suggests that these interactions reduce the diffusion constants of all five proteins; the RH were therefore smaller than the RH-app at practical concentrations. By extrapolation to protein concentrations of zero, we estimated the correct RH to be 1.29 ± 0.06 nm for aprotinin, 1.73 ± 0.03 nm for ribonuclease A, 2.19 ± 0.05 nm for carbonic anhydrase, 2.65 ± 0.04 nm for ovalbumin, and 3.10 ± 0.01 nm for conalbumin.
The blue bars and regression line in Figure 3(c) show the relationship between MWaa and the extrapolated RH, whereas the red bars and regression line show the relationship between the MWaa and RH-app at the lowest protein concentrations. The MWDLS and MWDLS-app of the globular proteins were estimated from the regression lines as follows:
 (6-1)
(6-1)
 (6-2)
(6-2)
The deviations of the data points from the regression line appear to be much smaller for RH than for RH-app. The MWDLS, MWDLS-app and their calibration residual errors for RH and RH-app at the lowest concentration are summarized in Table 1. The calibration errors for each protein are 2.1% - 10.0% for MWDLS and 1.5% - 45.0% for MWDLS-app, and averaged error was 4.8% for MWDLS, which is much smaller than the 19.3% for MWDLS-app. This result clearly indicated that the extrapolation of RH-app to a protein concentration of zero significantly increases the accuracy of size measurement. In the relationship of , θ is a protein-specific parameter and the lowest protein concentrations to obtain the RH-app with a sufficiently high signal-to-noise ratio are different for each protein. The extrapolation of RH-app to a protein concentration of zero may effectively eliminate the interparticle and hydrodynamic interactions of each protein, and possibly contribute to increase the measurement accuracy.
Equation (6-1) can be expressed as follows:
 (7)
(7)
Since the power index of RH is close to 3, the latter term can be regarded as the volume of protein. Also, the value of 0.74 ± 0.07 is close to the reported densities of globular proteins (0.79 - 0.87 kDa/nm3) [14] [15] . The observed deviations from the theoretical values are probably correlated with the solvation of proteins in PBS buffer.
3.4. Accuracy of Size Measurements
Figure 4 shows the MWSEC (blue bars and regression line), MWSLS (green bars and regression line) and MWDLS (red bars and regression line) plotted against the MWaa. The calibration residual errors(%) and estimated MWs (kDa) are shown in Table 1. The errors of three MWs (MWSEC, MWSLS and MWDLS) were less than 10% for each protein, and the averaged errors were 4.7% - 5.2%. SEC, SLS and DLS therefore show comparable accuracy in the size measurement of globular proteins.
4. Summary and Conclusion
Light scattering is a method that can be used to measure the size of biomolecules relatively quickly without incurring radiation damage. The present study revealed that the extrapolation of RH-app to a protein concentration of zero significantly increases the accuracy of size measurement for DLS, which led to the size estimation of globular proteins with an accuracy equivalent to that of SEC. We hope these results will promote further utilization of light scattering methods, not only for the size estimation, but also for analyses of conformational change, oligomeric structure and protein complex formation of various proteins.
 (a)
(a)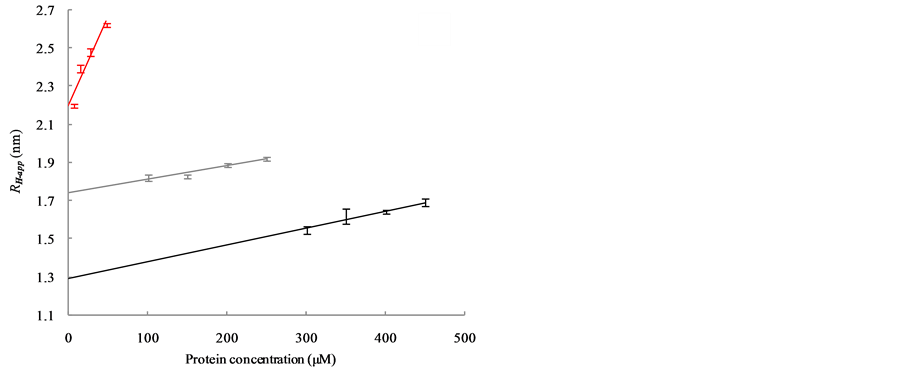 (b)
(b)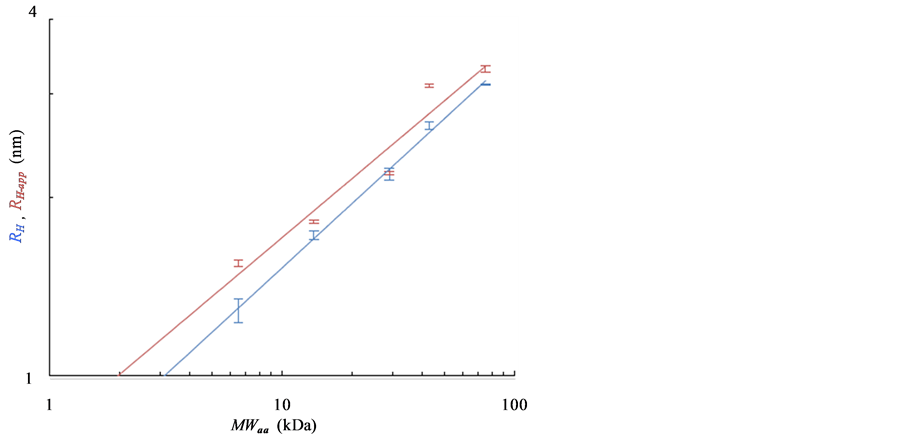 (c)
(c)
Figure 3. Dependence of RH-app on the concentration of globular protein as observed with DLS is shown in (a) and (b). (a) The bars and regression lines of carbonic anhydrase (red), ribonuclease A (gray) and aprotinin (black); (b) The bars and regression lines of conalbumin (blue) and ovalbumin (green); (c) Bars and regression lines obtained from the extrapolated RH (blue) and the RH-app at the lowest concentration (red). The formulae of the blue and red regression lines are ![]() and
and![]() , respectively. SDs were obtained from more than nine independent measurements.
, respectively. SDs were obtained from more than nine independent measurements.
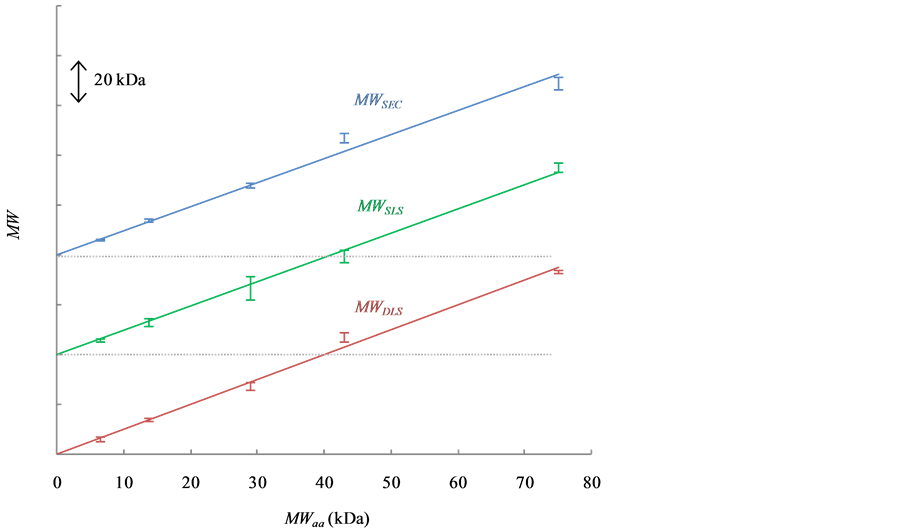
Figure 4. Relationships between MWSEC (blue), MWSLS (green) and MWDLS (red) versus MWaa. The bars and regression lines for MWSEC, MWSLS and MWDLS are longitudinally shifted to avoid overlapping of the data. The y-axis is marked at intervals of 20 kDa.
Acknowledgements
The authors thank Dr. Satoru Tokutomi at Osaka Prefecture University, and Dr. Norio Hamada and Dr. Ryosuke Nakamura at Osaka University for helpful suggestions and discussions. This research was partly supported by a Grant-in-Aid for Scientific Research on Innovative Areas (No. 23120517 to O.H.) from The Ministry of Education, Culture, Sports, Science and Technology, and by a Grant-in-Aid for Scientific Research (C) (No. 22570162 to O.H.) from the Japan Society for the Promotion of Science.
References
- Laue, T.M. and Rhodes, D.G. (1990) Determination of Size, Molecular Weight, and Presence of Subunits. Methods in Enzymology, 182, 566-587. http://dx.doi.org/10.1016/0076-6879(90)82045-4
- Murphy, R.M. (1997) Static and Dynamic Light Scattering of Biological Macromolecules: What Can We Learn? Current Opinion in Biotechnology, 8, 25-30. http://dx.doi.org/10.1016/S0958-1669(97)80153-X
- Bohidar, H.B. (1998) Light Scattering and Viscosity Study of Heat Aggregation of Insulin. Biopolymers, 45, 1-8. http://dx.doi.org/10.1002/(SICI)1097-0282(199801)45:1<1::AID-BIP1>3.0.CO;2-X
- Sasahara, K., Yagi, H., Sakai, M., Naiki, H. and Goto, Y. (2008) Amyloid Nucleation Triggered by Agitation of ß2-Microglobulin under Acidic and Neutral pH Conditions. Biochemistry, 47, 2650-2660. http://dx.doi.org/10.1021/bi701968g
- Liu, W., Cellmer, T., Keerl, D., Prausnitz, J.M. and Blanch, H.W. (2005) Interactions of Lysozyme in Guanidinium Chloride Solutions from Static and Dynamic Light-Scattering Measurements. Biotechnology and Bioengineering, 90, 482-490. http://dx.doi.org/10.1002/bit.20442
- Rabbani, G., Kaur, J., Ahmad, E., Khan, R.H. and Jain, S.K. (2014) Structural Characteristics of Thermostable Immunogenic Outer Membrane Protein from Salmonella enterica serovar Typhi. Applied Microbiology and Biotechnology, 98, 2533-2543. http://dx.doi.org/10.1007/s00253-013-5123-3
- Papish, A.L., Tari, L.W. and Vogel, H.J. (2002) Dynamic Light Scattering Study of Calmodulin-Target Peptide Complexes. Biophysical Journal, 83, 1455-1464. http://dx.doi.org/10.1016/S0006-3495(02)73916-7
- Nobbmann, U., Connah, M., Fish, B., Varley, P., Gee, C., Mulot, S., Chen, J., Zhou, L., Lu, Y., Shen, F., Yi, J. and Harding, S.E. (2007) Dynamic Light Scattering as a Relative Tool for Assessing the Molecular Integrity and Stability of Monoclonal Antibodies. Biotechnology and Genetic Engineering Reviews, 24, 117-128. http://dx.doi.org/10.1016/S0006-3495(02)73916-7
- Hanlon, A.D., Larkin, M.I. and Reddick, R.M. (2010) Free-Solution, Label-Free Protein-Protein Interactions Characterized by Dynamic Light Scattering. Biophysical Journal, 98, 297-304. http://dx.doi.org/10.1016/j.bpj.2009.09.061
- Rubin, J., Miguel, A.S., Bommarius, A.S. and Behrens, S.H. (2010) Correlating Aggregation Kinetics and Stationary Diffusion in Protein-Sodium Salt Systems Observed with Dynamic Light Scattering. The Journal of Physical Chemistry B, 114, 4383-4387. http://dx.doi.org/10.1021/jp912126w
- Grimsley, G.R. and Pace, C.N. (2004) Spectrophotometric Determination of Protein Concentration. Current Protocols in Protein Science, 33, 3.1.1-3.1.9. http://onlinelibrary.wiley.com/doi/10.1002/0471140864.ps0301s33/abstract;jsessionid=61664A5A266A57FB2E4AF38C775A4577.f03t03
- Wen, J., Arakawa, T. and Philo, J.S. (1996) Size-Exclusion Chromatography with On-Line Light-Scattering, Absorbance, and Refractive Index Detectors for Studying Proteins and Their Interactions. Analytical Biochemistry, 240, 155- 166. http://dx.doi.org/10.1006/abio.1996.0345
- Hisatomi, O., Takeuchi, K., Zikihara, K., Ookubo, Y., Nakatani, Y., Takahashi, F., Tokutomi, S. and Kataoka, H. (2013) Blue Light-Induced Conformational Changes in a Light-Regulated Transcription Factor, Aureochrome-1. Plant Cell Physiology, 54, 93-106. http://dx.doi.org/10.1093/pcp/pcs160
- Gekko, K. and Noguchi, H. (1979) Compressibility of Globular Proteins in Water at 25˚C. The Journal of Physical Chemistry, 83, 2706-2714. http://dx.doi.org/10.1021/j100484a006
NOTES

*Corresponding author.