Open Journal of Organic Polymer Materials
Vol.2 No.2(2012), Article ID:18763,7 pages DOI:10.4236/ojopm.2012.22006
Effect of Nano-Filler on Structural and Ionic Transport Properties of Plasticized Polymer Electrolyte
1Physics Department, Faculty of Science, The M. S. University of Baroda, Vadodara, India
2Department of Engineering Physics, Shri S’Ad Vidya Mandal Institute of Technology, Bharuch, India
Email: *dkkanchan.ssi@gmail.com
Received February 28, 2012; revised March 29, 2012; accepted April 11, 2012
Keywords: Nano-filler; XRD; SEM; Impedance
ABSTRACT
Polymer blend electrolytes, where PEO-PMMA polymer blend is used as polymer host matrix, doped with AgNO3 and plasticized with ethylene carbonate (EC) and Al2O3 as nano-filler were synthesized using the solution cast techniques. The polymer films were characterized by impedance spectroscopy, XRD, DSC, SEM, FT-IR and ionic transport measurements. The results indicate an enhancement in conductivity of PEO-PMMA-AgNO3-EC polymer electrolytes. The ionic conductivity of the polymer films is also found to increase with temperature. Electrical properties of polymer films in the framework of dielectric and modulus formalism are studied and discussed.
1. Introduction
Solid polymer electrolytes have attracted attention since more than three decades due to their practical applications as well as for fundamental knowledge [1-5]. In literature, researchers have worked on many host polymers e.g. poly(ethylene oxide) (PEO), poly(methyl methacrylate) (PMMA), poly(vinyl chloride) (PVC) and poly(vinyl acetate) (PVA)etc. [6-10] to optimize electrical conductivity and other properties for their practical application as polymer electrolytes. Among these polymers, PEO is still an active candidate for polymer electrolytes [6] due to its good salvation power, having single helical structure which supports the fast ionic conduction and many more physicochemical properties but their practical applications are limited due to semi-crystalline nature of PEO at room temperature. It is reported by Radhakrishnan et al. [11] that crystallization of PEO can be controlled by its blending with amorphous polymer. The plasticization of polymer electrolyte is also helpful in improving the ionic conductivity by increasing the concentration of free mobile ions resulting from the reduction in viscosity of the polymer complex and increasing flexibility of polymer backbone [12]. Recently, M.R. Johan et al. [6] reported that the addition of nano-particles creates disorder in polymer electrolytes which in turn favors the amorphousity resulting in enhanced ionic transport.
Hence, authors have made an attempt to investigate the effect of nano-filler Al2O3 on structural and ionic transport properties of PEO-PMMA-AgNO3-EC (PPAE) polymer electrolyte. The effects of this and other nano-fillers in different systems have been reported previously by many workers [6,7,13,14] but a systematic study of nanofiller Al2O3 to plasticized PEO-PMMA polymer blend has not been observed yet. Therefore, the effect of nanofiller on the microstructural, structural, thermal, electrical and dielectric properties of plasticized polymer film has been undertaken to enhance the understanding of the ion transport in this blended polymer nano-composite.
2. Experimental Description
2.1. Starting Materials
Commercially available chemicals of PEO (Mw= 3 × 10⁵, Alfa Aesar), PMMA (Mw = 3.5 × 10⁵, Alfa Aesar), AgNO3, EC (Aldrich) were employed as starting materials. PEO and PMMA were weighed in 50:50 weight percentages and the concentration of AgNO3 and EC were kept fixed as 5 wt%. Nano-composite was prepared by adding 4 wt% of nano-filler Al2O3 in PMMA-PEO-AgNO3 polymer electrolytes using acetonitrile as solvent. All the samples were prepared by solution cast method.
2.2. Sample Preparation
PEO and PMMA were separately dissolved in acetonitrile separately and stirred by using a magnetic stirrer. The stirring of PMMA solution was carried out at 323 K for 24 h to dissolve PMMA in acetonitrile. PEO and silver nitrate (AgNO3) were mixed and stirred for 4 - 5 h at room temperature. Both the solutions were mixed along with the desired amount of plasticizer and nano-filler. The obtained mixture was again stirred at room temperature for another 10 h for homogenous mixing. Finally the solution was poured into a Teflon Petri dish and left to evaporate the solvent slowly at ambient temperature. The resulting films were kept in an oven at 313 K for 2 days to ensure the removal of the solvent traces. The dried films were peeled off from the Petri-dish and then were stored in dark desiccators to prevent them any contamination from moisture and/or light.
2.3. Characterization
X-ray diffraction (XRD) measurement was carried out using monochromatic Cu-Kα radiation (=1.5418 Å) in x-ray diffractometer (Brucker NSZ, model D8) in the range of 10˚ - 50˚ at a scan rate of 2˚. The differential scanning calorimetry (DSC) of the prepared polymer films was carried out using SII EXSTAR-6000 equipment in the range from ambient temperature to 363 K with a heating rate of 10 K/min in nitrogen atmosphere. The polymer samples of about 2 - 3 mg were encapsulated in aluminum pans.
The surface morphology of the plasticized polymer complexes were investigated by using scanning electron microscope (JOEL JSM-6380LV) at 20 kV. The polymer films were gold coated under vacuum by electron beam gold palladium source (80% Au, 20% Pd) by JEOL coater (Model JFC-1600) to make them conducting and mounted onto circular aluminum stubs with double side sticky tapes. Fourier transform infrared (FT-IR) spectra of the prepared samples were recorded in the wavenumber range of 400 - 3000 cm–1 using single beam FT-IR 4100 JASCO model by directly mounting in the sample holder in a transmission mode.
2.4. Electrical Measurements
X-ray Complex impedance spectroscopy has been employed for electrical measurements using the impedance gain/phase analyzer (SOLARTRON 1260) interfaced to a computer in the frequency range of 10 Hz - 1MHz at different temperatures between 273 and 353 K. For the impedance measurements, the polymer electrolyte films were sandwiched between two silver electrodes of radius 1cm under spring pressure in a temperature controlled furnace. The obtained impedance plots were fitted using Zview2 program (developed by Solartron Analytical).
3. Results and discussion
Figure 1 shows the X-ray diffraction patterns of pure
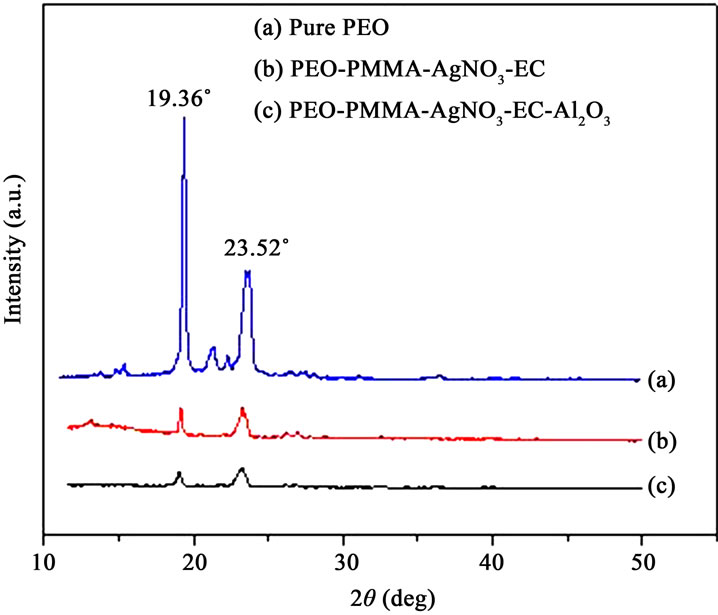
Figure 1. XRD patterns of pure, plasticized and nano-composite polymer films.
PEO, PEO-PMMA-AgNO3-EC (PPAE) and PEO-PMMAAgNO3-EC-Al2O3 (PPAEA) polymer films. The diffraction peaks of pure PEO are observed at 19.36˚ and 23.52˚. These diffraction peaks are observed to shift towards lower angle side with small broadening with decreased intensity. The incorporation of plasticizer and nano-filler disturb the crystalline region and increase the amorphous phase of PEO. The blended polymer electrolyte undergoes significant structural reorganization when EC and Al2O3 are added and an increase in the amorphous phase is observed to be dominant. This amorphous nature may lead to higher ionic conductivity which is generally observed in amorphous polymer electrolytes with flexible backbone [15].
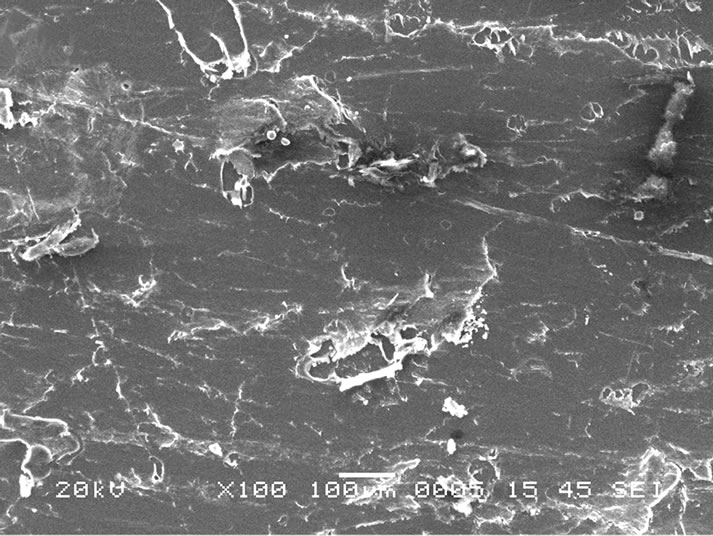
To get information about the temperatures of the different phase transitions due to rearrangement of polymer chains on heating, DSC measurements have been carried out on the polymer films. The typical DSC plots of the PPAE and PPAEA polymer films are shown in Figure 2. The observed sharp endothermic peak indicates the melting temperature, Tm of PEO in polymer complexes. There is a reduction in Tm value when nano-filler is added to the PPAE polymer film. This is a signature of reduction of crystallinity or in other words, increase in flexibility of the polymer chains. Scanning electron micrograph (SEM) is generally used to study the compatibility among various constituents of the polymer electrolytes. The SEM images of the polymer films are depicted in Figures 3(a) and (b). The micrograph shows with the addition of nano-filler, the surface shows a uniformly distributed area. The above micro-structural observation is in good agreement with XRD and DSC results which have indicated an enhancement in the amorphous phase with the addition of nano-filler.
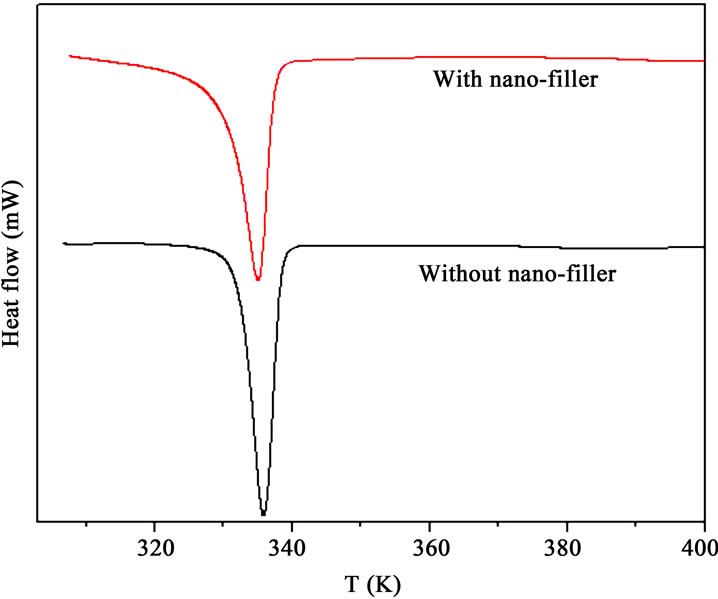
Figure 2. DSC thermograms of PPAE & PPAEA polymer films.
 (a)
(a)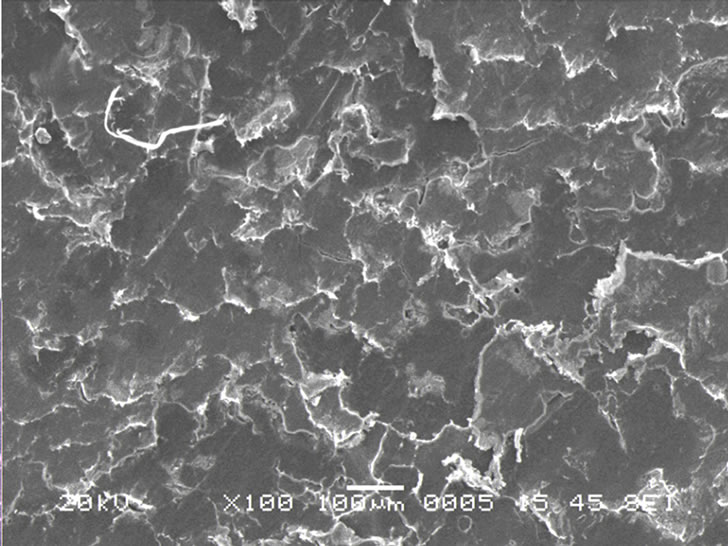 (b)
(b)
Figure 3. SEM images of (a) PPAE & (b) PPAEA polymer films.
FTIR is a useful technique to characterize the organic, inorganic and composite materials [16]. Figure 4 shows the room temperature FT-IR spectra of PPAE and PPAEA polymer films. PPEA polymer film shows IR bands at 750, 844, 1725, 1812, 1962 cm-1 and broad band in the range of 920 - 990 cm–1. The vibration band at 750 and 844 cm–1 is attributed to CH rocking vibration of PMMA and PEO respectively. The broad band in the wavenumber 900 - 990 cm–1 may be due to the bending vibration of EC. The absence of triple peak of crystalline PEO at 1059, 1095 and 1145 cm–1 [17] indicates reduction in crystallinity of PEO in polymer complex. The vibrational peak at 1736 cm–1 due to the C=O stretching of PMMA and EC [18,19] is observed to shift at 1725 cm–1. The formation of new vibration band at 1812 cm–1 is observed. M. Sundar et al. [20] reported the vibrational band of pure PEO at 1965 cm–1 which is shifted to lower wave number 1962 cm–1 in the present case (plasticized and blended polymer electrolyte).
In PPAEA polymer electrolyte film in which the nanofiller is added, the peaks of IR spectrum is found to be quite broadened as compared to that of PPEA polymer electrolyte. In addition to this, the vibration bands in the wave number 500 - 1480 cm–1 range are found absent. The vibration peaks at 1725, 1812 and 1962 cm–1 remain at same position but with decreased peak intensity. Hence, the above IR analysis confirms that the nano-filler Al2O3 helps in enhancing the amorphous nature with flexible polymer chains.
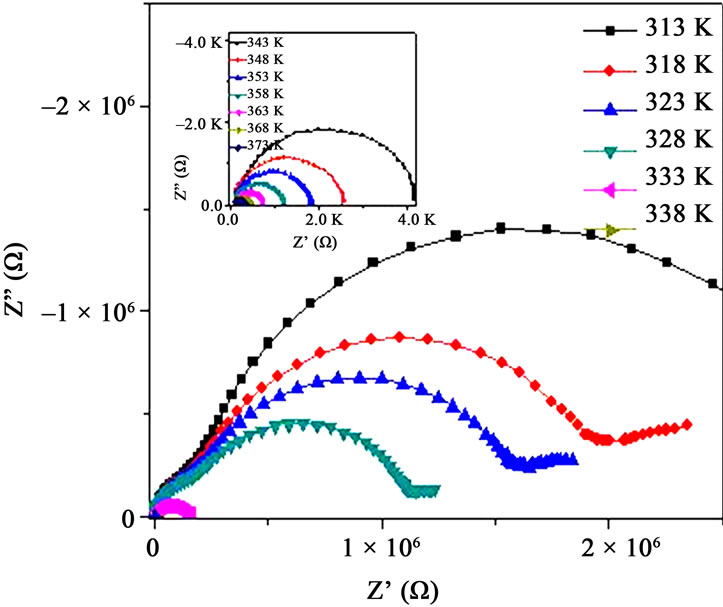
Impedance spectroscopy is a useful tool to investigate the conduction mechanism, the mobility and participation of polymer chains in carrier generation processes. Figure 5(a) shows the complex impedance plot of PPAE polymer film at various temperatures. With the rise in temperature, the intercept of the arc of the impedance spectra shifts towards the origin on the real axis i.e., the bulk resistance (RB) of the PPPA samples decreases with

Figure 4. FT-IR spectra of plasticized and nano-composite polymer thin films.
 (a)
(a)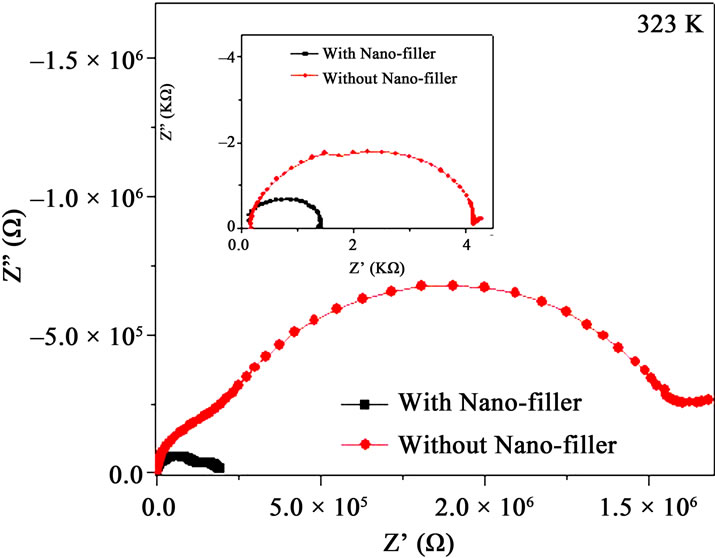 (b)
(b)
Figure 5. (a) Impedance plot of PPAE polymer film at various temperatures, inset shows above Tm; (b) Impedance plots of PPAE and PPAEA polymer films at 323K and inset shows the same at temperature above Tm.
temperature. It is observed that the impedance plots are the depressed semicircles which indicate the relaxation of ions as non-Debye in nature [21]. Two semi-circle features are observed below Tm and show only one semicircle as the temperature is raised beyond Tm (inset of Figure 5(a)). Figure 5(b) represents the impedance plot for with and without nano-filler polymer films. The value of bulk resistance RB value is reduced when nano-filler is added in the polymer complex both at below and above Tm (Figure 5(b) & its inset).
The ionic conductivity is calculated from the bulk resistance and knowing dimensions of polymer films. The conductivity enhancement is observed when the nanofiller is added in the polymer complex below the melting temperature as well as above this point. Nano-filler favors additional transient sites [6] for Ag+ ion migration and also promotes amorphous phase in polymer film which is evident from XRD, DSC and SEM studies thus providing favorable conducting pathways for Ag+-ions. Figure 6 depicts the variation of ionic conductivity as a function of inverse temperature for without and with nano-filler. With the rise in temperature, the conductivity increases with an Arrhenius type of temperature dependence below Tm. As the temperature approaches Tm, the conductivity of polymer is enhanced by two orders of magnitude with a distinct transition. The rise in conductivity with temperature is interpreted in terms of hopping mechanism between coordination sites, local structural relaxation and segmental motion of polymer. As the temperature reaches Tm (transition from semi-crystalline to amorphous phases), the creation of more amorphous regions is taking place which favors the inter-chain and intra-chain movements of polymer matrix [22]. Transition near the softening point in PEO-based polymer electrolytes are reported by several workers [6,16,23]
To find the transference number of ionic and electronic transfer, Wagner’s polarization technique was used [24]. In this technique, a fixed dc voltage of 500 mV is applied across Ag/electrolytic material/Ag cell and the dc current is monitored as a function of time. The ionic transference number (tion) for PPAE polymer film is found to be 0.74 which is less than that of PPAEA (tion≈ 0.94). This indicates that the charge transport in these polymer electrolytes films is mainly due to ions and ionic a contribution in PPAEA polymer electrolyte is significantly more than as compared to with out filler film (PPEA) due to the addition of nano-filler.
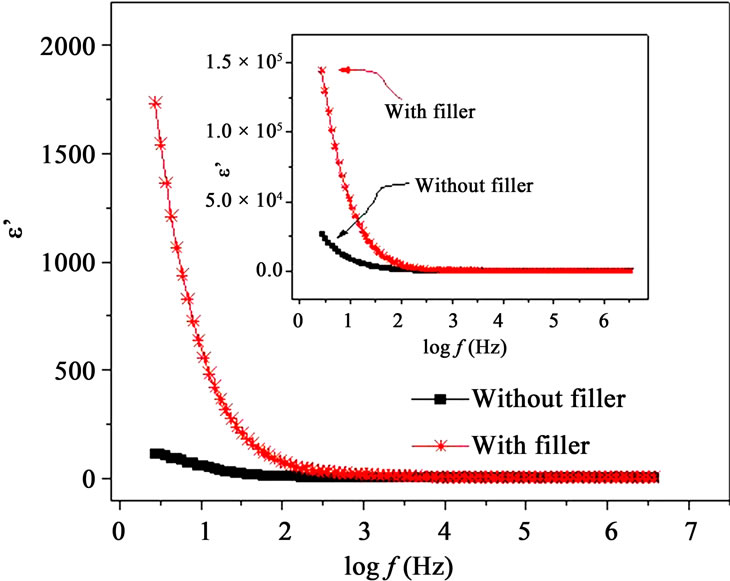
Figures 7(a) and (b) show the frequency dependence of the real and imaginary parts, e’ and e” of the dielectric permittivity, respectively for with filler and filler free polymer films. The incorporation of nano-filler in PPAE polymer electrolyte increases e’ and e” values are over
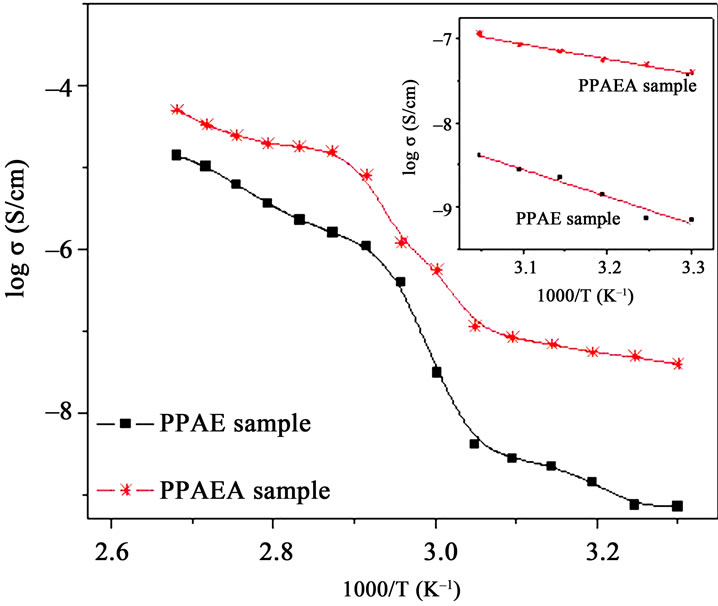
Figure 6. 1000/T vs. ionic conductivity plot.
the entire frequency and temperature range. Inset of Figures 7(a) and (b) also shows that there is a significant increase in e’ and e” values due to incorporation of nanofiller even above Tm. The dielectric constant or real part of dielectric e’, is observed to decrease with frequency which is a characteristic of disordered solids. e’ and e” rise sharply towards low frequencies attributing to the free charge build up at the interface between the polymer film and the electrode (electrode polarization effects) which masks the other relaxation processes. As the temperature increases, the real and imaginary parts of dielectric constant are observed to increase (insets of Figures 7(a) and (b)). Similar behavior has also been observed for other materials [12,25] and this can be understood as the system is assumed to be formed of molecular dipoles which remain frozen at low temperatures. With the rise
 (a)
(a)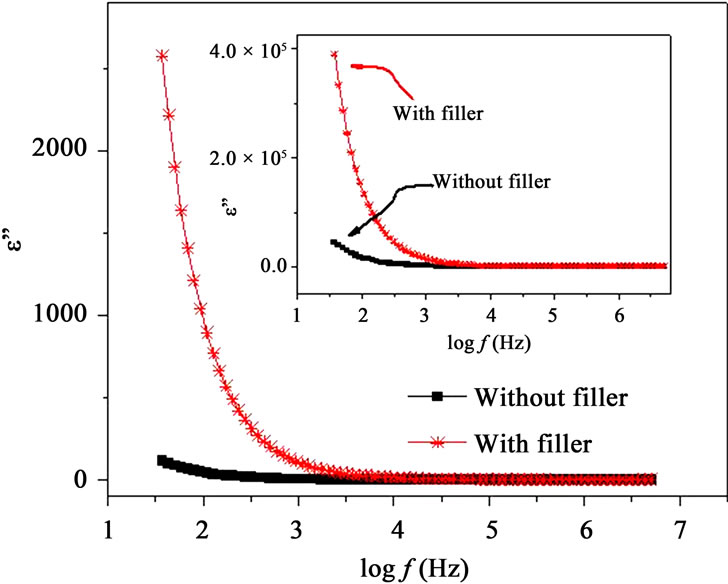 (b)
(b)
Figure 7. (a) Frequency dependent real part of permittivity, e’ at T < Tm and inset shows the same at T > Tm; (b) Frequency dependent imaginary part of permittivity, e” at T < Tm and inset shows the same at T > Tm.
in temperature, these dipoles become more thermally activated, having more rotational freedom leading to the increase in dielectric constant. A further analysis of the dielectric behavior would be more successfully achieved by using the formulation of dielectric modulus, which suppresses the effects of the electrode polarization.
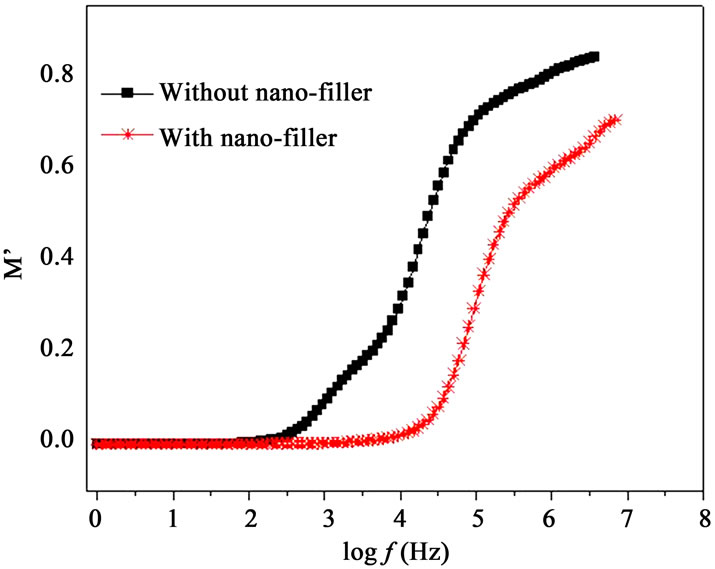
Modulus formalism masks the low frequency dispersion due to the electrode polarization effects as observed in e’ and e” values [13,23]. To overcome these effects and to confirm the ionic conduction relaxation processes, modulus formalism is generally used in materials. Figures 8(a) and (b) represent the real (M’) and imaginary (M”) parts of modulus M’, respectively for with nanofiller and without filler polymer electrolytes. The reduction in M’ values for polymer film with nano-filler indicates increase in charge carriers i.e. Ag+-ions as well as polymer segmental motion. While M” peak is found to
 (a)
(a)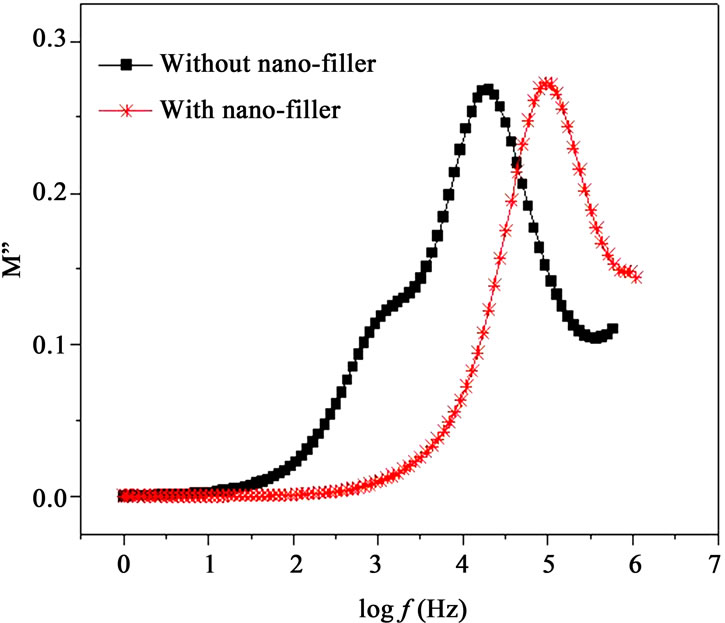 (b)
(b)
Figure 8. (a) Frequency dependent M’ at 328 K; (b) Frequency dependent M” at 328K.
shift higher frequency side (Figure 8(b)) when nanofiller is added in plasticized polymer electrolyte. As discussed above, the incorporation of nano-filler to the polymer matrix creates conducting pathways which help in conduction. Frequency dependent M’ and M” show an increase at the high frequency end with a decrease towards low frequencies, showing the fact that the electrode polarization phenomena make a negligible contribution. The observed long tail at low frequencies resulting from the large capacitance associated with the electrode [13]. At higher frequencies, the presence of dispersion in M’ and relaxation peak in M” peaks for polymer electrolytes indicate that the polymer electrolyte films are ionic conductors and are due to spreading of the conductivity relaxation over a range of frequencies [26]. M’ values are found higher for the polymer electrolyte with nano-filler. The frequency, fmax corresponding to M” peak indicates the ionic relaxation process which separates the change in ions from dc to ac transport. The ionic conduction relaxation time (t) is calculated from the relation t = 1/2p fmax[21]. In the case of PPAEA i.e., polymer film with nano-filler, the observed shift of fmax towards higher frequency side (Figure 8(b)) indicates reduction in the relaxation time for the nano-composite (PPAEA) which is found in agreement with the conductivity values.
4. Conclusion
Plasticized solid polymer electrolytes with alumina nanofiller are synthesized. The XRD, DSC, SEM and FTIR analysis indicate reduction of crystallinity phase due to addition of nano-filler. FTIR studies confirmed that the complexation occurs between host polymer blend, plasticizer and salt. The incorporation of nano-filler Al2O3 has led to significantly enhance the ionic conduction as observed from the ionic transference number measurements leading to high ionic conductivity. The observed higher ionic conductivity in polymer film with nano-filler Al2O3 is due to the creation of more conducting pathways resulting in increased chain flexibility, carrier concentration as well as amorphousity. The ionic conductivity of polymer films is observed to increase with temperature with a transition near Tm. Analysis of dielectric permittivity and electric modulus behavior reflects a non-Debye type relaxation and also distribution of relaxation time. The relaxation time is found in good correlation with the conductivity results.
5. Acknowledgements
P. Sharma thankfully acknowledges the financial support by UGC, New Delhi, India for RFSMS fellowship.
REFERENCES
- J. E. Bauerle, “Study of Solid Electrolyte Polarization by a Complex Admittance Method,” Journal of Physics and Chemistry of Solids, Vol. 30, No. 12, 1969, pp. 2657- 2670.
- P. V. Wright, “Polymer Electrolytes—the Early Days,” Electrochimica Acta, Vol. 43, No. 10-11, 1998, pp. 1137- 1143.
- V. D. Noto, S. Lavina, G. A. Giffin and E. Negro, “Polymer Electrolytes: Present, Past and Future,” Electrochimica Acta, Vol. 57, 2011, pp. 4-13.
- J. Evans and C. A. Vincent, “Electrochemical Measurement of Transference Numbers in Polymer Electrolytes,” Polymer, Vol. 28, No. 13, 1987, pp. 2324-2328.
- H. Block and A. M. North, “Dielectric Relaxation in Polymer Solutions,” Advances in Molecular Relaxation Processes, Vol. 1, No. 4, 1970, pp. 309-374.
- M. R. Johan, O. O. Shy, S. Ibrahim, S. M. M. Yassin and T. Y. Hue, “Effects of Al2O3 Nano-Filler and EC Plasticizer on the Ionic Conductivity Enhancement of Solid PEO-LiCF3SO3 Solid Polymer Electrolyte,” Solid State Ionics, Vol. 196, No. 1, 2011, pp. 41-47.
- P. Mahanandia and K. K. Nanda, “Anisotropic Electrical Transport Properties of Poly(Methyl Methacrylate) Infiltrated Aligned Carbon Nanotube Mats,” Applied Physics Letters, Vol. 100, No. 2, 2012, Article ID: 022108.
- Z. Ahmad, N. A. Al-Awadi and F. Al-Sagheer, “Thermal Degradation Studies in Poly(Vinyl Chloride)/Poly(Methyl Methacrylate) Blends,” Polymer Degradation and Stability, Vol. 93, No. 2, 2008, pp. 456-465.
- J. Qiao, J. Fu, R. Lin, J. Ma and J. Liu, “Alkaline Solid Polymer Electrolyte Membranes Based on Structurally Modified PVA-PVP with Improved Alkali Stability,” Polymer, Vol. 51, No. 21, 2010, pp. 4850-4859.
- C. C. Yang, “Ni-MH Battery Based on PEO-PVA-KOH Polymer Electrolyte,” Polymer, Vol. 109, No. 1, 2002, pp. 22-31.
- S. Radhakrishnan and P. D. Venkatachalapathy, “Effect of Casting Solvent on the Crystallization in PEO/PMMA Blends,” Polymer, Vol. 37, No. 16, 1996, pp. 3749-3752.
- S. Ramesh, R. Shanti and R. Durairaj, “Effect of Ethylene Carbonate in Poly (Methyl Methacrylate)-Lithium Tetraborate Based Polymer Electrolytes,” Journal of NonCrystalline Solids, Vol. 357, No. 5, 2011, pp. 357-1363.
- S. Ramesh and L. C. Wen, “Investigation on the Effects of Addition of SiO2 Nanoparticles on Ionic Conductivity, FTIR, and Thermal Properties of Nanocomposite PMMA- LiCF3SO3-SiO2,” Ionics, Vol. 16, No. 3, pp. 255-262.
- D. Keomany, J. P. Petit and D. Deroo, “Electrochemical Insertion in Sol-Gel Made Ceo2-Tio2 from Lithium Conducting Polymer Electrolyte: Relation with the Material Structure,” Solar Energy Materials and Solar Cells, Vol. 36, No. 4, 1995, pp. 397-408.
- S. Ramesh, C. W. Liew, E. Morris and R. Durairaj, “Effect of PVC on Ionic Conductivity, Crystallographic Structural, Morphological and Thermal Characterizations in PMMA-PVC Blend-Based Polymer Electrolytes,” Thermochimica Acta, Vol. 511, No. 1-2, 2010, pp. 140- 146.
- D. K. Pradhan, R. N. P. Choudhary, B. K. Samantaray, A. K. Thakur and R. S. Katiyar, “Effect of Montmorillonite Filler on Structural and Electrical Properties of Polymer Nanocompsite Electrolytes,” Ionics, Vol. 15, No. 3, 2009, pp. 345-352.
- S. A. M. Noor, A. Ahmad, I. A. Talib and M. Y. A. Rahman, “Morphology, Chemical Interaction and Conductivity of a PEO-ENR50 Based on Solid Polymer Electrolytes,” Ionics, Vol. 16, No. 2, 2010, pp. 161-170.
- S. Rajendran, V. S. Bama and M. R. Prabhu, “Effect of Lithium Salt Concentration in PVAc-PMMA Based Gel Polymer Electrolytes,” Ionics, Vol. 16, No. 1, 2010, pp. 27-32.
- S. Ramesh and G. P. Ang, “Impedance and FTIR Studies on Plasticized PMMA-LiN(CF3SO2)2 Nanocomposite Polymer Electrolytes,” Ionics, Vol. 16, No. 5, 2010, pp. 465-473.
- M. Sundar and S. Selladurai, “Effect of Fillers on Magnesium-Poly(Ethylene Oxide) Solid Polymer Electrolyte,” Ionics, Vol. 12, No. 4-5, 2006, pp. 281-286.
- M. S. Jayswal, D. K. Kanchan, P. Sharma and M. Pant, “The Effect of PbI2 on Electrical Conduction in Ag2OV2O5-B2O3 Superionic Glass System,” Solid State Ionics, Vol. 186, No. 1, 2011, pp. 7-13.
- S. Ramesh, R. Shanti and E. Morris, “Discussion on the Influence of DES Content in CA-Based Polymer Electrolytes,” Journal of Materials Science, Vol. 47, No. 4, 2012, pp. 1787-1793.
- A. Bhide and K. Hariharan, “Ionic Transport Studies on (PEO)6: NaPO3 Polymer Electrolyte Plasticized with PEG400,” European Polymer Journal, Vol. 43, No. 10, 2007, pp. 4253-4270.
- W. Wagner and J. B. Wagner, “Electrical Conductivity Measurements on Cuprous Halides,” The Journal of Chemical Physics, Vol. 26, No. 6, 1957, p. 1597.
- D. K. Pradhan, R. N. P. Choudhary and B. K. Samantaray, “Studies of Dielectric and Electrical Properties of Plasticized Polymer Nanocomposite Electrolytes,” Materials Chemistry and Physics, Vol. 115, No. 2-3, 2009, pp. 557- 561.
- R. J. Sengwa and S. Sankhla, “Ionic Conduction and Dielectric Dispersion Study on Chain Dynamics of Poly (Vinyl Pyrrolidone)-Glycerol Blends,” Indian Journal of Pure and Applied Physics, Vol. 46, No. 7, 2008, pp. 513- 520.
NOTES
*Corresponding author.