Open Journal of Soil Science
Vol.2 No.4(2012), Article ID:26182,8 pages DOI:10.4236/ojss.2012.24043
Long-Term Exclusion of Grazing Increases Soil Microbial Biomass but Not Diversity in a Temperate Grassland
![]()
1College of Life Sciences, University of Chinese Academy of Sciences, Beijing, China; 2Environmental Futures Centre, Griffith University, Nathan, Australia; 3Scion, Fendalton, Christchurch, New Zealand.
Email: *zhou318@yahoo.com.cn, *yfwang@gucas.ac.cn
Received August 12th, 2012; revised September 14th, 2012; accepted September 28th, 2012
Keywords: Grazing; Microbial Biomass; Community Structure; Diversity; DGGE; Clone Library; Inner Mongolia
ABSTRACT
Restoration of grassland such as exclusion of grazing has been considered to increase aboveground plant diversity and soil fertility. However, knowledge on the effect of long-term exclusion of grazing on soil bacterial community structure and diversity is not well understood. The two sites were selected in the Inner Mongolian grassland, i.e., one fenced off since 1979 (UG79) and the other continually grazed by sheep (FG) all along. Soil microbial biomass was measured using fumigation method and bacterial community structure and diversity were assessed using methods of denaturing gradient gel electrophoresis (DGGE) and clone library. Results showed that the UG79 soil had significantly higher microbial biomass carbon and nitrogen compared with the FG soil. There was a clear separation in soil bacterial community structure, but not in bacterial diversity between the two sites. Moreover, 55 clones from the UG79 soil and 56 clones from the FG soil were selected and sequenced. Phylogenetic analysis of all clone sequences indicated that bacterial communities were dominated by the groups of Actinomycetes, Proteobacteria and Bacteroidetes, but there were no significant differences in bacterial diversity between the two sites, consistent with the results obtained from DGGE. The results highlighted that although long-term exclusion of grazing increased soil microbial biomass, but it did not harbor higher bacterial diversity compared with freely grazed site.
1. Introduction
Ungulate grazing plays a vital role in carbon (C) and nitrogen (N) cycling in grassland ecosystems [1]. Overgrazing may lead to degradation of grassland [2]. Restoration of grassland by exclusion of grazing has usually been used to increase aboveground plant biomass and soil fertility, which greatly affect belowground microbial community structure and diversity [3]. Many studies have documented the effects of grazing intensity on aboveground plant communities [4], belowground microbial communities [5,6], and C and N mineralization [7,8]. However, few studies have conducted the effect of longterm exclusion of grazing on soil bacterial community structure and diversity.
Grazing has been found to decrease soil microbial biomass irrespective of changes in both the quantity and quality of litter [9]. Recently, Klumpp et al. [6] have reported that compared with low level grazing, intensive grazing leads to a change in soil microbial communities and a proliferation of Gram(+) bacteria in a controlled experiment. However, change in bacterial communities in response to grazing are more complicated than we expected [10]. For example, McCaig et al. [11] did not observe obvious changes in soil bacterial community structure between the grazed and non-grazed sites using method of denaturing gel gradient electrophoresis (DGGE). Jangid et al. [12] found that soil bacterial community structure rather than diversity significantly differed along a chronosequence of restoration of grassland using methods of phospholipid fatty acid and clone libraries. Zhou et al. [13] found that soil bacterial diversity changed monotonically with increasing grazing intensities. Therefore, it is necessary to investigate the effect of long-term exclusion of grazing on soil bacterial community structure and diversity in order to improve the sustainable management of grassland ecosystems.
The Inner Mongolian temperate grassland approximately accounts for 12% of the national area in China and acts as an important and representative part of the Eurasian grasslands [3,14]. There are two sites in Inner Mongolia selected for this study; one has been fenced since 1979 (UG79) representing an undisturbed and climax steppe community, and the other (FG) has been subjected to continually grazing outside the UG79 site
[15]. The objectives of this study were to compare soil microbial biomass and bacterial community structure and diversity using methods of PCR-DGGE and clone libraryies between the two sites. We hypothesized that long-term exclusion of grazing would increase soil microbial biomass and bacterial diversity.
2. Materials and Methods
2.1. Site Description and Soil Sampling
The experimental sites are located in Xilin River Watershed of Inner Mongolia Autonomous Region (43˚32'N, 116˚40'E, 1200 m a.s.l). The region is characterized by a continental climate with dry, cold winters and warm, wet summers and the mean annual air temperature is −0.7˚C. The mean annual precipitation is ca. 350 mm according to local record and most of them occurs from April to September. The soil type is a dark chestnut (Mollisol) according to FAO classification with a texture of ca. 21% clay, 60% sand and 19% silt [2].
The area being grazed by herds consisted of 70% - 90% sheep and 10% - 30% goats. Prior to 1979, the whole experimental area was generally grazed under a low intensity. In 1979, the UG79 site (24 ha) was fenced and excluded from grazing. The grassland outside the UG79 site was continually grazed (FG). The FG site is assumed to represent a heavily grazing intensity of 2 sheep units (1 SU = 1 ewe and 1 lamb) ha−1·yr−1 [3].
The UG79 site is dominated by perennial rhizome grasses such as Leymus chinensis and Stipa grandis which represents a widely distributed grassland community in the Eurasian grasslands [3,14]. However, the FG site is dominated by herbaceous species such as Artemisia frigid and Pedicularis acaulis. The UG79 soil had a pH of 7.1 and 21.7 mg·kg−1 of soil organic C, while the FG soil had a pH of 7.2 and 18.7 mg·kg−1 of soil organic C.
Three plots (20 × 30 m) within the two sites were selected at 50 m intervals. Soil samples were taken from a depth of 0 to 5 cm with a 3 cm diameter auger within each plot in August 2004. All soil cores within each plot were immediately mixed thoroughly and kept in a cooler (ca. 4˚C). After passing through 2-mm sieve, the soil samples were stored at 4˚C for a week prior to analysis.
2.2. Measurement of Soil Biochemical Properties and Microbial Biomass
Soil moisture content was determined after being ovendried at 105˚C overnight. Soil pH was measured at a 1:2.5 dry soil/water ratio. Soil organic C was analyzed using a H2SO4-K2Cr2O7 oxidation method. Soil organic N was measured using the Kjeldahl digestion method (Kjektec System 1026 Distilling Unit, Sweden).
Microbial biomass C (MBC) and N (MBN) were measured by the chloroform fumigation-extraction method [16]. Briefly, two portions of 10 g field moist soil samples were weighed, and one portion of them was fumigated with chloroform for 24 h and extracted with 0.5 M K2SO4 for 1 h, and then filtered through a Whatman No. 42 paper. The other proportion of soil was directly extracted as above. The amounts of total soluble organic C and total soluble N in the fumigated and unfumigated soil extracts were determined using SHIMA-DZU TOC-VCPH/CPN analyzer (fitted with a TN unit). Microbial quotient was the ratio of MBC to soil organic C.
2.3. Extraction and PCR Mmplification of Soil DNA
Nucleic acids were extracted from soil samples (0.5 g dry weight equivalent) based on the procedure described in Zhou et al. [13]. Briefly, after soil samples were homogenized for 30 s in a FastPrep bead beater cell disrupter (Bio101), nucleic acids were precipitated and washed twice in 75% (v/v) ethanol. The final crude extracts were purified with Qiagen gel extraction Kit (Qiagen, Inc.).
The PCR amplification of bacterial communities was performed in a 25 μl (total volume) reaction mixture using primers of 16S rRNA gene P338F with a 40-mer GC clamp and P518R (Muyzer et al., 1993). The final concentration of different components in the mixture included ca. 50 ng of purified DNA, 0.4 μM of each primer, 200 μM of each deoxynucleoside triphosphate, 1.5 mM MgCl2, 1 × thermophilic DNA polymerase 10 × reaction buffer (MgCl2-free), 1.25 U per 50 μl of Taq DNA polymerase (Promega, Madison, WI, USA), and DNAse and RNAse free filter sterilized water (Liyuan Apparatus Co. Beijing, China). PCR was performed using the following procedure: 95˚C for 5 min followed by 25 cycles of 94˚C for 1 min, 55˚C for 1 min, and 72˚C for 1 min and a final extension step of 72˚C for 10 min. The PCR samples were amplified on a PTC-200 thermal cycler (MJ Research Com., USA) and the final PCR products were checked on a 1.2% agarose gel stained with ethidium bromide.
2.4. DGGE Analysis
DGGE analysis was performed using a Dcode system (Bio-Rad, Hercules, CA, USA) [13,17]. The bacterial community profiles were generated on 8% polyacrylamide gels with a gradient denaturant of 40% - 60%. Electrophoresis was run at 60˚C and 110 V overnight for 12 h. The gels were soaked for 30 min in SYBR Green I nucleic acid gel stain (1:10,000 dilution, FMC Bioproducts, Rockland, ME, USA), then photographed on a UV trans-illumination table with a Hewlett Packard Scanjet 5370C. The DGGE patterns were determined using the Labworks software (Labworks TM software version 4.0.
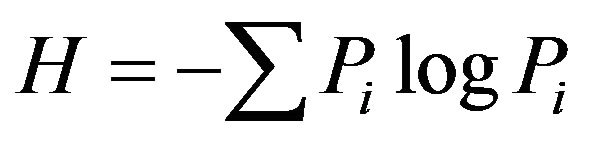
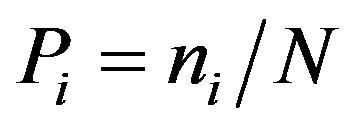
UVP, UK). Soil bacterial diversity index, i.e., Shannon index H, was calculated based on band intensity on the gel tracks.
 (1)
(1)
 (2)
(2)
where ni is the height of the peak and N the sum of all peak heights in the densitometric curve [13].
2.5. 16S rRNA Gene Cloning and Sequencing
The PCR products of bacterial communities from the UG79 and FG soils were also cloned into pGEM-T easy vector (Promega) following the manufacturers’ procedure. Ligations were transformed into Escherichia coli DH5α supercompetent cells. White colonies were screened directly for inserts and plasmid DNAs were isolated from randomly selected clones and screened for inserts of the expected sizes. Finally, 55 and 56 clones were at last randomly selected and sequenced from UG79 and FG soils, respectively. The plasmid DNAs were sequenced using primers T7 and SP6 on an ABI PRISM 3700 DNA analyzer (ABI Biosystems, Inc.).
2.6. Statistical Analysis and Phylogenetic Analysis
Least Significant Difference (LSD) tests were performed to compare the differences in microbial biomass C and N, microbial quotient as well as bacterial diversity between the UG79 and FG sites at P < 0.05. Principal components analysis (PCA) was used to separate the DGGE patterns of soil bacterial communities between the two sites. All LSD tests and PCA analyses were performed using SPSS 12.0 software (SPSS Inc., USA).
The sequences from the two sites were compared to a current database of genetic sequences (GenBank) with the Blast (basic local alignment search tool) program of the Ribosomal Database Project to determine their approximate phylogenetic affiliation. Sequence assembly and manual refinement of alignments were carried out using the multiple-alignment algorithm as implemented in CLUSTALX 1.81. Phylogenetic analysis was carried out using Neighbor joining (NJ) method with Jukes-Cantor model in the PHYLIP 3.5 package. Nodal robustness on the NJ tree was estimated by the nonparametric bootstrap (1000 replicates). The clones were clustered into operational taxonomic units (OTUs) at a level of sequence similarity of >97%. Finally, collector’s curves or species abundance curves were constructed to compare bacterial diversities between the two sites.
The nucleotide sequences of clone libraries had been deposited in the Genbank Data Library under accession numbers of DQ414821 to DQ414826, DQ414832 to DQ414844 and DQ973190 to DQ973281.
3. Results
3.1. Soil Microbial Biomass
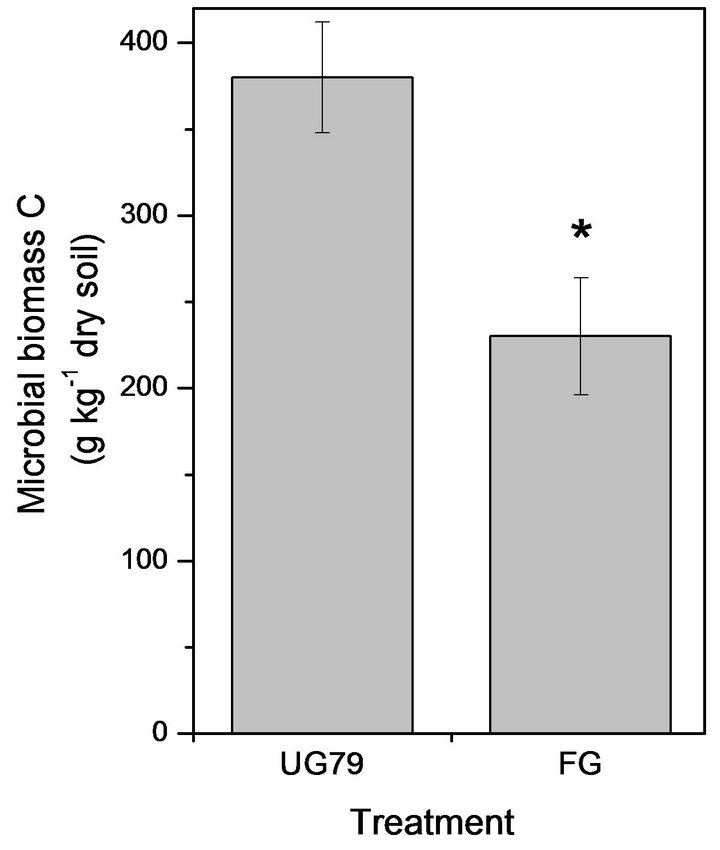
The UG79 soil had significantly higher microbial biomass C (Figure 1(a)) and N (Figure 1(b)) than the FG site. However, there were no significant differences in microbial quotient, i.e., the ratio of microbial biomass C to soil organic C between the two sites (Figure 1(c)).
3.2. PCR-DGGE Analysis of Soil Bacterial Communities
The DGGE patterns of soil bacterial communities from each plot were highly reproducible. Although a few dominant bacteria were observed in the both soils, some smears occurred in the DGGE patterns, which could be due to large amounts of different bacterial species present in the soils. Given that each band of the DGGE pattern represented one unique ribotype, there were similar and numbers in the UG79 (36 ± 2) and FG (34 ± 2.1) soils. The results of PCA analysis indicated that the UG79 site was clearly separated from the FG site (Figure 2). However, there were no significant differences in diversity of the dominating members of the bacterial communities in the UG79 (1.88 ± 0.08) and FG (2.02 ± 0.14) soils.
3.3. Soil Bacterial Clone Library Analyses
Prior to phylogenetic analysis, two clone libraries were identified chimeras which showed not only typical bellshaped histograms from the CHECK-CHIMERA program but also low percentages of matching with sequences in the database. The UG79 and FG clone libraries contained 55 and 56 sequences, respectively. Based on comparison of the two clone libraries, we found that YC53 from the UG79 soil and LW32 from the FG soil were identical based on BLAST analysis (Figure 3).
Table 1 lists the phylogenetic relationships of all clone sequences from the two sites. Many sequences belonged to characterized groups such as groups of Proteobacteria and Actinomycetes, while some sequences fell into recently recognized groups such as groups of Acidobacteria, Firmicutes and Gemmatimonadetes. Soil bacterial diversity did not differ between the two sites based on the collector’s curves (data not shown), consistent with the DGGE results. However, the groups of Proteobacteria, Acidobacteria and Firmicutes showed large differences between the two sites (Table 1). For example, β- Proteobacteria and Firmicutes groups only occurred in the FG soil and γ-Proteobacteria only occurred in the UG79 soil.
 (a)
(a) (b)
(b)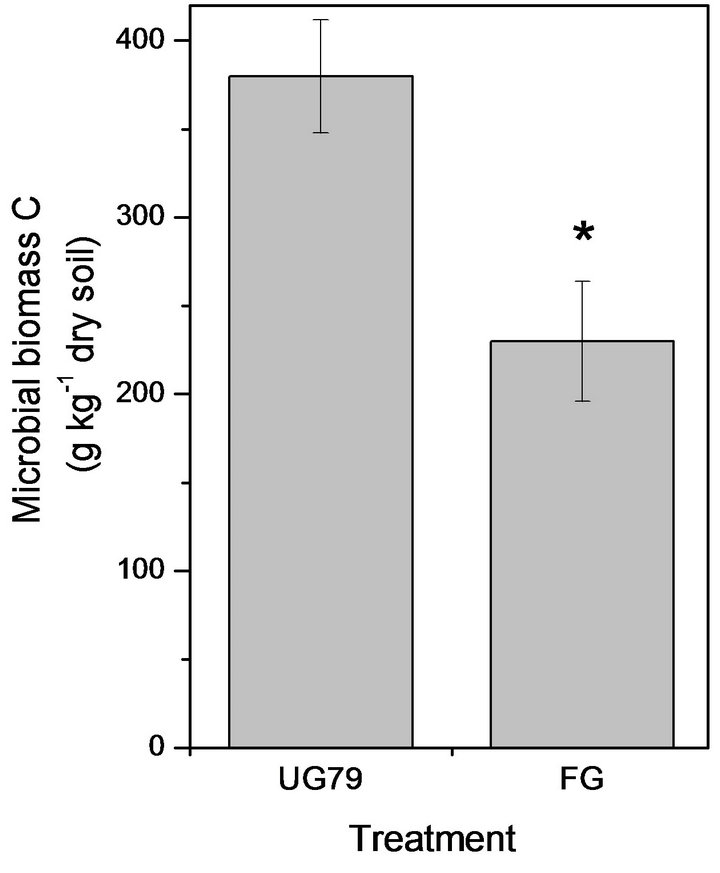 (c)
(c)
Figure 1. Soil microbial biomass C (a) and N (b) as well as microbial quotient (c), i.e., the ratio of microbial biomass C to soil organic C at the UG79 site fenced since 1979 and the FG site subjected to continually grazing all along. *indicates significant differences at P < 0.05.

Figure 2. Principal components analysis (PCA) of soil bacterial DGGE patterns from the UG79 site fenced since 1979 and the FG site subjected to continually grazing all along.
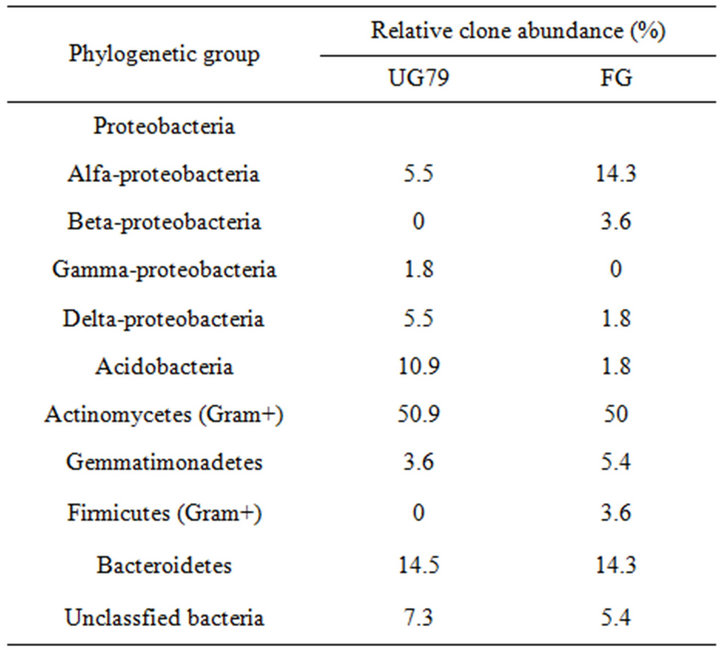
Table 1. Relative abundance of soil bacterial clones from the UG79 site fenced since 1979 and the FG site subjected to continually grazing all along.
The results of phylogenetic analysis of 111 sequences are shown in Figure 3. Seven individual clones were not related to cultured or uncultured representatives of the sequence databases and were considered novel groups. Cluster analysis of clone sequences revealed six major clusters with numerous diverse groups. Clones that exhibited >97% sequences similarity were clustered on the trees. In all 11 clusters containing two or three sequences with >97% sequence homology were observed, the UG79 and FG soils contained 8 and 7 clusters, respectively.
Among the all clone sequences, the largest major group was the Actinomycetes (50.9% and 50%, respectively). Four clones (YC49, YC52, LW45 and LW48) of
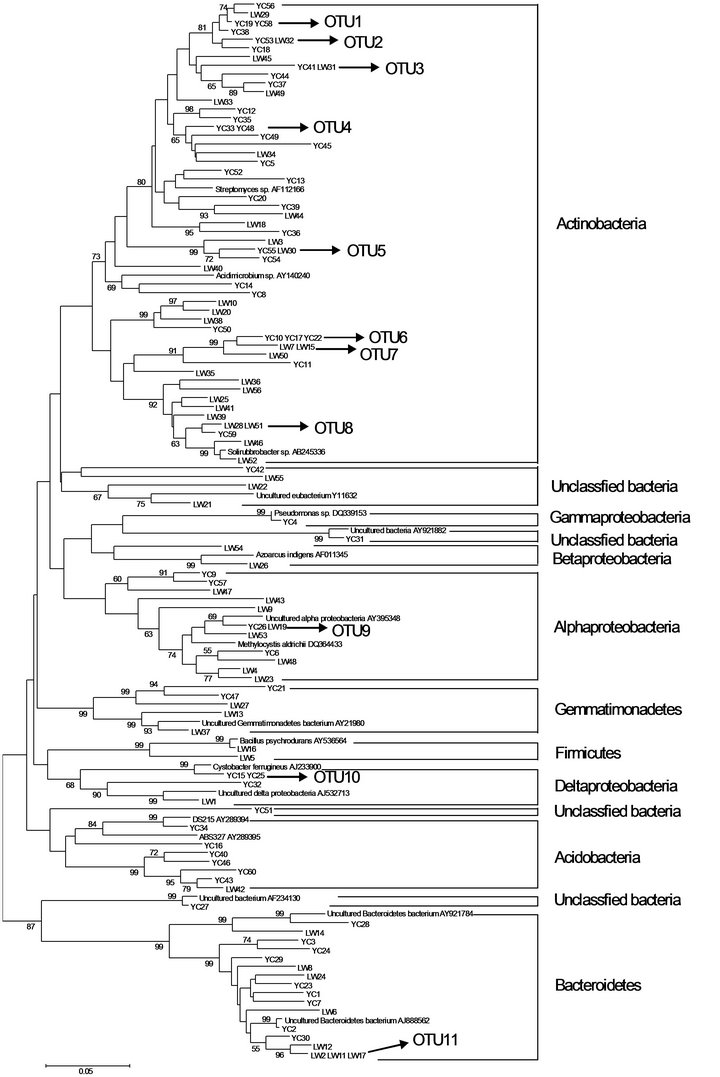
Figure 3. Neighbor-joining tree showing relationship of soil bacterial communities from the UG79 (YC) site fenced since 1979 and the FG (LW) site subjected to continually grazing all along, based on analysis of 111 clone sequences of aligned 16S rRNA sequences. Clones exhibiting >97% sequence similarity are included in numbered clusters. The scale bar indicates an estimated change of 5%. The bootstrap values (>50%) are shown below the branches.
this group exhibited 100% similarity to the culturable bacteria Arthrobacter globiformis (X80736), Streptosporangium roseum (X89949), Amycolatopsis sp. (AF453718) and Bradyrhizobium sp. (AF230720), respectively. The Proteobacteria was the second most dominant group (12.8% and 19.7%). In this group, LW24 had a similarity of 100% to uncultured bacterium (AY218681) in the GenBank. The third major group belonged to Bacteroidetes (14.5% and 14.3%). Two clones (YC4 and LW9) in this group exhibited 99% similarity to the culturable bacteria Pseudomonas sp. (DQ339153) and Sphingomonas aquatilis (AF131295), respectively.
The group of Acidobacteria is a recently recognized bacterial division with only several cultivated representatives; the majority of sequences in this division come from environmental clones. Phylogenetic analysis indicated that bacterial YC16, YC34 and YC43 fell into the representative subdivision (Figure 3).
4. Discussion
4.1. Soil Microbial Biomass
In this study, the heavily grazing site caused a decrease in soil organic C and N, which was consistent with previous studies in this region [2,13]. Compared with soil organic C, labile organic C such as microbial biomass was more sensitive to changes in management practices [18]. The heavily grazing significantly decreased soil microbial biomass C and N compared with the ungrazed site (Figure 1). This might be associated with larger amounts of the aboveground plant biomass at the nongrazed site, as plants provided available C for microbial communities via root exudates and litter decomposition [19]. Recently, Klumpp et al. [6] reported that grazing triggered soil C losses through changing plant communities and biomass and subsequently increasing decomposition of soil organic C. In this region, Cui et al. [20] reported that heavily grazing removed plant biomass by 67% relative to the UG79 site, which could contribute to lower soil microbial C at the FG site. However, microbial quotient did not significantly differ between the two sites, indicating a similar efficiency in conversion of organic C into microbial C [21].
4.2. DGGE Patterns and Clone Library Analysis
Soil bacterial communities have widely been assessed using methods of DGGE and clone library [5,11,13,17]. Studies have shown that the results obtained from DGGE are consistent with those from clone libraries and this finding was also confirmed in this study.
Our results showed that there was a clear separation between the non-grazed and grazed sites, which was in contrast to those reported by McCaig et al. [11]. Clegg [5]
found that grazing affected community structure of specific groups of microorganisms compared with the nongrazed site. Klumpp et al. [6] reported that the grazed treatment led to a proliferation of Gram(+) bacteria rather than Gram(–) bacteria. Although the results from clone libraries did not found an obvious difference in the group of Actinomycetes with high G + C content, the grazed site had an obvious increase in the group of Firmicutes with low G + C content. Among the clone libraries, β-proteobacteria were only detected at the FG site, while γ-proteobacteria were only detected at the UG79 site (Table 1). Actually, soil bacterial communities were greatly affected by many factors such as pH [22], soil organic C and N [5] and aboveground plant communities [23]. Jangid et al. [12] found that during restoration of grassland, two similar grasslands with different soil pH, organic C and N contents had significantly different bacterial communities. On the other hand, previously we found that soil bacterial diversity reached peak at the moderate grazing intensity sites, but decreased with increasing grazing intensities [13]. In light of this statement, there was similar bacterial diversity between the long-term exclusion and non-grazed sites, which supplemented our results.
The results of phylogenetic analysis of all clone sequences indicated that soil bacterial communities were dominated by the groups of Actinomycetes, Proteobacteria and Bacteroidetes. The group of Actinomycetes was also found to be dominant in a grassland soil of England [24]. However, in the Inner Mongolians steppe, the group of Actinomycetes accounted for a fraction of bacterial communities in this study or using plate count [25]. Barns et al. [26] reported that the group of Acidobacteria was as environmentally widespread and ecologically important as Proteobacteria, and the ratio of ribotype numbers of Proteobacteria and Acidobacteria to total clone numbers might reflect the nutrient status of soil [27,28]. In this study, this ratio at the UG79 (10.9) site was higher than that at the FG (1.8) site, which was consistent with the higher soil organic C at the FG site (Table 1).
5. Conclusion
Long-term exclusion of grazing increased soil microbial biomass and changed bacterial community structure compared with the grazed site using the methods of DGGE and clone library. Phylogenetic analysis of the clone libraries from the two sites indicated that the grassland soils were dominated by the groups of Actinomycetes, Bacteroidetes and Proteobacteria.
6. Acknowledgements
This work is financially supported by the National Science Foundation of China (No. 90411001).
REFERENCES
- D. A. Wardle, R. D. Bardgett, J. N. Klironomos, H. Setälä , W. H. van der Putten and D. H. Wall, “Ecological Linkages between Aboveground and Belowground Biota,” Science, Vol. 304, No. 5677, 2004, pp. 1629-1633. doi:10.1126/science.1094875
- M. Steffens, A. Koelbl, K. U. Totsche and I. KoegelKnabner, “Grazing Effects on Soil Chemical and Physical Properties in a Sem-Arid Steppe of Inner Mongolia (P.R. China),” Geoderma, Vol. 143, No. 1-2, 2008, pp. 63-72. doi:10.1016/j.geoderma.2007.09.004
- Z. Z. Chen and S. P. Wang, “Chinese Typical Grassland Ecosystem,” Science Press, Beijing, 2000.
- D. A. Wardle, R. D. Bardgett, L. R. Walker, D. A. Peltzer and A. Lagerstrom, “The Response of Plant Diversity to Ecosystem Retrogression: Evidence from Contrasting LongTerm Chronosequences,” Oikos, Vol. 117, No. 1, 2008, pp. 93-103. doi:10.1111/j.2007.0030-1299.16130.x
- C. D. Clegg, “Impact of Cattle Grazing and Inorganic Fertilizer Additions to Managed Grasslands on the Microbial Community Composition of Soils,” Applied Soil Ecology, Vol. 31, No. 1-2, 2006, pp. 73-82. doi:10.1016/j.apsoil.2005.04.003
- K. Klumpp, S. Fontaine, E. Attard, X. L. Roux, G. Gleixner and J. Soussana, “Grazing Triggers Soil Carbon Loss by Altering Plant Roots and Their Control on Soil Microbial Community,” Journal of Eology, Vol. 97, No. 5, 2009, pp. 876-885. doi:10.1111/j.1365-2745.2009.01549.x
- C. H. Wang, S. Q. Wan, X. R. Xing, L. Zhang and X. G. Han, “Temperature and Soil Moisture Interactively Affected Soil Net N Mineralization in Temperate Grassland in Northern China,” Soil Biology and Biochemistry, Vol. 38, No. 5, 2006, pp. 1101-1110. doi:10.1016/j.soilbio.2005.09.009
- Y. Q. Xu, L. H. Li, Q. B. Wang, Q. S. Chen and W. X. Cheng, “The Pattern between Nitrogen Mineralization and Grazing Intensities in an Inner Mongolian Typical Steppe,” Plant and Soil, Vol. 300, No. 1-2, 2007, pp. 289-300. doi:10.1007/s11104-007-9416-0
- R. D. Bardgett, W. D. Bowman, R. Kaufmann and S. K. Schmidt, “A Temporal Approach to Linking Aboveground and Belowground Ecology,” Trends in Ecology and Evolution, Vol. 20, No. 11, 2005, pp. 634-641. doi:10.1016/j.tree.2005.08.005
- M. Sankaran and D. J. Augustine, “Large Hervivores Suppress Decomposer Abundance in a Semiarid Grazing Ecosystems,” Ecology, Vol. 85, No. 4, 2004, pp. 1052- 1061. doi:10.1890/03-0354
- A. E. McCaig, L. A. Glover and J. I. Prosser, “Numerical Analysis of Grassland Bacterial Community Structure under Different Land Management Regimens by Using 16S Ribosomal DNA Sequences Data and Denaturing Gradient Gel Eletrophoresis Banding Patterns,” Applied and Environmental Microbiology, Vol. 67, No. 10, 2001, pp. 4554-4559. doi:10.1128/AEM.67.10.4554-4559.2001
- K. Jangid, M. A. Williams, A. J. Franzluebbers, J. S. Sanderlin, J. H. Reeves, M. B. Jenkins, D. M. Endale, D. C. Coleman and W. B. Whitman, “Relative Impacts of LandUse, Management Intensity and Fertilization upon Soil Microbial Community Structure in Agricultural Systems,” Soil Biology and Biochemistry, Vol. 40, No. 11, 2008, pp. 2843-2853. doi:10.1016/j.soilbio.2008.07.030
- X. Q. Zhou, J. Z. Wang, Y. B. Hao and Y. F. Wang, “Inter- mediate Grazing Intensities by Sheep Increase Soil Bacterial Diversities in an Inner Mongolian Steppe,” Biology and Fertility of Soils, Vol. 46, No. 8, 2010, pp. 817- 824. doi:10.1007/s00374-010-0487-3
- Y. F. Bai, X. G. Han, J. G. Wu, Z. Z. Chen and L. H. Li, “Ecosystem Stability and Compensatory Effects in the Inner Mongolia Grassland,” Nature, Vol. 431, No. 9, 2004, pp. 181-184. doi:10.1038/nature02850
- X. Q. Zhou, Y. F. Wang and Y. B. Hao, “Short-Term Rather Than Long-Term Exclusion of Grazing Increases Soil Bacterial Diversity in an Inner Mongolian Steppe,” Acta Ecologica Sinica, Vol. 32, No. 4, 2012, pp. 180-183. doi:10.1016/j.chnaes.2012.04.009
- X. Q. Zhou, X. Liu, Y. C. Rui, C. R. Chen, H. W. Wu and Z. H. Xu, “Symbiotic Nitrogen Fixation and Soil N Availability under Legume Crops in an Arid Environment,” Journal of Soils and Sediments, Vol. 11, No. 5, 2011, pp. 762-770. doi:10.1007/s11368-011-0353-4
- G. Muyzer, E. C. de Waal and A. G. Uitterlinden, “Profiling of Complex Microbial Populations by Denaturing Gradient Gel Electrophoresis Analysis of Polymerase Chain Reaction-Amplified Genes Coding for 16S rRNA,” Applied and Envrionmental Microbiology, Vol. 59, No. 3, 1993, pp. 695-700.
- X. Q. Zhou, C. R. Chen, H. W. Wu and Z. H. Xu, “Dynamics of Soil Extractable Carbon and Nitrogen under Different Cover Crop Residues,” Journal of Soils and Sediments, Vol. 12, No. 6, 2012, pp. 844-853. doi:10.1007/s11368-012-0515-z
- G. A. Kowalchuk, D. S. Buma, W. de Boer, P. G. L. Klink- hamer and J. A. van Veen, “Effects of Above-Ground Plant Species Composition and Diversity on the Diversity of Soil-Borne Microorganisms,” Antonie van Leeuwenhoek, Vol. 81, No. 1-4, 2002, pp. 509-520. doi:10.1023/A:1020565523615
- X. Y. Cui, Y. F. Wang, H. S. Niu, J. Wu, S. P. Wang, E. Schnug, J. Rogasik, J. Fleckenstein and Y. H. Tang, “Effect of Long-Term Grazing on Soil Organic Carbon Content in Semiarid Steppes in Inner Mongolia,” Ecological Research, Vol. 20, No. 5, 2005, pp. 519-527. doi:10.1007/s11284-005-0063-8
- D. A. Wardle, “A Comparative Assessment of Factors Which Influence Microbial Biomass Carbon and Nitrogen Levels in Soil,” Biological Reviews, Vol. 67, No. 3, 1992, pp. 321-358. doi:10.1111/j.1469-185X.1992.tb00728.x
- N. Fierer, M. S. Strickland, D. Liptzin, M. A. Bradford and C. C. Cleveland, “Global Patterns in Belowground Communities,” Ecology Letters, Vol. 12, No. 11, 2009, pp. 1238-1249. doi:10.1111/j.1461-0248.2009.01360.x
- X. Q. Zhou, H. W. Wu, E. Koetz, Z. H. Xu and C. R. Chen, “Soil Labile Carbon and Nitrogen Pools and Microbial Metabolic Diversity under Winter Crops in an Arid Environment,” Applied Soil Ecology, Vol. 53, No. 2, 2012, pp. 49-55. doi:10.1016/j.apsoil.2011.11.002
- S. J. Grayston, C. D. Campbell, R. D. Bardgett, J. L. Maw- dsley, C. D. Clegg, K. Ritz, B. S. Griffiths, J. S. Rodwell, S. J. Edwards, W. J. Davies, D. J. Elston and P. Millard, “Assessing Shifts in Microbial Community Structure across a Range of Grasslands of Differing Management Intensity Using CLPP, PLFA and Community DNA Techniques,” Applied Soil Ecology, Vol. 25, No. 1, 2004, pp. 63-84. doi:10.1016/S0929-1393(03)00098-2
- L. P. Liu and Y. N. Liao, “Biological Charateristics and Biodiversity of the Soil Microorganisms in Leymus Chinensis Steppe and Stipa Grandis Steppe under Different Grazing Intensities,” In: L. P. Liu and Y. N. Liao, Eds., Inner Mongolia Grassland Ecosystem Research Station Research on Grassland Ecosystem, Scientific Press, Beijing, pp. 13-22.
- S. M. Barns, S. L. Takala and C. R. Kuske, “Wide Distribution and Diversity of Members of the Bacterial Kingdom Acdobacterium in the Environment,” Applied and Environmental Microbiology, Vol. 65, No. 4, 1999, pp. 1731-1737.
- E. Smit, P. Leeflang, S. Gommans, J. van den Broek, S. van Mil and K. Wernars, “Diversity and Seasonal Fluctuations of the Dominant Members of the Bacterial Soil Community in a Wheat Field as Determined by Cultivation and Molecular Methods,” Applied and Environmental Microbiology, Vol. 67, No. 5, 2001, pp. 2284- 2291. doi:10.1128/AEM.67.5.2284-2291.2001
- H. Y. Sun, S. P. Deng and W. R. Raun, “Bacterial Community Structure and Diversity in a Century-Old ManureTreated Agroecosystem,” Applied and Environmental Microbiology, Vol. 70, No. 2004, pp. 5868-5874. doi:10.1128/AEM.70.10.5868-5874.2004
NOTES
*Corresponding authors.