Open Journal of Soil Science
Vol.1 No.2(2011), Article ID:7597,4 pages DOI:10.4236/ojss.2011.12006
Effect of Applied Phosphorus on the Yield and Nutrient Uptake by Soybean Cultivars on Acidic Hill Soil
![]()
1Centre for Natural Resources Management, V.P.O Tarore, District Jammu, Jammu and Kashmir, India; 2Research Complex for Northeast Hill Region of India, Lembuchhera, Agartala, India; 3S.K. University of Agricultural Sciences & Technology, Jammu, India.
Email: *ucsharma2@rediffmail.com
Received August 5th, 2011; revised August 20th, 2011; accepted August 24th, 2011.
Keywords: Applied Phosphorus, Soybean Cultivars, Yield, Nutrient Uptake, Acidic Hill Soil
ABSTRACT
In a three years experiment, conducted on acidic soil, four varieties of soybean [Glycine max (L) Merril] were tested to see their performance under different regimes of applied Phosphorus. The highest number of pods was given by the cultivar Bragg, followed by Punjab-1, Durga and JS-89-21. A similar trend was observed in the number of filled pods. On an average, the cultivar, Punjab-1, gave the maximum harvest index, followed closely by Bragg. Both the cultivars, Durga and JS-89-21, had lower harvest index. The application of P fertilizer significantly increased the harvest index up to 60 kg·P·ha–1. The Highest yield of grains was given by the variety ‘Bragg’ (1630 kg·ha–1), followed by Punjab-1, JS-89-21 and Durga, which gave the yields of 1510, 1470 and 880 kg·ha–1, respectively. Highest N, P and K removal was found by the cultivar Bragg, followed by Punjab-1, JS-89-21 and Durga cultivars. The uptake of nutrients was significantly related to the total biomass produced by a cultivar (r = 0.8125), showing a yield predictability of 66.0%. The increase in uptake of N, P and K, respectively, with the application of 60 kg·P·ha–1 over no P was; 245.3, 159.4 and 158.3% in case of Bragg, 101.5%, 73.8% and 44.6% in case of Durga, 182.2%, 70.6% and 63.8% in case of JS-89-21 and 164.7%, 80.0% and 97.4% in case of Punjab-1. A significant increase in soil available P was found in the plots where it was applied at 60 kg·ha–1 continuously for three years.
1. Introduction
Soybean is among the premier oil seed crops in the World and its cultivation has become popular in India too. However, in the absence of a proper crop variety and fertilizer inputs, the yields are low in acidic soils. The applied P gets fixed immediately after application in acidic soils and the availability to the crop is poor. Genotypic differences for better growth under acidic conditions have been demonstrated because genetic effects modifying tolerance to acidity are heritable [1,2]. The soybean has been reported to P fertilizers differently in acidic soils depending on the pH, soil fertility and the nature of genotype [3,4,5,6]. It has been reported that imbalanced and inadequate nutrition results in poor yields of soybean [7]. The investigation was undertaken to study the performance of different soybean cultivars with different levels of applied P fertilizer. Due to fixation of applied P in acidic soils, higher dose of the nutrient are required to satisfy the fixation needs and the requirement of the crop. The acid soils are generally poor in fertility and require optimum dose of nutrients for higher productivity.
2. Materials and Methods
Field experiments were conducted for three years on a sandy loam soil to study the effect applied P on four cultivars of soybean. The soybean cultivars were Bragg, Durga, JS-89-21 and Pujab-1. The dose applied P was 0. 30 and 60 kg·P·ha–1. So, there were twelve treatments which were replicated four time in a split plot design., with soybean cultivars in main plots and P dose in subplots. The sowing was done at an inter and intra-row spacing of 45 cm and 20 cm. The plot size was 3 m × 4 m. A uniform dose of 80 kg·N and 60 kg·K·ha–1 was applied in all the plots. Half of the dose of N, full dose of K and P was applied before sowing of soybean while rest half of N was applied 35 days after sowing. Plant height was recorded at complete podding stage and other parameters like total number of pods, filled pods and yield were taken at maturity. The grain and plant samples were taken at maturity and analysed as per methods suggested by [8]. The soil samples were collected before the start and after the completion of the study. The soil analysis was done by the methods outlined by [9]. The harvest index was calculated by dividing dry weight of rains with total biomass produced by the plants. The plant samples were dried in the oven at 60˚C plus/minus 5˚C.
3. Results and Discussion
3.1. Yield Attributes
The data on different yield attributes have been presented in Table 1. Significantly highest pod number per plant was given by the application of 60 kg·P·ha–1 in the cultivar Bragg and Punjab-1, however, in Durga and JS-89-21 cultivars, the significant increase in pod number per plant was found with up to the application of 30 kg·P·ha–1 (Table 1). The highest number of pods was given by the cultivar Bragg, followed by Punjab-1, Durga and JS-89- 21. A similar trend was observed in the number of filled pods. The results corroborate the findings of [1] and [10]. On an average, the cultivar, Punjab-1, gave the maximum harvest index, followed closely by Bragg. Both the cultivars, Durga and JS-89-21, had lower harvest index, the former having the lowest. The application of P fertilizer significantly increased the harvest index up to 60 kg·P·ha–1. This was possibly due to the beneficial effect of P on root growth and health of the plants, leading to higher grain/plant biomass ratio. The application of P also increased the plant height in all the cultivars, but this
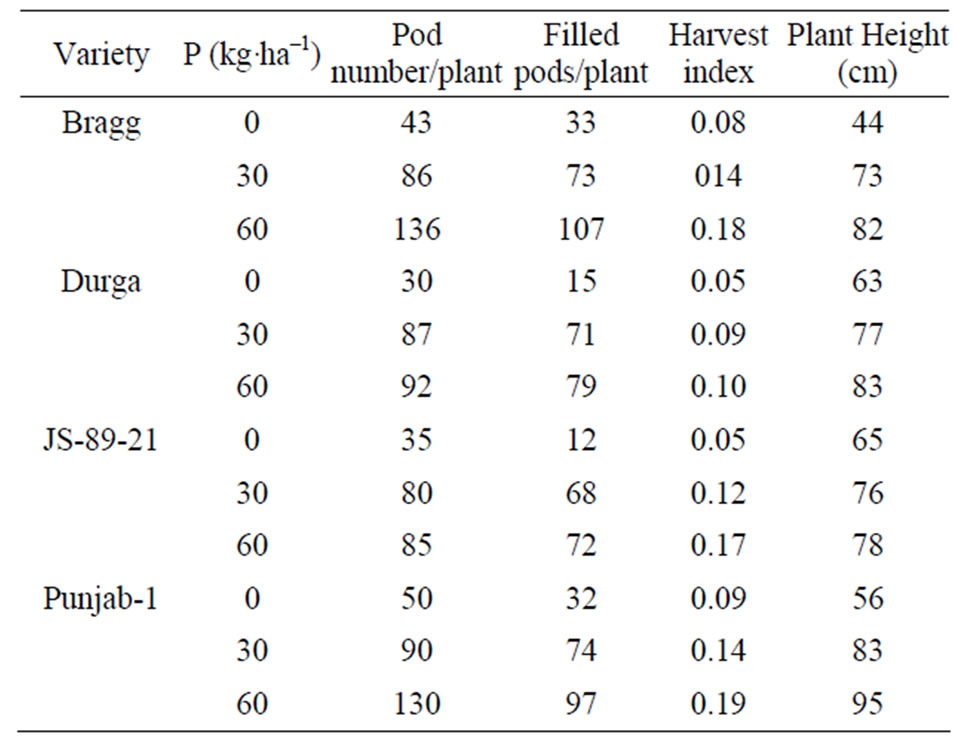
Table 1. Effect of P application on the yield attributes of soybean varieties.
encouraged lodging of some plants in the cultivar, Punjab-1.
3.2. Grain Yield
The grain yield of soybean increased up to the app.lication of 60 kg·P·ha–1 in all the cultivars (Table 2). The increase in the yield over control (no P) was 302.4%, 134.6%, 272.1% and 196.0% in Bragg, Durga, JS-89-21 and Punjab-1 cultivars, respectively, with the application of 60 kg·P·ha–1. The cultivar Punjab-1 gave the highest grain yield among different cultivars when no fertilizer P was applied. The accumulation of dry biomass by different cultivars showed variable trend. However, the response to applied P was found only up to the application of 30 kg·P·ha–1. It may be attributed to the fact that higher dose of P helped in increase in the number of filled pods and higher grain/biomass ratio. The main reason for higher grain yield was the higher number of filled pods. The harvest index was found significantly related (r = 0.756) to the harvest index of a cultivar. Similar results were reported by [11] and [12].
3.3. Nutrient Uptake
Highest N, P and K removal was found by the cultivar Bragg, followed by Punjab-1, JS-89-21 and Durga cultivars. The uptake of nutrients was significantly related to the total biomass produced by a cultivar (r = 0.8125), showing a yield predictability of 66.0%. The increase in uptake of N, P and K, respectively, with the application of 60 kg·P·ha–1 over no P was; 245.3%, 159.4% and 158.3% in case of Bragg, 101.5%, 73.8% and 44.6% in case of Durga, 182.2%, 70.6% and 63.8% in case of JS-89-21 and 164.7%, 80.0% and 97.4% in case of Punjab-1. This showed that the application of P
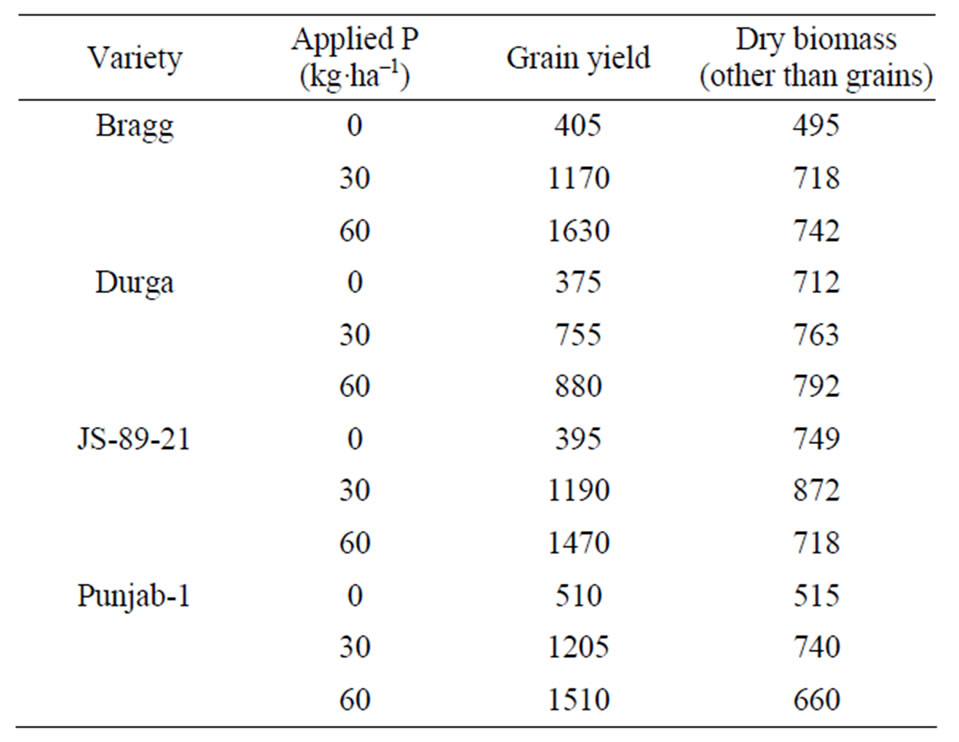
Table 2. Effect of applied P on the grain yield and plant dry biomass (other than grains) (in kg·ha–1).
encouraged the uptake N to be more efficient in the removal of nutrients which and K as well, besides P. The cultivar Bragg was found helped it recording highest yield over other cultivars studied. On an average, the combined removal by different cultivars of N was 34.9%, 77.6% and 95.3% of the applied N; of P was 0%, 10.0% and 7.5%; of K was 33.8%, 53.3% and 63.0% at 0. 30 and 60 kg .The results are in agreement with those obtained by [13] The nutrient removal was found to be significantly related to the biomass production and vice versa (r = 0.829). ha–1 of applied P. The application of P to soybean improved the efficiency of cultivars in accumulating more N and K. On an average, the removal of P was only 7.9% of the applied P and the rest got fixed with iron and aluminium in the acid soils. The corresponding average values of removal of N and K were 69.2% and 50.0% of the applied N and K, respectively.
3.4. Soil Properties
The mean values of analysis of soil samples, collected after the study showed no significant change in the soil pH over its initial value (Table 4). The available N and
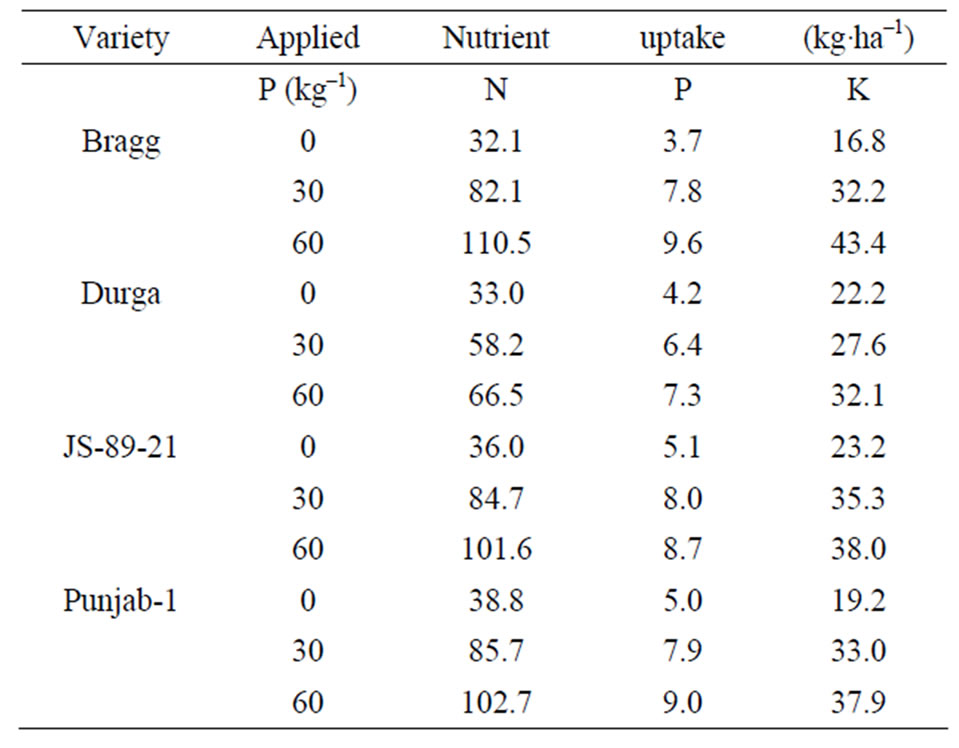
Table 3. Effect of applied P on the yield and N, P and K uptake of soybean.
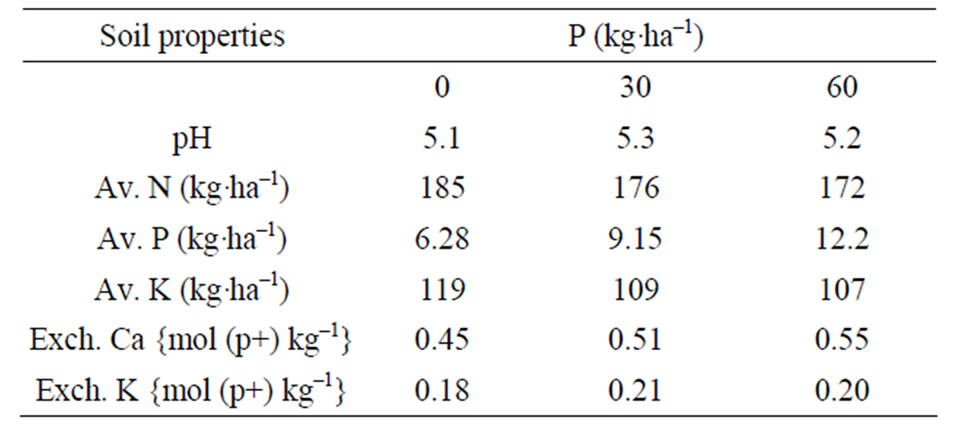
Table 4. Effect of applied P on the soil properties (mean values).
significantly higher at zero level of applied P compared to when P was applied at 30 and 60 kg·ha–1. This may be attributed to the reason that removal of N and K was lower at zero level of applied P. However, available P increased significantly with successive levels of applied P registering an increase of 45.7%and 94.2% with 30 and 60 kg·ha–1 of applied P, over zero level of P. A slight increase in exchangeable Ca and K was found with increase in the dose of applied P.
4. Conclusions
Since a heavy amount of applied Phosphorus gets fixed in acidic soils just after its application, a higher dose of P, than what is to be removed by the crop, needs to be applied to satisfy the requirement of exchange sites in the soil, to render it to become more available to the crop plant for optimum productivity. Soybean is a leguminous crop and can fix atmospheric nitrogen, which can partially fulfil its need for N. To obtain higher productivity of soybean in acidic soil, balanced use of nutrients is absolutely necessary.
REFERENCES
- W. H. Armiger, C. D. Foy, A. L. Fleming and B. E. Caldwell, “ Differential Tolerance of Soybean Varieties to Acid Soils High in Exchangeable Aluminium,” Agronomy Journal, Vol. 60, No. 1, 1968, pp. 67-70. doi:10.2134/agronj1968.00021962006000010022x
- D. A. Reid, G. D. Jones, W. H. Armiger, C. D. Foy, E. J. Koch and T. N. Starling, “Differential Aluminium Tolerance of Winter Wheat Varieties Selection in Associated Green-House and Field Studies,” Agronomy Journal, Vol. 61, No. 2, 1969, pp. 218-222. doi:10.2134/agronj1969.00021962006100020014x
- U. C. Sharma and B. Singh, “Effect of Applied P on the Yield and Incidence of Pod Blight of Soybean in Nagaland,” Journal of Hill Research, Vol. 4, 1991, pp. 94-96.
- S. M. Husain and U. C. Sharma, “Performance of Soybean Cultivars in Acidic Soil of Nagaland,” Indian Journal of Hill Farming, Vol. 4, 1991, pp. 13-18.
- M. S. S. Kumari and K. U. Kumari, “Effect of Vermicompost Enriched with Rock Phosphate on the Yield and Uptake of Cowpea,” Journal of Tropical Agriculture, Vol. 40, 2002, pp. 27-30.
- A. R. Sandeep, S. Joseph and M. S. Jisha, “Yiel and Nutrient Uptake of Soybean as Influenced by Phosphate Solubilising Microorganisms,” World Journal of Agricultural Sciences, Vol. 4, 2008, pp. 835-838.
- F. G. Boswell and O. E Anderson, “Long Term Residual Fertility and Current NPK Application Effects on Soybean,” Agronomy Journal, Vol. 68, No. 2, 1976, pp. 642-645. doi:10.2134/agronj1976.00021962006800020028x
- C. S. Piper, “Soil and Plant Analysis,” International Science Publisher, Inc., New York, 1950.
- M. L. Jackson, “Soil Chemical Analysis,” Parentice Hall of India, New Delhi, 1973.
- W. D. Hanson, A. H. Probst and B. E. Caldwell, “Evaluation of a Population of Soybean Genotypes with Implications of Improving Self Pollinated Crops,” Crop Science, Vol. 7, 1967, pp. 99-103. doi:10.2135/cropsci1967.0011183X000700020003x
- R. I. Bussel and B. R. Buttery, “Soybean Harvest Index in Hill Plots,” Crop Science, Vol. 17, No. 2, 1977, pp. 966- 970.
- D. R. Johnson and D. J. Mayor, “Harvest Index of Soybean as Affected by Planting Date and Maturity rating,” Agronomy Journal, Vol. 71, No. 4, 1979, pp. 538-540. doi:10.2134/agronj1979.00021962007100040004x
- R. M. Morshed, M. M. Rahman and M. A. Rahman, “Effect of N on Seed Yield, Protein Content and Nutrient Content of Soybean,” Journal of Agriculture and Rural Development, Vol. 6, 2008, pp. 13-17.