Open Journal of Modern Hydrology
Vol.3 No.4(2013), Article ID:37790,8 pages DOI:10.4236/ojmh.2013.34023
The Influence of Land-Use on Water Quality in a Tropical Coastal Area: Case Study of the Keta Lagoon Complex, Ghana, West Africa
![]()
1Department of Marine and Fisheries Sciences, University of Ghana, Legon, Ghana; 2Department of Agriculture Engineering, Faculty of Engineering, University of Ghana, Legon, Ghana; 3Department of Geography and Geology, University of Copenhagen, Copenhagen, Denmark; 4Department of Soil Science, Faculty of Agriculture, University of Ghana, Legon, Ghana.
Email: *amlamptey@ug.edu.gh, *angela.lamptey@yahoo.com
Copyright © 2013 Angela M. Lamptey et al. This is an open access article distributed under the Creative Commons Attribution License, which permits unrestricted use, distribution, and reproduction in any medium, provided the original work is properly cited.
Received June 28th, 2013; revised July 28th, 2013; accepted August 5th, 2013
Keywords: Tropical Coastal Area; Keta Lagoon Complex; Floodplains; Water Quality Index; WHO Standards; Physico-Chemical Parameters; Ghana
ABSTRACT
The Keta Lagoon and its catchment areas in Ghana are influenced by intensive agriculture and the use of agro-chemicals. It has therefore, become necessary to assess the quality of water in the lagoon and the surrounding fresh water aquifers. In this study, a water quality index (WQI), indicating the water quality has been adopted. The WQI was determined on a basis of various physico-chemical parameters like pH, conductivity, turbidity, dissolved oxygen, calcium, magnesium, chloride, nitrates, ammonium and sodium. The index was used both for tracking changes at one site over time, and for comparisons among sites. The WQI was also employed to wells used for irrigation on farms along the Keta Sand Spit as well as that of the Keta Lagoon Complex and its surrounding floodplains, in order to ascertain the quality of water for public and livestock consumption, irrigation, recreation and other purposes. The WQI of the wells, Keta lagoon and its floodplains showed various degrees of poor water quality and therefore considered unsuitable for drinking and recreation. By WHO standards, this calls for intensive physical and chemical treatment of the water for human consumption.
1. Introduction
The rapid development of sprinkler irrigation through the shallot (Allium spp.) horticulture system on the Keta sand spit (Figure 1) of Ghana has introduced a heavy nutrient load on the soils [1] due to the application of manure and fertilizers. This is partly because the soil is naturally very poor in plant nutrients and partly due to the truncation of nutrient when crops are harvested and sold. In the past, bat droppings and rotten fish were used as manure, but today imported cow dung and poultry droppings are the main sources of organic manure used in the farmlands [1]. Cow dung is normally applied before planting, and in every growing season about 1.3 kg/m2 of cow dung is applied. Since the 1970s chemical fertilizers such as NPK have been applied by some farmers [1]. This has increased the transport of nutrients from run-offs to coastal waters including the Keta Lagoon Complex, and therefore the increased risk of eutrophication, thereby reducing the water quality of the lagoon and subsequently a decline in the fishery [2].
Formerly the people of this area were mainly fishermen and grew a few vegetables for domestic consumption and coconuts for sale. In the 1930s the coconut production collapsed because of the Cape St. Paul disease, and the rapidly increasing population compelled the people to give up the old agricultural systems and develop intensive horticulture based on vegetable production [1,3]. Typical vegetable production systems of the Keta area are shallots, pepper, okra, tomatoes, carrots, which are grown all year round based on irrigation with groundwater from small wells using the rope and bucket method [1]. This system is highly dependent on the application of organic manure and irrigation, the later due to the semiarid climate of the region [2,4].
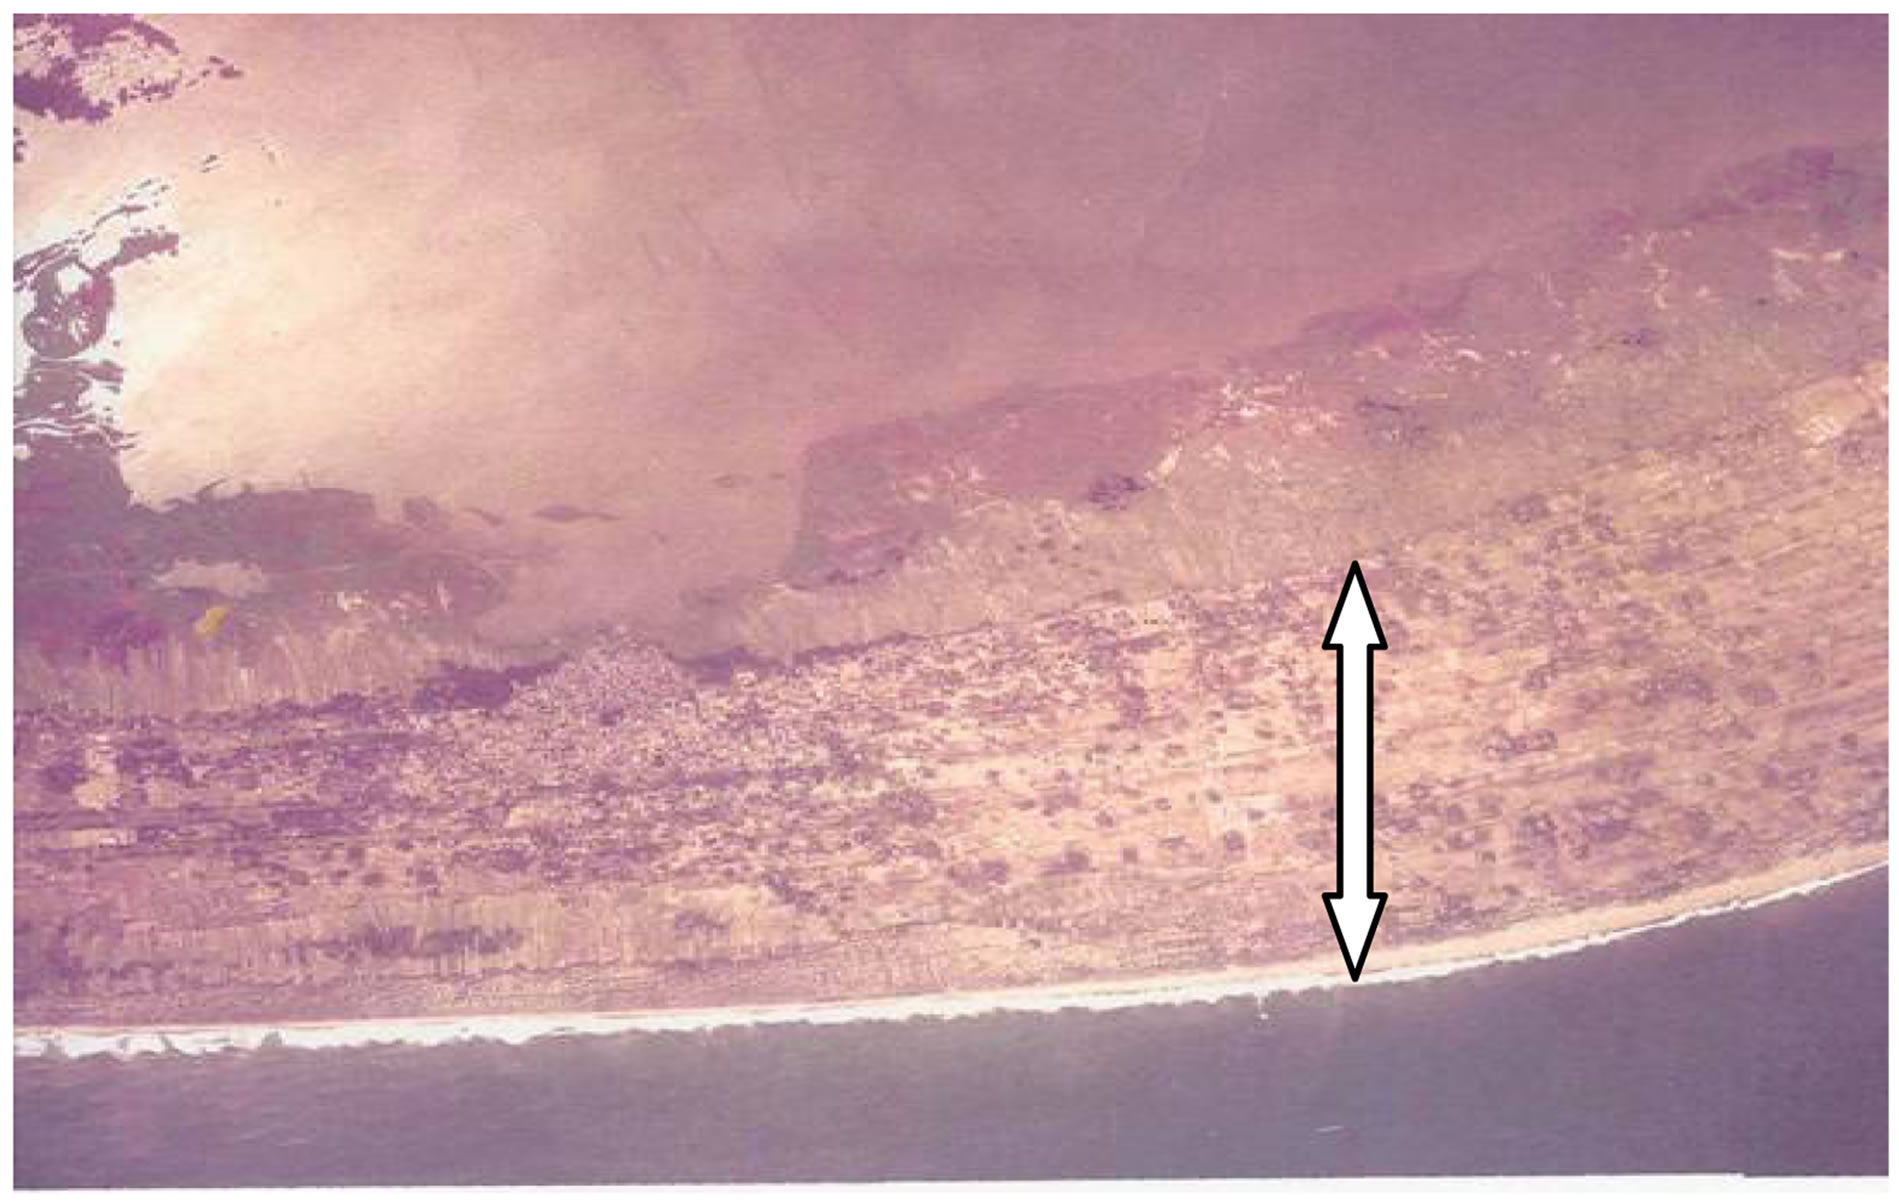
Figure 1. Satellite image of Keta Sand Spit (arrowed) (Google Maps, 2003).
The most important nutrients of concern in coastal waters are nitrates and phosphates. In excessive quantities these can cause the rapid growth of marine plants, and result in algal blooms. Sewage discharges, household and commercial waste that is carried to the sea by storm runoff, add excess nutrients to coastal waters. Detergents and fertilizers supply high quantities of nutrients to streams and rivers and ultimately the marine environment [5]. The main objectives of this study were to assess the quality of water and to develop a water quality index (WQI) of the Keta Lagoon and its surrounding floodplains as well as the surrounding fresh water aquifers (well water).
2. Materials and Methods
2.1. Site Description
Keta Lagoon (Figure 2) with co-ordinates 5˚55'N 0˚59'E lies in the far south-east of the country, near the international frontier with Togo. The lagoon is about 140 km east-northeast of the capital city of Accra, Ghana [6,7]. The lagoon is an extensive, brackish water-body situated to the east of the Volta river estuary. The site comprises the open water of the lagoon and the surrounding floodplains and mangrove swamps. Although considered to be an open lagoon, it is effectively closed for most of the year. The area of open water varies with the season, but is estimated to be over 164,000 ha, stretching for 40 km along the coast and separated from the sea by a narrow ridge. Inflow into the lagoon includes the Volta River at Anyanui [7] with an unknown discharge rates. The Keta Lagoon is part of the Volta system; 27 km long with a variable width of up to 16 km and a surface area of 28,400 ha and an average depth of 0.8 m (maximum 2 m) and an average salinity of 1.87‰ (18.7 PSU) [6,8]. The lagoon is bordered by numerous settlements and the surrounding flood-plain consists of marsh, scrub, farmland and substantial mangrove stands, which are heavily ex-
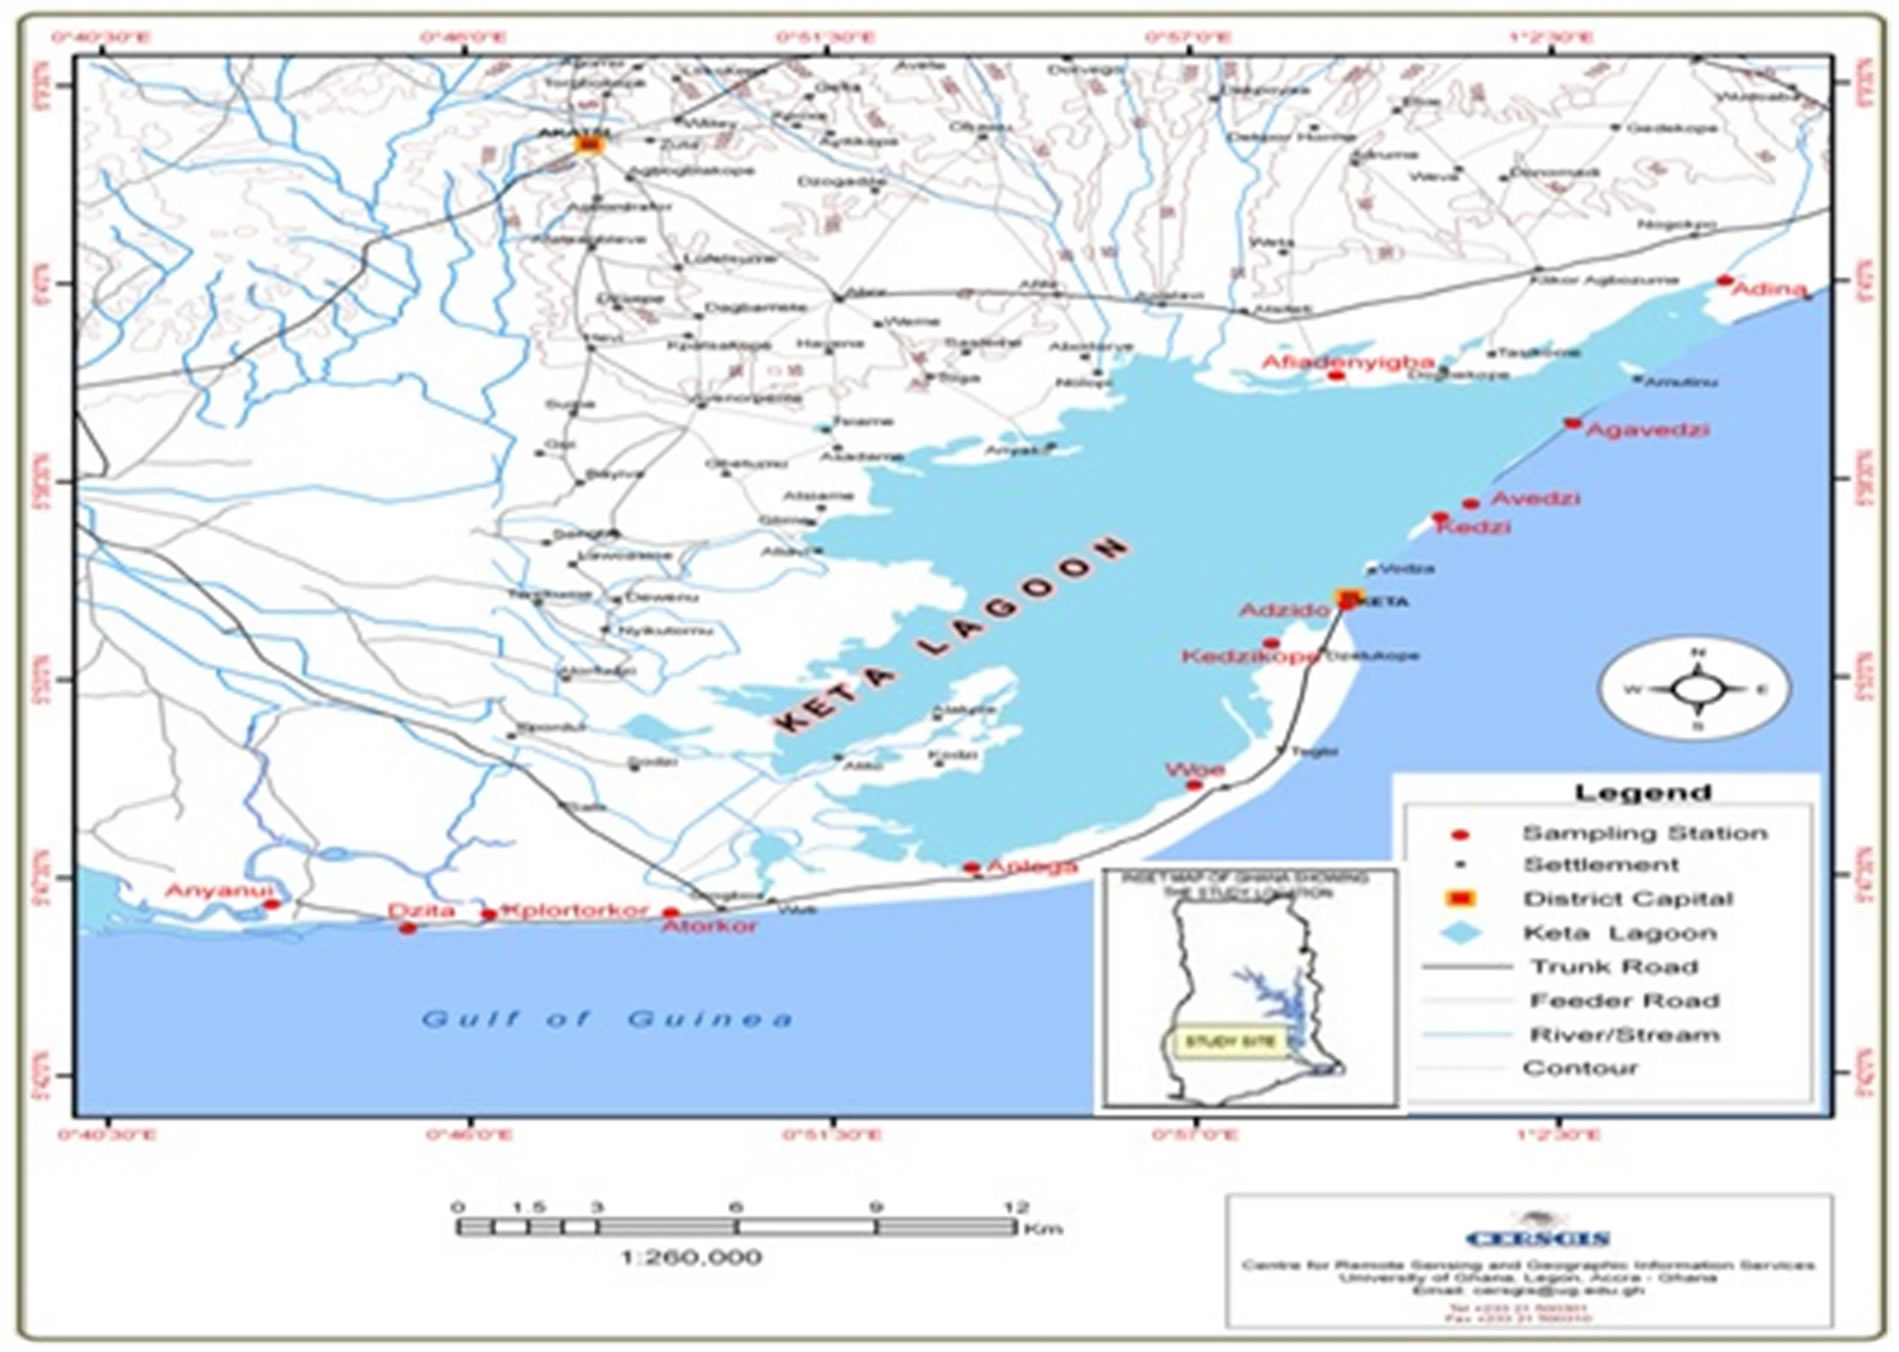
Figure 2. Map of Ghana showing the Keta Lagoon Complex and its surrounding floodplains (after CERSGIS, 2010).
ploited for fuelwood. The commonest economic activeties are vegetable farming and fishing [2].
From a geological point of view there are two main formations in the region around the Keta Lagoon. The northern half of the region is dominated by a tertiary formation of limonitic residuals, both consolidated and unconsolidated. The general appearance of the formation is reddish with widely spread ferrunginised sheets [6,9]. The rest of the region consists mainly of Pleistocene to recent formations of mud, clays and gravels. The shallow aquifers occur in the Recent Sediments consisting mainly of beach sand, gravels, silt and clay [9]. The Recent Sediments vary in thickness from 30 m to over 100 m [9].
The climate in the region is semi-arid tropical with average daily temperatures of 27˚C - 28˚C and no pronounced variation during the year. The winds on this part of coastal West Africa are generally weak and regular with predominant south-easterly winds between March and November [10]. During the Harmattan season (December-February), winds occasionally blow from the northwest. These winds follow the Inter-Tropical Convergence Zone (ITCZ) and create a seasonal pattern of rainfall with the main rainy season from April to July [6]. This part of Ghana is one of the driest parts of the country with a mean annual rainfall of 783 mm and a mean annual evaporation of 1964 mm. The relative humidity in the area is generally more than 90% during the night and early morning. During the day the humidity decreases to as low as 65% with a seasonal variation of 15% [6,9] making it different from many tropical regions.
2.2. Methodology
2.2.1. Collection of Water Samples and Analysis
The study was intended to calculate the Water Quality Index (WQI) of wells used for irrigation on farms along the Keta Sand Spit as well as that of the Keta Lagoon Complex and its surrounding floodplains, in order to ascertain the quality of water for public and livestock consumption, irrigation, recreation and other purposes.
Monthly field sampling was undertaken from August 2010 to August 2012 for the Keta Lagoon; from November 2010 to November 2011 for the wells. Water samples were taken from three fish-landing sites (namely Anyanui, Anloga, and Woe, Figure 2, in Keta) and the surrounding floodplains of the Keta Lagoon in Atorkor, Kplortorkor, Dzita, Kedzikope, Adzido, Kedzi, Afiadenyigba, Avedzi, Agavedzi and Adina were sampled every three months from February 2011 to February 2012. Water quality data sources included ten (10) physicochemical parameters such as pH, Electrical Conductivity, salinity, turbidity and dissolved oxygen which were monitored in-situ at the various sampling sites using VWR EC 300 and Hanna Multi-Parameter Probes; and Ionic composition such as (Na+,  , Ca2+, K+, Mg2+,
  ,
,  , and Cl−). Water samples from selected wells, the lagoon, floodplains and harvested rainwater were collected and analysed for the various physico-chemical parameters by following various established procedures. All the samples were frozen and transported to the Ecological Laboratory of the University of Ghana, Legon for analyses. Before running laboratory tests, they were warmed to room temperature by allowing them to thaw, and neutralized to an approximate pH of 7.0 with 5.0 N Sodium Hydroxide standard solution. The parameters such as nitrate, chloride, ammonium, and phosphates were analysed in the laboratory following procedures described by the American Public Health Association (APHA) [11]. Other parameters such as sodium and potassium were analysed according to standard procedures established by [12,13]. In addition, calcium and magnesium were analysed according to standard procedures described by [14-17]. Statistically, the interactions between the environmental factors in explaining the distribution of the seasons and rain, wells, the lagoon and floodplains were explored using Principal Component Analysis (PCA).
2.2.2. The Water Quality Index
Water Quality Index (WQI) is defined as a rating reflecting the composite influence of different water quality parameters [18]. In the formulation of WQI, the importance of various parameters depends on the intended use of water; here, water quality parameters are studied from the point of view of suitability for public consumption. The “standards” (permissible values of various parameters) for the drinking water used in this study are those recommended by the World Health Organization [19]. When the WHO standards were not available, a combination of drinking water standards for developed countries, [20] was applied.
Determination of the Water Quality Index (WQI)
The calculation and formulation of the WQI involved the following steps:
1) In the first step, each of the ten parameters were assigned a weight (AWi) ranging from 1 to 4 depending on the collective expert opinions taken from different previous studies. However, a relative weight of 1 was considered as the least significant and 4 as the most significant.
2) In the second step, the relative weight (RW) was calculated by using the following equation:
 (1) [18]
where, RW = the relative weight, AW = the assigned weight of each parameter, n = the number of parameters. The calculated relative weight (RW) values of each parameter are given in Table 1.
3) In the third step, a quality rating scale (Qi) for all the parameter except pH and DO was assigned by dividing its concentration in each water sample by its respective standard according to the drinking water guideline recommended by the World Health Organization [19]. The result was then multiplied by 100.
 (2) [18,20]
While, the quality rating for pH or DO (QpH, DO) was calculated on the basis of
Table 1. Relative weight and WHO 2004 standards of the water quality parameters.
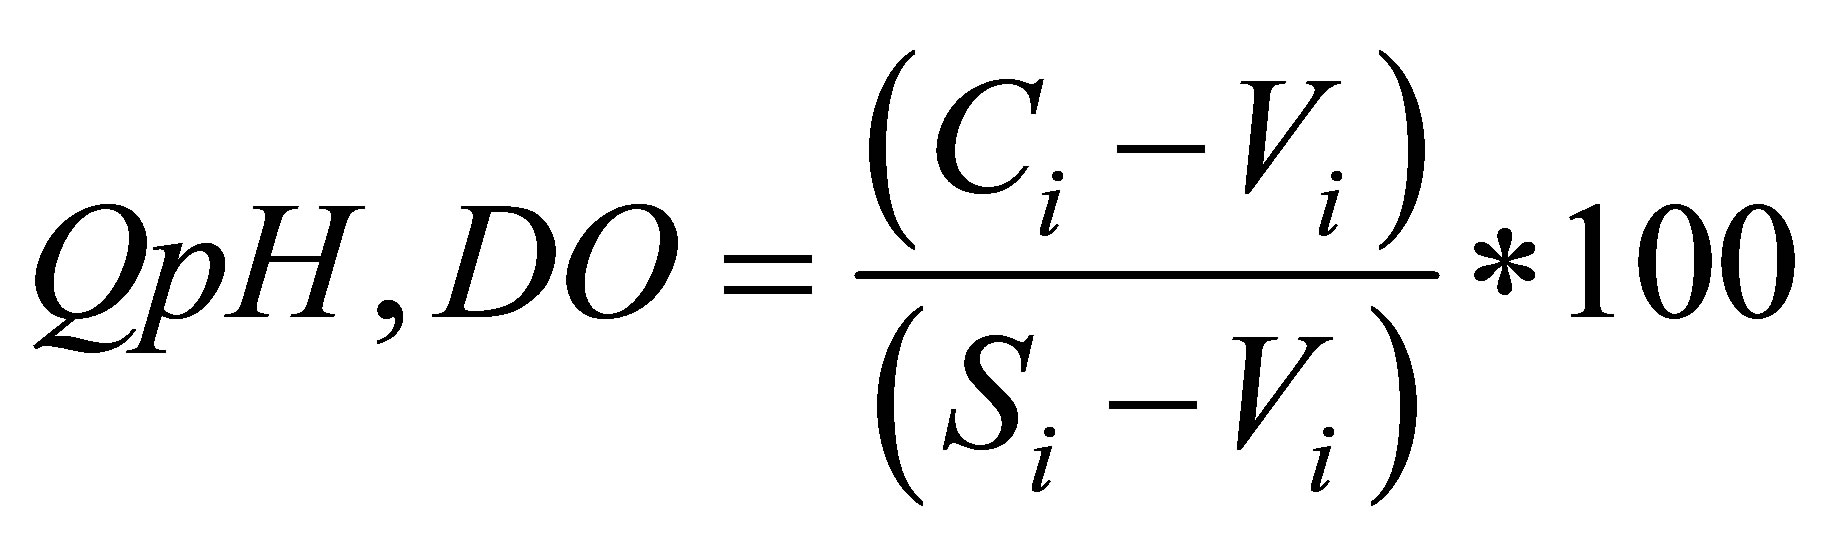 (3) [18,20]
where, Qi = the quality rating, Ci = value of the water quality parameter obtained from the laboratory analysis, Si = value of the water quality parameter obtained from recommended WHO, Vi = the ideal value which is considered as 7.0 for pH and 14.6 for DO.
Equations (2) and (3) ensures that Qi = 0 when a pollutant is totally absent in the water sample and Qi = 100 when the value of this parameter is just equal to its permissible value. Thus the higher the value of Qi, the more polluted the water is [21]
4) Finally, for computing the WQI, the sub-indices (SIi) were first calculated for each parameter, and then used to compute the WQI as in the following equations:
 (4) [18,20]
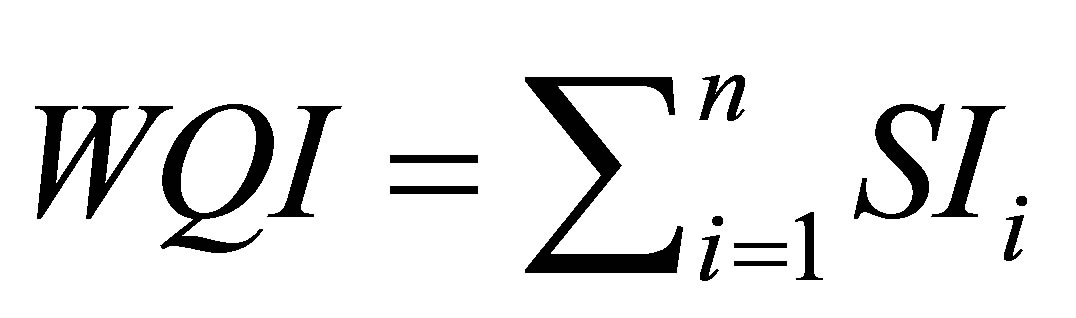 (5) [18,20]
The computed WQI values was classified as <50 = Excellent; 50 - 100 = Good; 100 - 200 = Poor; 200 - 300 = Very poor; >300 = Unsuitable [18].
3. Results
Table 2 shows the mean physico-chemical parameters of various wells, the Keta lagoon and its surrounding floodplains in comparison with rain water, FAO drinking water standards and FAO irrigation water standards. pH ranged between 7.3 - 8.3, temperature was from 25.8 to 29.2˚C, and phosphates ranged between 0.1 to 3.5 mg/l which all fell within WHO standards and FAO irrigation water standards, whilst all the other parameters such as electrical conductivity, nitrates, ammonium, sodium, chloride exceeded WHO and FAO irrigation water standards, except for calcium which although exceeded WHO standards, fell within FAO irrigation standards. Also, nitrate pollution poses a serious threat to the domestic use as measurements of nitrate in the experimental well showed an average value (72.8 mg/l) above the WHO Standard for drinking water of 50 mg/l [19]. Eutrophication of aquifers and water bodies are normally determined by the amount of nitrates and phosphates they receive from their surroundings. Nitrate is easily leached from the farmland while phosphate is normally retained in the soils fixed with aluminium, iron and calcium, and for that matter not easily leached. Thus phosphates are usually the limiting factors for algal blooms. The sandy soils on the Keta sand spit (farmlands) have a low content of iron and aluminium and therefore a low phosphorus-retention capacity and it is not clear whether the phosphorus-retention in some of the soils is exhausted and hereby increases the potential eutrophication of the lagoon, in the next few years [23,24].
In comparing the physico-chemical parameters to data from [22], sodium and chloride concentrations have reduced over the years. The most imminent risk is the intrusion of salt water during floods and the salinization of the aquifer that make the ground water unsuitable for irrigation. It was therefore, not uncommon that most farmers had raised the walls of most of their wells on the farmlands to prevent them from being submerged under lagoon water, during floods. In so doing, the inflow of sodium and chloride from the lagoon is curbed. The pH of the wells has become more alkaline over the years with the increase in calcium and magnesium within a period of ten years. All the water quality parameters fall within FAO Irrigation Standards, except for ammonium, nitrates and phosphates which are the main determining factors for possible eutrophication [5]. This confirms the fact that most of the water in the wells are of poor quality based on the water quality index (WQI) values. In comparison to WHO drinking water standards, all the parameters except for ammonium, nitrate and calcium of the wells, Keta Lagoon and floodplains fall within. This also supports the view that, the water quality of the wells, Keta Lagoon and its surrounding floodplains are poor and unsuitable for drinking by both livestock and humans. The water quality parameters of the rainwater all fell within the WHO and FAO water standards, therefore, it is of an excellent quality and suitable for drinking.
The results of the PCA (Figure 3) showed that rainwater was the least influenced by the interactions of the
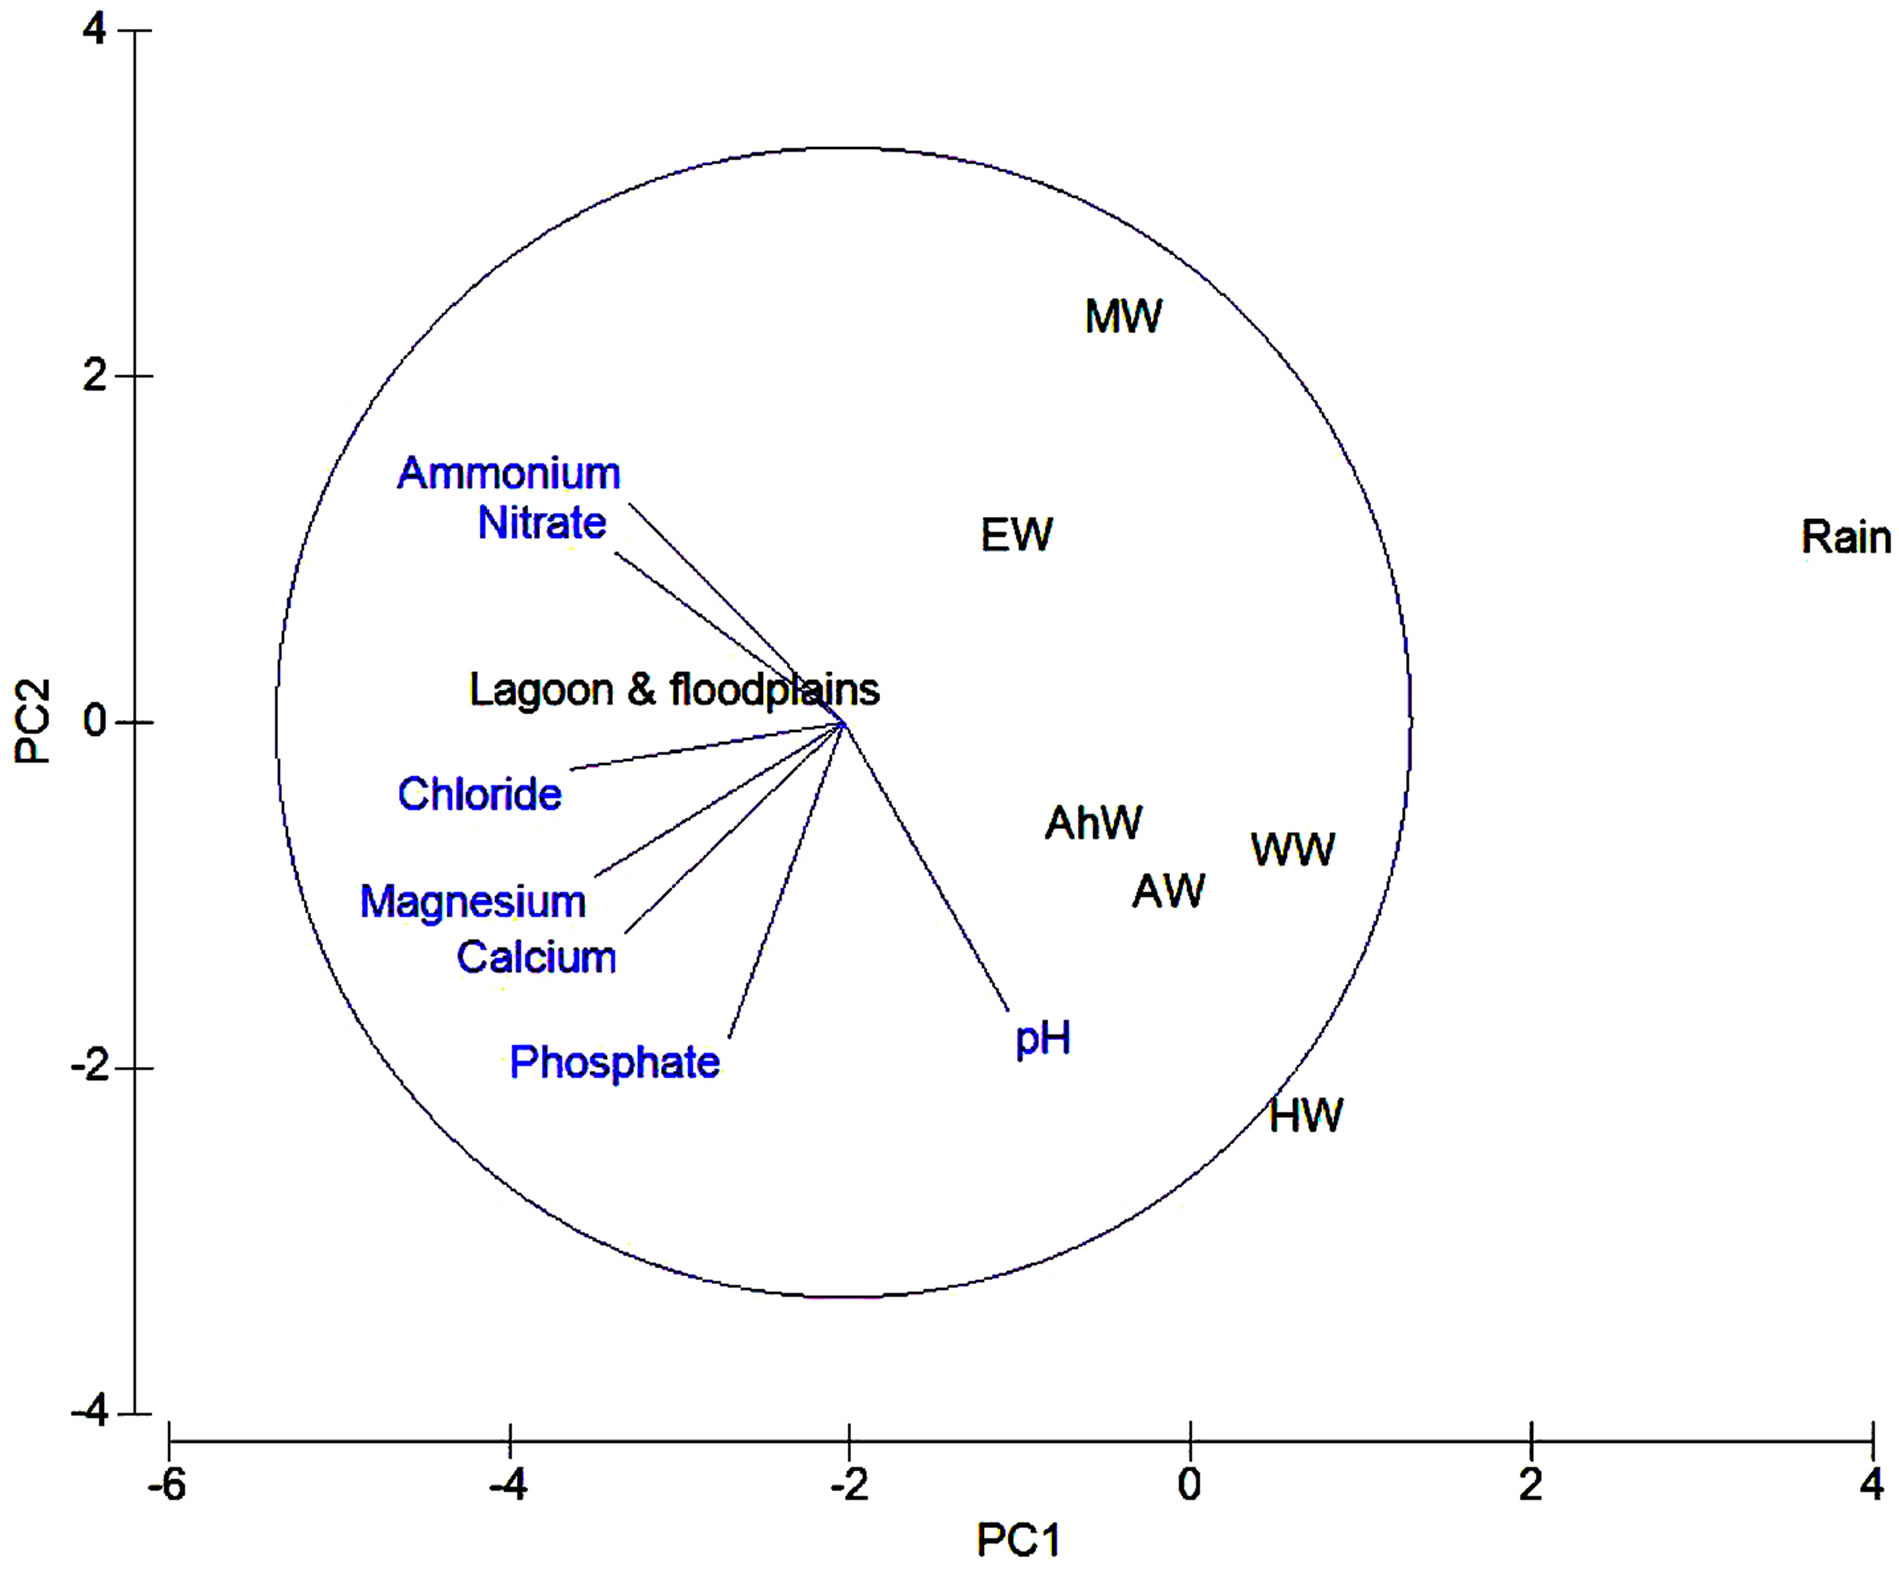
Figure 3. PCA ordination diagram for the relationship between the physico-chemical parameters of rainwater, wells, Keta Lagoon and its surrounding floodplains. Legend: PC1 = the axis which maximizes the variance of points projected perpendicularly onto it; PC2 = perpendicular to PC1 and direction in which the variance of points projected onto it is maximized.
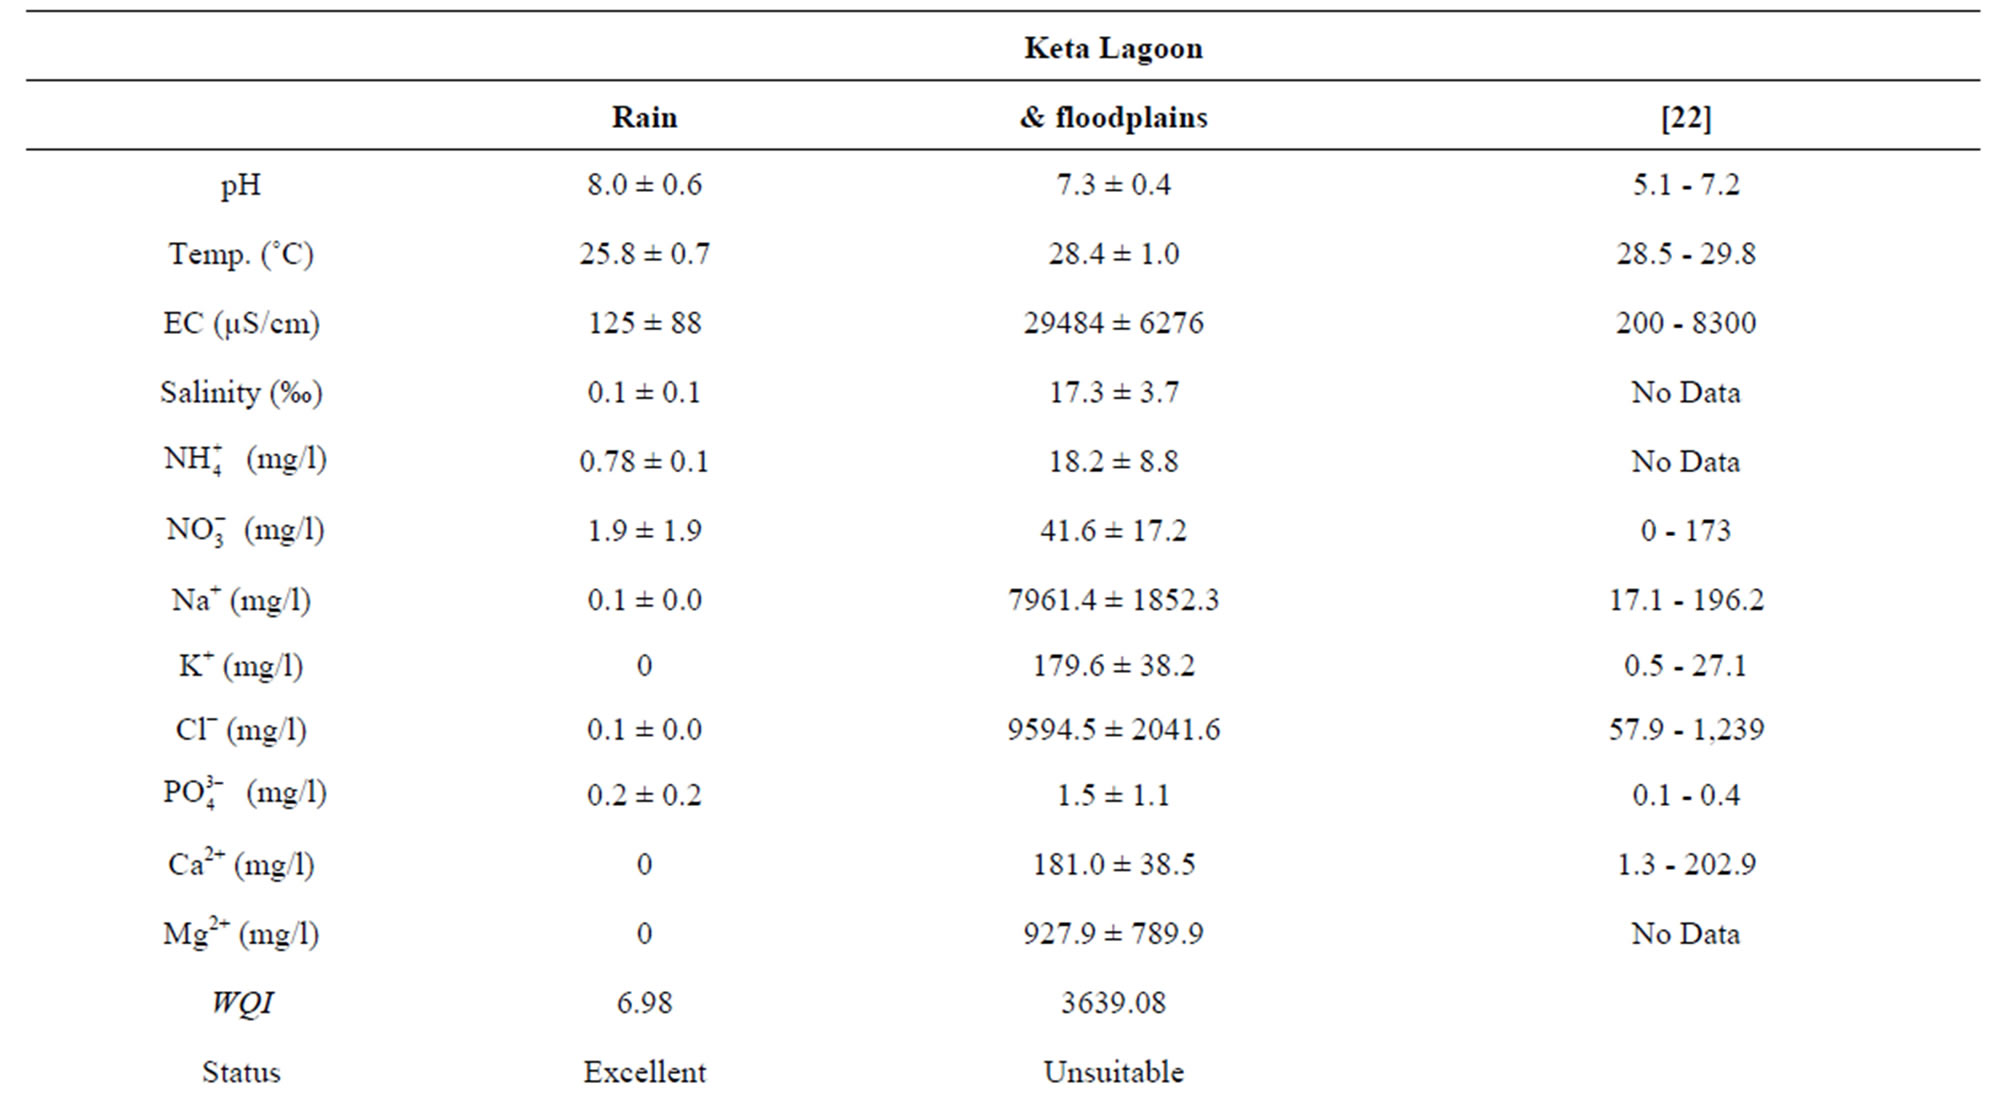
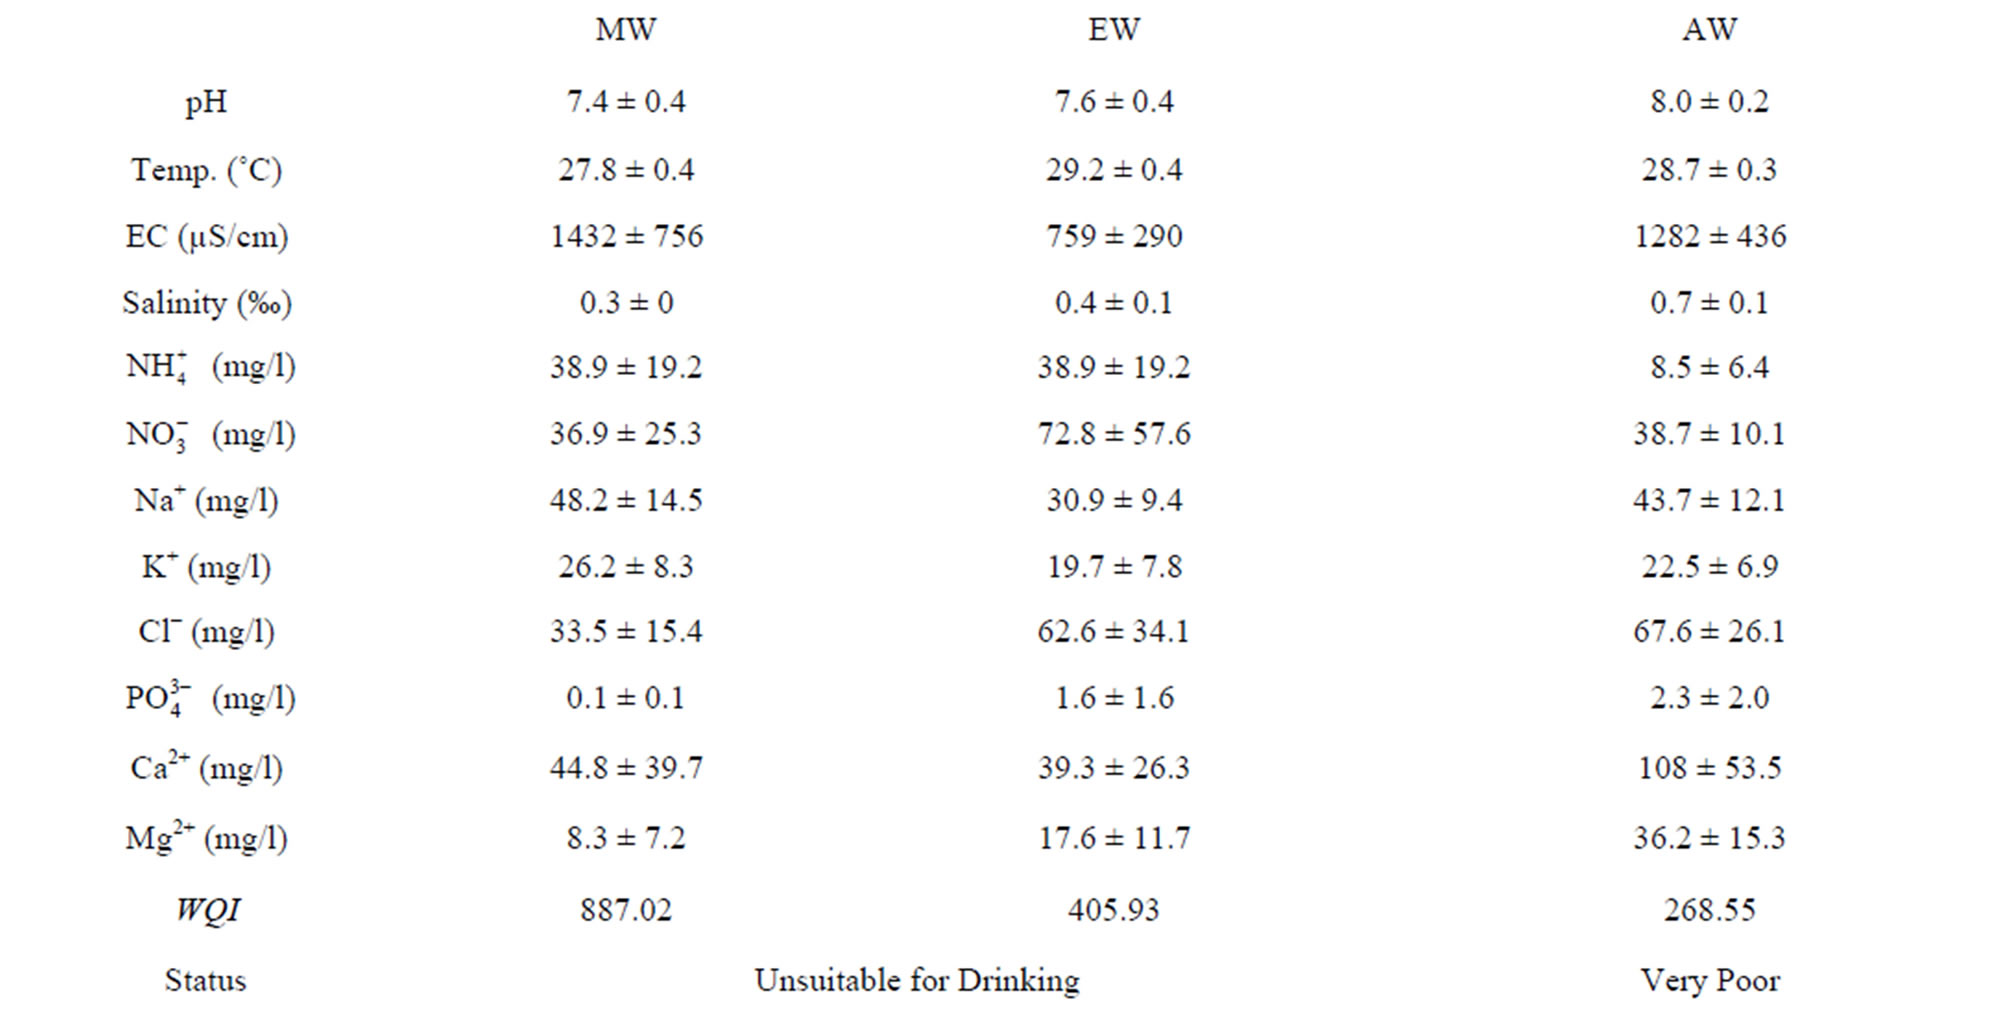
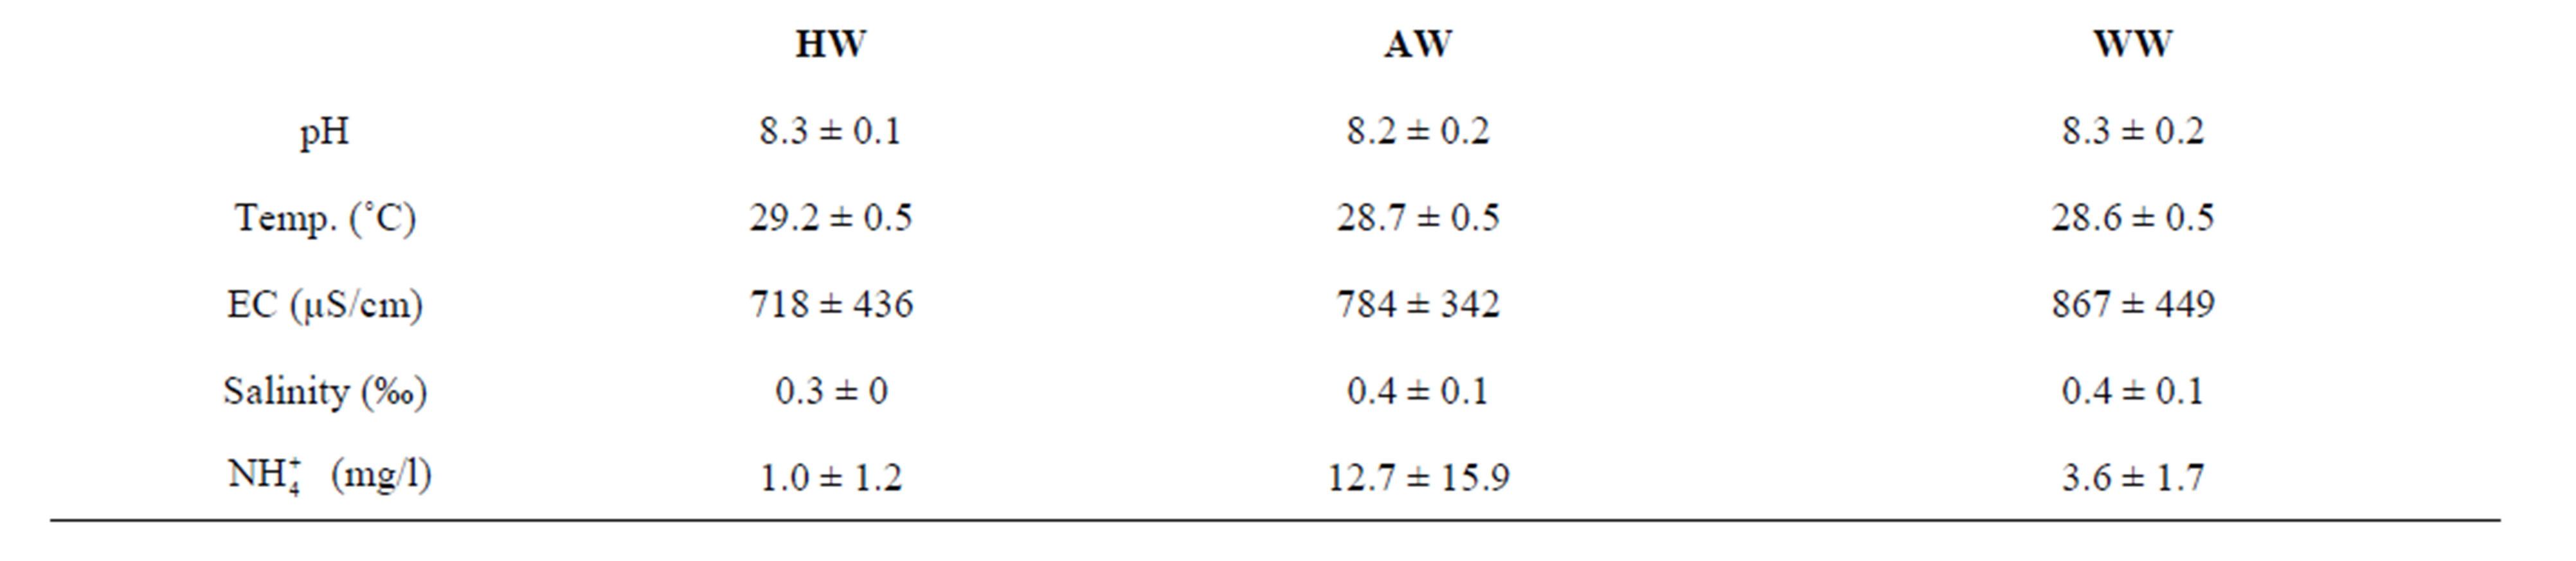
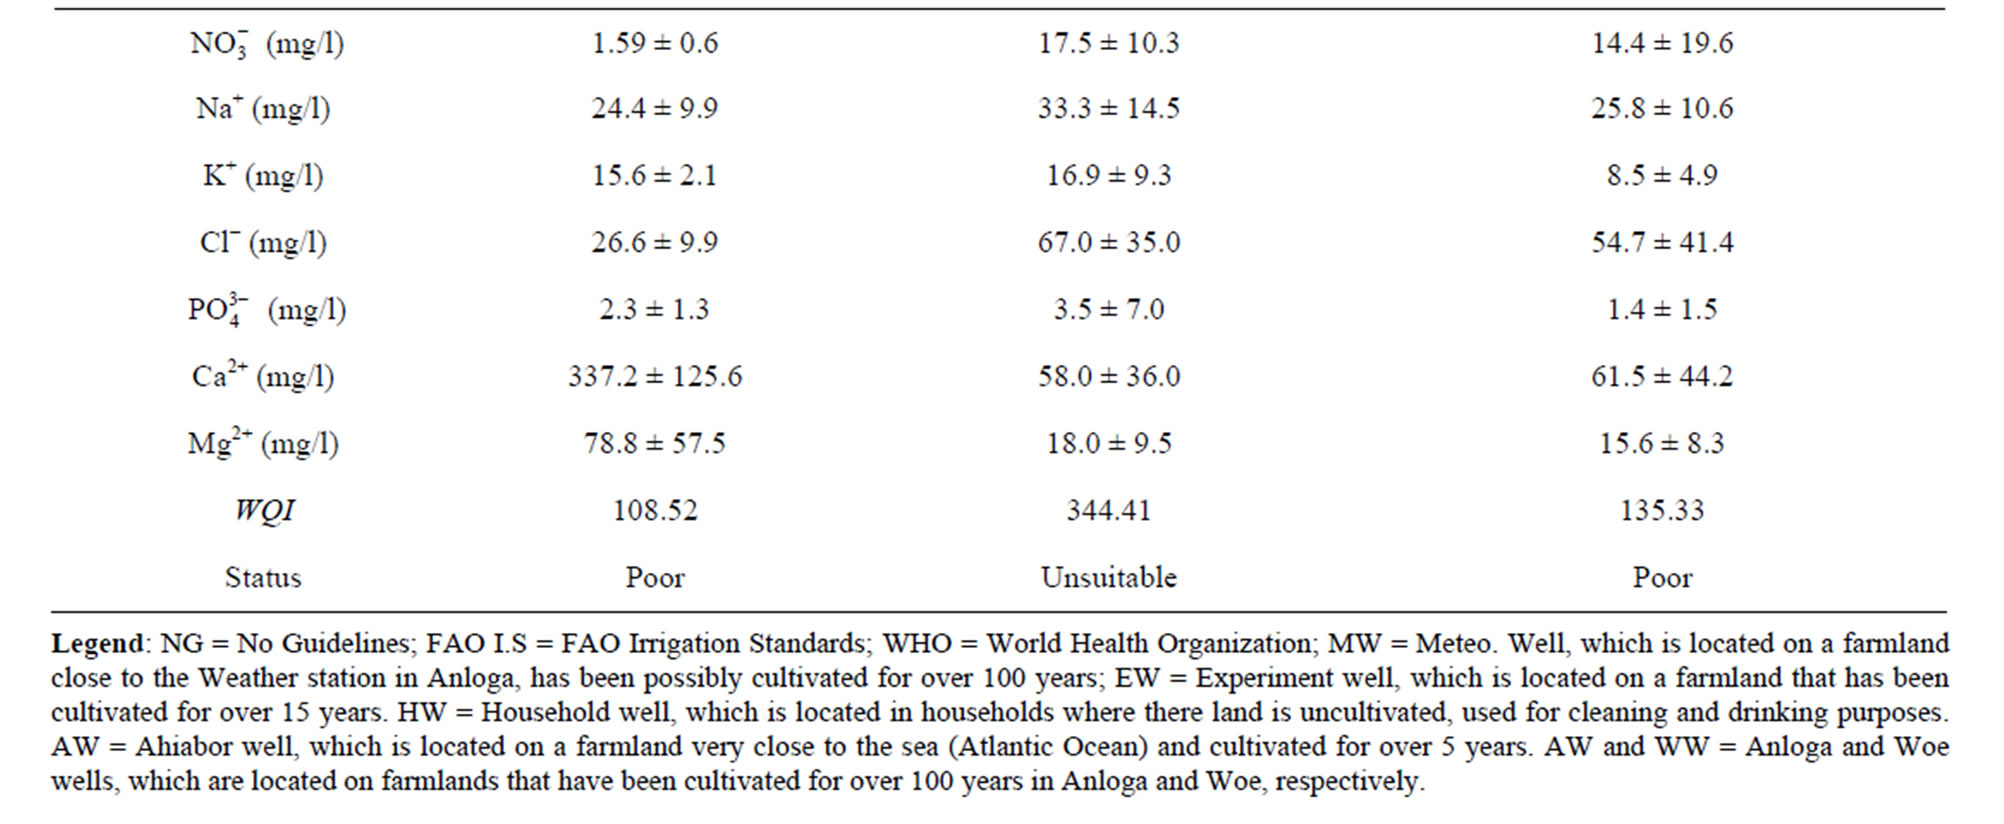
Table 2. Comparison of water quality parameters of rainwater, the Keta Lagoon complex and floodplains, and surrounding wells obtained from August 2010 to March 2012 with WHO Standards and FAO irrigation standards.
various physico-chemical parameters. For PC1, WW (Woe wells) and HW (Household wells) were influenced most by the physico-chemical parameters. For PC2, the physico-chemical parameters that showed a strong positive correlation or association were ammonium and nitrate. The Keta Lagoon and its surrounding floodplains were influenced most, followed by MW and EW. In terms of the water quality of the wells, Keta Lagoon and its surrounding floodplains, the most important parameters were pH, magnesium, calcium, phosphate, nitrate, ammonium and chloride. The percentage of contributions of the various physico-chemical parameters to the water quality of wells, Keta Lagoon and its surrounding floodplains were estimated using a dominance plot (Figure 4). The results of the Dominance Plot (Figure 4) of physico-chemical parameters of rainwater, wells, the Keta Lagoon and its surrounding floodplains showed that percentage contribution of pH and temperature to the water quality of the rainwater, wells, Keta Lagoon and its floodplains was 12%, followed by phosphates with 28%, nitrate and ammonium contributed 30%, followed by calcium with 40%. The parameters that contributed most were potassium with 62%, followed by electrical conductivity and magnesium with 84%, followed by salinity with 86%, sodium and chloride contributed highest to the water quality parameters with 96%. This supports the view that, for the Keta area, the main physico-chemical parameters that affect the water quality of the fresh water aquifers (wells), the Lagoon Complex and its surrounding floodplains are salinity, electrical conductivity, magnesium, potassium, sodium and chloride.
Physico-chemical parameters are ranked in order of importance along the x-axis, and their percentage contributions to the total are plotted along the y-axis.
Figure 4. Dominance Plot diagram for the relationship between the physico-chemical parameters of rainwater, wells, the Keta Lagoon and its surrounding floodplains.
4. Conclusions
The major environmental impacts associated with crop farming in Anloga, Ghana result from the use of fertilizers (N: P: K) mainly nitrogen compounds, manure, to a small extent pesticides, soil erosion and storm run-offs [1]. The causes of fertilizers and pesticides loss into the environment need to be addressed, and measures taken to help reduce this particular area of environmental impact.
In this study, the WQI has been demonstrated as a possible tool to communicate information on the quality of water to the concerned citizens and policy makers [18]. From this study, the WQI of the wells in Anloga and Woe, the Keta Lagoon Complex and its surrounding floodplains provide an in-depth knowledge into the state of their water quality. The WQI of the wells, lagoon and floodplains currently, suggest that they are either of poor water quality or unsuitable for drinking (Table 2). In order to improve their quality to a drinkable status, treatment interventions include simple and intensive physical and chemical treatment and disinfection, such as rapid filtration and disinfection, pre-chlorination, decantation, filtration, adsorption (activated carbon), ozonation and final chlorination [25] are recommended. Finally, the PCA analysis (Figure 3) and dominance plots (Figure 4) suggest that in the Keta Area, the most important water quality parameters that need to be constantly monitored include pH, phosphate, calcium, magnesium, chloride, nitrate and ammonium. According to WHO organization, about 80% of all the diseases in human beings are caused by water. Once the groundwater is contaminated, its quality cannot be restored by stopping the pollutants from the source. It therefore becomes imperative to regularly monitor the quality of groundwater and to device ways and means to protect it.
In conclusion, management approaches such as water quality auditing, [23], are recommended to assess their potential use for drinking and irrigation. In addition, the increased use of computers in aquatic sciences provide opportunities for developing environmental management and decision support systems to assist farmers, aquatic biologists and environmentalists address environmental demands on water quality through sustainable land-use without loss of profitability [5].
5. Acknowledgements
The authors are most grateful to DANIDA for funding this study through the Sustainable food production through irrigated intensive farming systems in West Africa (SIFA) Project which forms part of a research project carried out in collaboration with University of Ghana and University of Copenhagen, Denmark. Many thanks go to the then Director of the Ecological Laboratory, Professor Patrick K. Ofori-Danson for making available the laboratory space and instruments for the laboratory analysis of samples as well as the technicians of the Department of Marine and Fisheries Sciences and Ecological laboratory of the University of Ghana for diverse assistance during the field and laboratory investigations.
REFERENCES
- T. W. Awadzi, E. Ahiabor and H. Breuning-Madsen, “The Soil-Land Use System in a Sandspit Area in the SemiArid Coastal Savanna Region of Ghana. Sustainability and Threats,” Technical Paper, 2007.
- P. K. Ofori-Danson, M. Entsua-Mensah and C. A. Biney, “Monitoring of Fisheries in Five Lagoon Ramsar Sites in Ghana,” Final Report to the Department of Wildlife under the Ghana Coastal Wetlands Management Project, Forestry Commission, Accra, 1999.
- R. D. Asiamah, “Soils of the Ho-Keta Plains, Volta Region, Ghana,” Soil Research Institute, Kumasi, 1995.
- T. Piersma and Y. Ntiamoa-Baidu, “Waterbird Ecology and the Management of Coastal Wetlands in Ghana,” NIOZ Report 1995-1996, Royal |Netherlands Institute for Sea Research (NIOZ), Texel, 1995.
- J. A. Skinner, K. A. Lewis, K. S. Bardon, P. Tucker, J. A. Catt and B. J. Chambers, “An Overview of the Environmental Impact of Agriculture in the UK,” Journal of Environmental Management, Vol. 50, No. 2, 1997, pp. 111- 128. http://dx.doi.org/10.1006/jema.1996.0103
- T. H. Sorensen, G. Volund, A. K. Armah, C. Christensen, L. B. Jensen and J. T. Pedersen, “Temporal and Spatial Variations in Concentrations of Sediment Nutrients and Carbon in the Keta Lagoon, Ghana,” West African Journal of Applied Ecology, Vol. 4, 2003, pp. 91-105.
- A. K. Armah, M. Awumbila, S. Clark, A. Szietror, R. Foster-Smith, R. Porter and E. M. Young, “Coping Responses and Strategies in the Coastal Zone of SouthEastern Ghana. A Case Study in the Anloga Area,” In: S. M. Evans, C. J. Vanderpuye and A. K. Armah, Eds., The Coastal Zone of West Africa—Problems and Management, Proceedings of an International Seminar, Accra, 23-28 March 1996, Penshaw Press, Sunderland, 1997, pp. 17- 27.
- Anonymous, “Ramsar Library: The Directory of Wetlands of International Importance,” 4th Edition, The Ramsar Convention on Wetlands, Ramsar Secretariat, Gland, 1993. www.ghanaweb.com
- G. O. Kesse, “The Mineral and Rock Resources of Ghana,” A. A. Balkema, Rottendam/Boston, 1985.
- R. Arfi, D. Gurial and M. Bouvy, “Wind-Induced Resuspension in a Shallow Tropical Lagoon,” Estuarine, Coastal and Shelf Science, Vol. 36, No. 6, 1993, pp. 587-604. http://dx.doi.org/10.1006/ecss.1993.1036
- APHA, “Water Analysis Handbook,” 2nd Edition, HACH Company World, Washington DC, 1995.
- D. C. Harris, “Quantitative Chemical Analysis,” 4th Edition, W. H. Freeman and Company, New York, 1995.
- H. B. Sawyer, “Chemistry Experiments for Instrumental Methods,” Wiley, New York, 1984.
- International Standard Organization, “Sodium Chloride for Industrial Use—Determination of Matter Insoluble in Water or in Acid, and Preparation of Principal Solutions for Other Determinations,” ISO, Vol. 2479, No. 1, 2011, pp. 1972-1974.
- US Environmental Protection Agency, “Calcium: Method 215.1 (Atomic Absorption, Direct Aspiration),” In: Methods for Chemical Analysis of Water and Wastes, U.S.E.P.A., Cincinnati, 1983, pp. 215.1-215.2.
- US Environmental Protection Agency, “Metals (Atomic Absorption Methods)—General Procedure for Analysis by Atomic Absorption,” In: Methods for Chemical Analysis of Water and Wastes, U.S.E.P.A., Cincinnati, 1983, pp. 67-70.
- European Union Salt Producers Association (EuSalt), “Determination of Calcium and Magnesium. Flame Atomic Spectrophotometric Method,” EuSalt, Brussels, 2005, p. 5.
- C. R. Ramakrishnaiah, C. Sadashivaiah and C. Ranganna, “Assessment of Water Quality Index for the Groundwater in Tumkur Taluk, Karnataka State, India,” E-Journal of Chemistry, Vol. 6, No. 2, 2009, pp. 523-530. http://dx.doi.org/10.1155/2009/757424
- WHO (World Health Organization), “Guidelines for Drinking Water Quality,” 3rd Edition, WHO, Geneva, 2004.
- A. H. M. J. Alobaidy, H. S. Abid and B. K. Maulood, “Application of Water Quality Index for Assessment of Dokan Lake Ecosystem, Kurdistan Region, Iraq,” Journal of Water Resource and Protection, Vol. 2, No. 9, 2010, pp. 792-798. http://dx.doi.org/10.4236/jwarp.2010.29093
- S. K. Mohanty, “Water Quality Index of Four Religious Ponds and Its Seasonal Variation in the Temple City, Bhuvaneshwar,” In: A. Kumar, Ed., Water Pollution, APH Publishing Corporation, New Delhi, 2004, pp. 211-218.
- B. K. Kortatsi, E. Young and A. Mensah-Bonsu, “Potential Impact of Large Scale Abstraction on the Quality of Shallow Groundwater for Irrigation in the Keta Strip, Ghana,” West African Journal of Applied Ecology, Vol. 8, 2005, pp. 1-12.
- O. K. Borggaard, C. Szilas, A. L. Gimsing and L. H. Rasmussen, “Estimation of Soil Phosphate Adsorption Capacity by Means of a Pedotransfer Function,” Geoderma, Vol. 118, No. 1-2, 2004, pp. 55-61. http://dx.doi.org/10.1016/S0016-7061(03)00183-6
- S. E. A. T. M. Van der Zee, M. M. Nederlof, W. H. van Riemsdijk and F. A. M. de Hann, “Spatial Variability of Phosphate Adsorption Parameters,” Journal of Enviromental Quality, Vol. 17, No. 4, 1988, pp. 682-688. http://dx.doi.org/10.2134/jeq1988.00472425001700040027x
- EC (EUROPEAN COUNCIL), Consolidated Text Produced by the CONSLEG System of the Office for Official Publications of the European Communities. Council Directive of 16 June 1975, “Concerning the Quality Required of Surface Water Intended for the Abstraction of Drinking Water in the Member States (75/440/EEC),” Office for Official Publications of the European Communities, Luxembourg City, 1991.
NOTES
*Corresponding author.