Open Journal of Modern Hydrology
Vol.3 No.3(2013), Article ID:33994,8 pages DOI:10.4236/ojmh.2013.33016
Flash Flood Risk Assessment Using Morphological Parameters in Sinai Peninsula
![]()
Irrigation and Hydraulic Department, Faculty of Engineering, Ain Shams University, Cairo, Egypt.
Email: elmoustafa010@yahoo.co.uk
Copyright © 2013 Ashraf M. Elmoustafa, Mona M. Mohamed. This is an open access article distributed under the Creative Commons Attribution License, which permits unrestricted use, distribution, and reproduction in any medium, provided the original work is properly cited.
Received May 2nd, 2013; revised June 2nd, 2013; accepted June 10th, 2013
Keywords: Flash Floods; Morphology; MCA; Sinai Peninsula; Arid Region
ABSTRACT
Flash floods are considered to be one of the worst weather-related natural disasters. They are sudden and highly unpredictable following brief spells of heavy rain. Egypt is subjected to flash floods, especially the eastern desert and Sinai Peninsula where floods from the mountains of Red Sea and Sinai are causing heavy damage to man-made features. This manuscript presents the methodology adopted to generate a weighted risk map for main watersheds located in Sinai according to main morphological parameters. Using digital elevation model (DEM) implemented into a Geographic Information System (GIS) the Sinai watersheds were delineated and morphological parameters calculated. The parameters where then used in a multi criteria analysis process to calculate a morphological risk factor. The resulted risk maps of this study can help initiating appropriate measures to mitigate the probable hazards in the area with prioritization.
1. Introduction
The Sinai Peninsula is a triangular peninsula in Egypt about 60,000 km2 (23,000 sq mi) in area. It is situated between the Mediterranean Sea to the north, and the Red Sea to the south, Figure 1 , and is the only part of Egyptian territory located in Asia as opposed to Africa, effectively serving as a land bridge between two continents; also it is one of the largest mining fields in Egypt beside the potential of agriculture and industrial development which give it a great importance to the economy of developed country of Egypt. This part of Egypt is sometimes subjected to flash floods events resulting from heavy, short duration and sudden rainfall events. This work evaluates and tests a new criterion for flood risk assessment studies for Sinai Peninsula.
Many studies were carried out to assess the seriousness of the floods in places susceptible to floods. EL-Shamy (1992); established two relation graphs to classify basins flood risk based on the relations between bifurcation ratio (Rb) and the drainage density (D) and the relations between bifurcation ratio versus the drainage frequency (F) [1]. Elmoustafa (2012); used a Weighted Normalized Risk Factor (WNRF) for floods risk assessment. The four parameters used are Area, Slope, time of concentration and runoff volume. A weight coefficient (W) was assumed constant for all factors and equal to 1/(No. of parameters). It was noticed during the analysis for a case study in the Eastern desert that the drainage basin area has a great effect on the floods generated at its outlet while other factors have less effect than the drainage area such as the slope and roughness [2]. Another study used nine morphological parameters to make risk map for watersheds that affect on area from Marsa Alam to Ras Banas The morphological parameters used were Area of watershed, Slope, Drainage Density, Drainage Frequency, RB, Rt, Roughness factor, Shape factor, and Heights Factor. The risk value was calculated for every parameter for all watersheds [3].
 (1)
(1)
Morphological parameters are the main factors affecting the flood hydrograph shape and hence its strength and should be addressed when studying watersheds flash floods risk assessment [4,5]. In this manuscript the following algorithm was followed:
A Geographic Information System (GIS) was used to calculate the required morphological parameters for all watersheds of the study area using the available Digital Elevation Model (DEM).
Main morphological parameters were used to estimate a risk factor representing each of them.
HEC-HMS was used to study the sensitivity of each morphological parameter of every main catchment in the study area to a pseudo storm applied to all the catchments.
New methodology was proposed to combine those risk factors through weights assigned to each of them based on the HEC-HMS results.
2. Objectives of the Study
The objective of this research is to come up with a risk map by developing a risk factor that reflects the watersheds morphological parameters effects on flood hydrographs and test it by studying the response of all catchment in the study area to a pseudo storm. These results are essential to define the higher risk locations in the study area through a resulted risk maps of the effecting watersheds that can help initiate appropriate measures to mitigate the probable hazards in the area with prioritization.
3. General Description of the Study Area
The Sinai Peninsula extends Longitude 32.25˚E and 34.8˚E; Latitude 27.8˚N and 31.2˚N. Geologically Sinai can be roughly divided into three areas. The northern region consists of sand dunes and fossil beaches formed by the changing levels of the Mediterranean Sea during the glacial periods two million years ago. The landscape is flat and uniform, interrupted only by some vast sand and limestone hills.
The scarcely inhabited Al Tih Plateau is the central geological area with limestone dating from the Tertiary Period. The highlands extend towards the south until it goes over into the third area consisting of granite and volcanic rock. Limestone and sandstone sediments are replaced by granite and basalt. Both rocks are produced by volcanic activity on the bottom of the ocean from the Precambrium.
4. Scope and Methodology
This study deals with the evaluation of different geomorphological impacts on flash floods risk degree. To achieve the goal of the present research, DEM from the NASA Shuttle Radar Topographic Mission (SRTM) provided digital elevation data of 90 m resolution, was exported to a Geographic Information System (GIS) environment to extract all possible morphological parameters of the catchment in the area.
The watershed, streams and sub-basins were delineated with a threshold of a 25 km2 for the smallest stream definition, Figure 2.
Watershed characteristics, such as watershed area, perimeter, drainage line number, sum of drainage lines and longest flow path were extracted and a sample is presented in the next Table 1.
Then the geometric watershed characteristics were automatically calculated. From these characteristics other morphological parameters were calculated as follows:
1) Drainage frequency (F), Figure 3, defined as the ratio between Streams’ Number to the total watershed area (Horton, 1932).
2) Drainage density (D), Figure 4, defined as the ratio between the summation of Streams’ Lengths and total watershed area (Horton, 1945).
3) Surface flow length (Lo), Figure 5, it is the distance travelled by water before reaching any stream.
4) Shape factor (Ish), Figure 6, and is equal to 1.27* (A/P2) as per McCuen, 1989. Where P is the watershed perimeter and A is its corresponding area.
5) Time of concentration (Tc) and was estimated based on the Kirpich formula, (Soil Conservation Services (SCS), 1940).
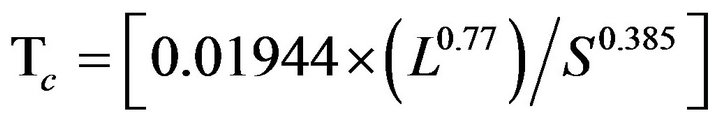
where (L) is longest flow path in meters and (S) is its corresponding slope.
Table 2 gives sample of the calculated parameters.
5. Standardization of Parameters
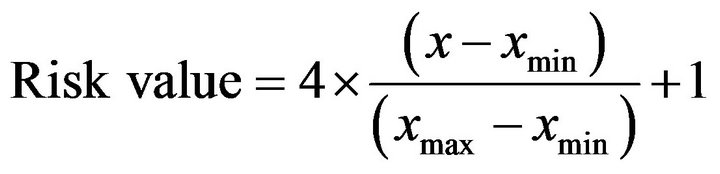
The hydro-morphological parameters obtained for each watershed are expressed in different units. It is therefore difficult to compare across criteria. For many of the arithmetic Multi Criteria Analysis (MCA) techniques, it is necessary to reduce the scores to the same unit, this is called standardization [5,6]. The difference between the
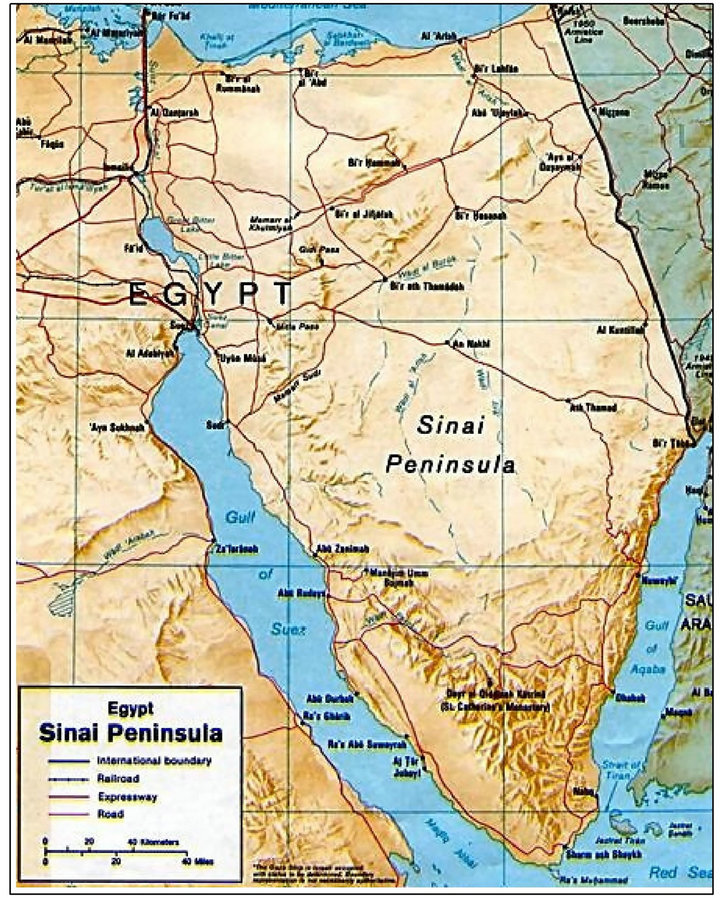
Figure 1. Location of the study area.
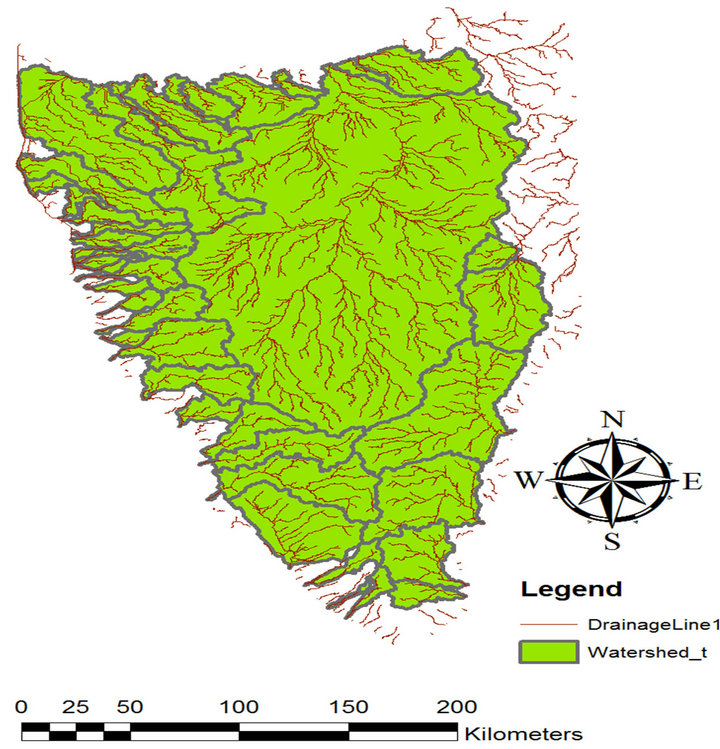
Figure 2. Watersheds of study area.
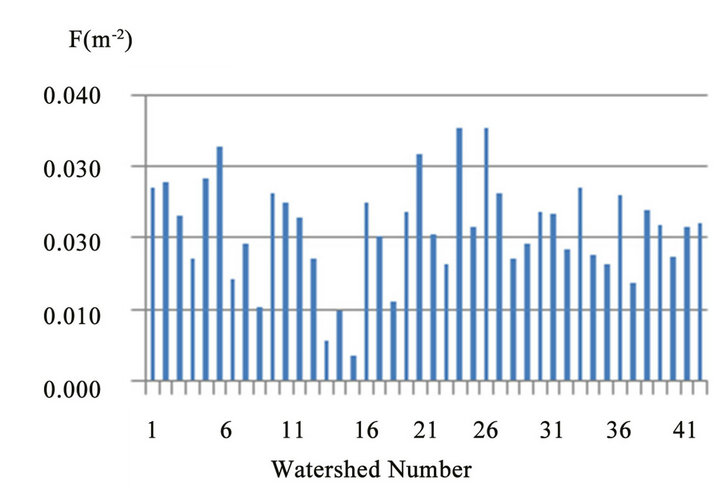
Figure 3. Drainage frequency of watersheds.

Figure 4. Drainage density of watersheds.
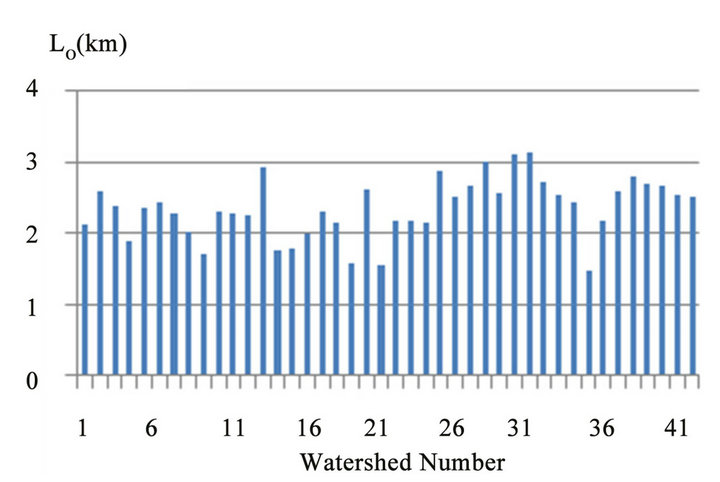
Figure 5. Surface flow length of watersheds.
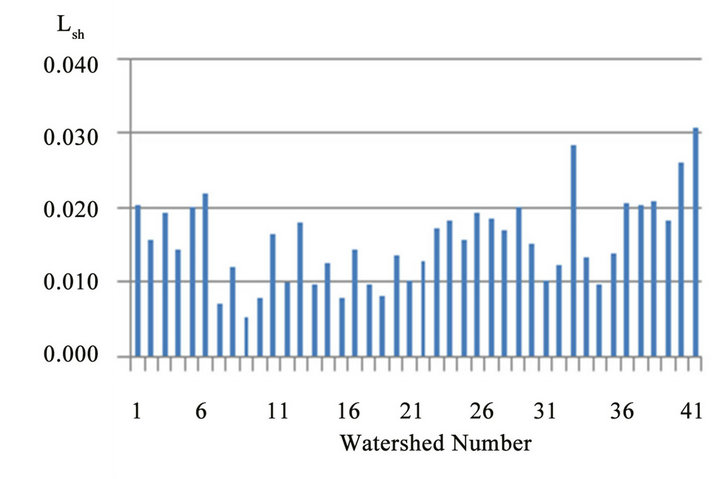
Figure 6. Shape factor of watersheds.
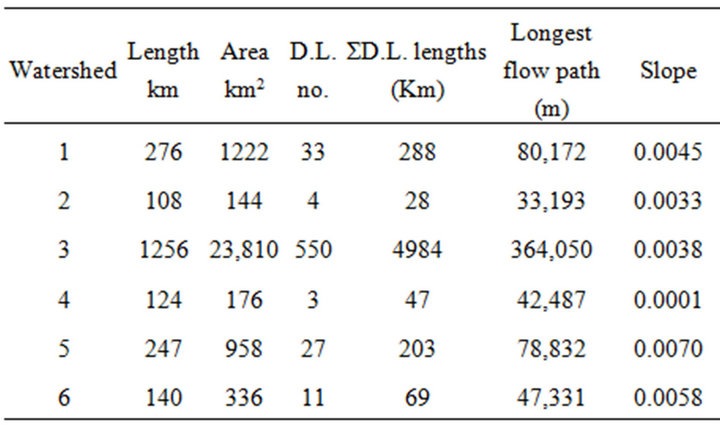
Table 1. Watershed characteristics sample.
actual parameter and that of the lowest value is divided by the difference between the parameters of the highest value and that of the lowest value. This led to standardized factors that reflect the degree of risk for each parameter compared to the same parameter in the other sheds.
 (2)
(2)
 (3)
(3)
 (4)
(4)
 (5)
(5)

(6)
 (7)
(7)
 (8)
(8)
where, Max. refers to the maximum value of the mentioned parameters and Min. refers to the minimum value of the mentioned parameters.
It was noticed that extreme high values may affect the results, one main drainage area is extremely high (23,810 km2), Figure 7, that appear as extreme line on the graph, while all the other values fall below 1000 km2. This will affect the risk factors calculated and should be reconsidered and risk factors carefully adjusted.
The box plot technique was applied to test all the data for values that are extremely high or an outlier. An outlier is an observation that is numerically distant from the rest of the data which may lead to biased results. Box plot technique is useful to display differences between populations without making any assumptions of the underlying statistical distribution. It is non-parametric and spacing between the different parts of the box helps indicate the degree of dispersion (spread) and deviation in the data, and identify outliers. Table 3 represents the box plot test results for the morphological parameters that were previously discussed and will be used in the nest steps of the analysis. After the exclusion of the outlier,
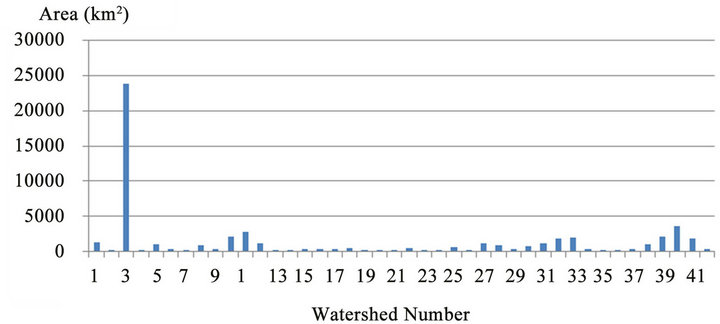
Figure 7. Extreme value of watersheds area.
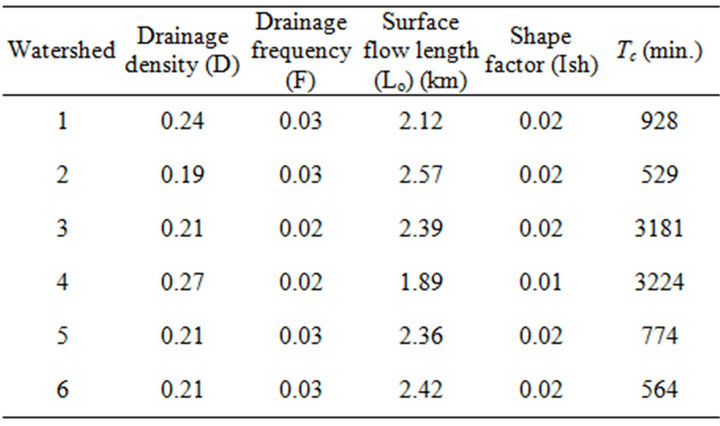
Table 2. Sample of the calculated parameters.
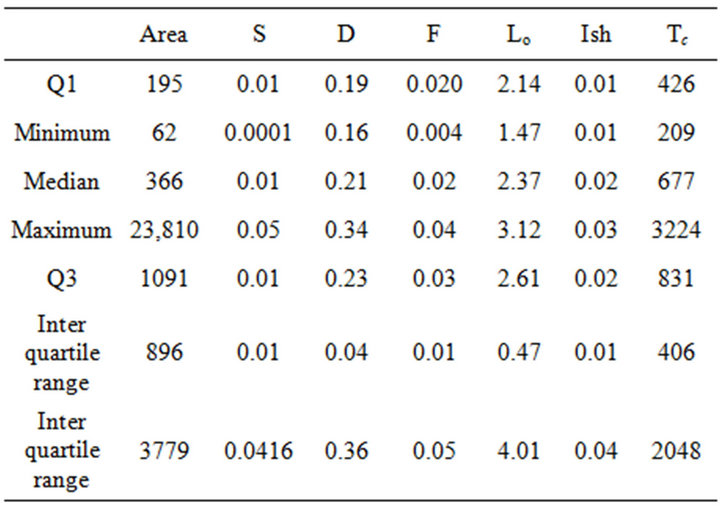
Table 3. Box plot test results.
the Standardized Risk Factors (SRF) were then recalculated.
6. Sensitivity Analysis Using HEC-HMS
The sum of factors is called the Weighted Standardized Risk Factor (WSRF). A weight coefficient (W) will be assigned to each factor based on the results of watersheds sensitivity analysis on HEC-HMS, a computer programs developed and used for hydraulic modelling for the past 30 years (Chow et al., 1988) [7].
All watersheds were subjected to the same condition by applying a typical pseudo storm with all input parameters (as curve number and precipitation) the same so that the more important the factor is the higher the W value will be assigned to it.
 (9)
(9)
whereWi is the weight to be assigned to each risk factor.
SRFi each factor of those presented by Equations (1) to (7).
The outflow hydrographs for the given rainfall event were generated and main effective outputs of the hydrographs (i.e. peak discharge and time to peak) were tested against all morphological parameters. For example, it was noticed that correlation between area and both time to peak and peak discharge is directly proportional and correlation between slope and both time to peak and peak discharge is indirect proportional, Figures 8 to 11 represent sample of this analysis results.
6.1. Sensitivity Analysis Results
Flash flood means high peak and short duration, therefore peak discharges and time to peak results were studied and their correlation with all morphological parameters were calculated. Flood risk is considered directly proportional with peak discharge value and indirect proportional with time to peak.
Figure 8. Area vs time to peak.
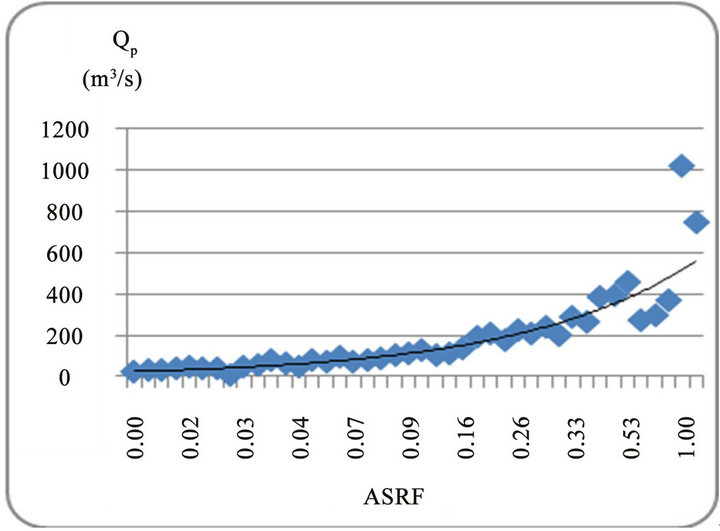
Figure 9. Area vs peak discharge.
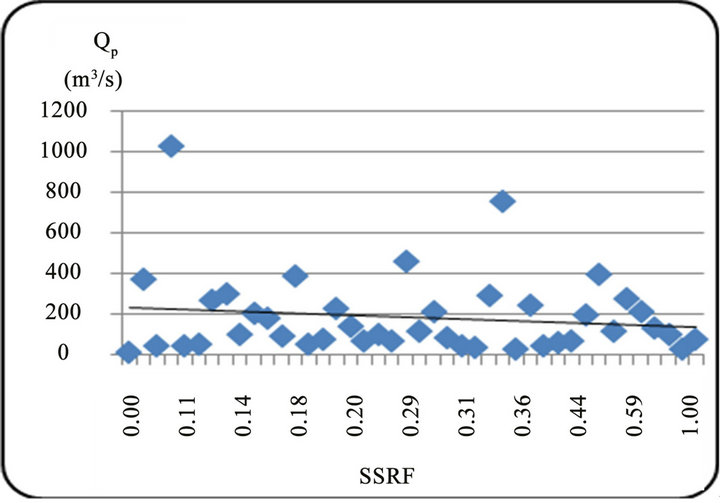
Figure 10. Slope vs peak discharge.
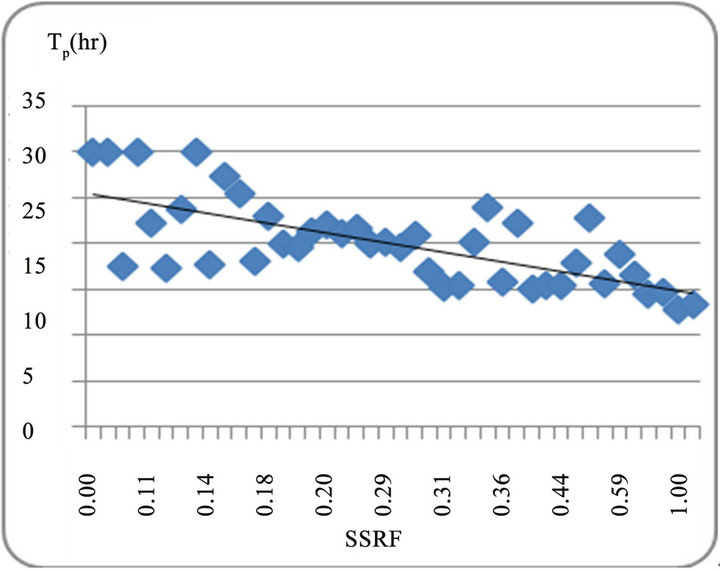
Figure 11. Slope vs time to peak.
6.1.1. Peak Discharge Risk
The correlation between each factor and the hydrograph parameters were computed to help estimating the weight of each risk factor, Table 4. It was noticed that correlations between SSRF, LoSRF and ShSRF are negative therefore inverse values of slope and shape factor will used and A, D, F, Tc values will be directly used in SRF calculation as they were presented with positive correlations.
It was also noticed from the correlation factor results that the drainage basin area has a great effect on the generated floods followed by time of concentration and slope, other factors have less effect such as the shape factor, drainage frequency, Drainage density and surface runoff length. Correlations of 1/Lo and drainage density are found to be of negative value, which is opposite to what was expected, and this is because watersheds with small areas have higher drainage density, Figure 12, and to overcome this, streams threshold had to be reduced and this led to long processing time. Therefore 1/Lo and D SRFs were neglected in WSRF calculation in this work.
Based on the resulted correlation factors, the weight coefficient w values were then calculated as followed:
 (10)
(10)
Table 5 represents the final weights assigned to each risk factor with total summation of 1. Standardized Risk Factors were recalculated and WSRF were estimated using these weight coefficients. Table 6 shows sample of SRF calculations results with respect to the peak flow value risk.
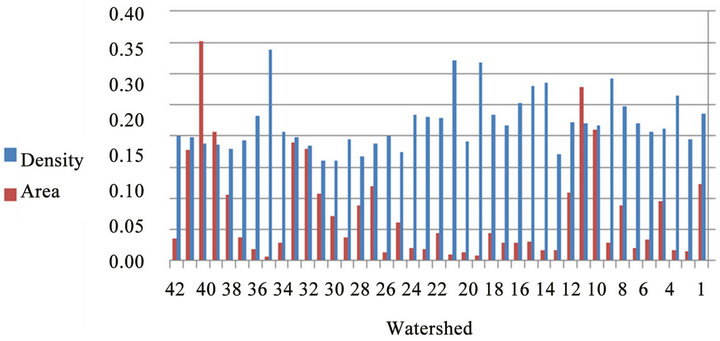
Figure 12. Area and drainage density for watersheds.

Table 4. Correlation between peak discharges and SRF values.
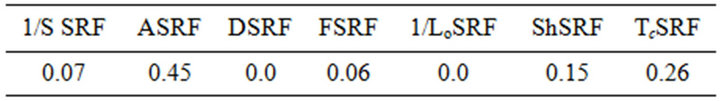
Table 5. The weight coefficient (W).
Figure 13 represents the main watersheds flowing through Sinai Peninsula, with different colours each representing the risk level of the watershed, WSRF, as computed by Equation (8).
The analysis showed that the flood risk factor for the main watersheds flowing through Sinai Peninsula could be classified into 5 categories according to their WSRF, Figure 14.
6.1.2. Time to Peak Risk
The correlation between each factor and the hydrograph parameters were computed to help estimating the weight of each risk factor. Table 7 shows results for the correlation between the hydrograph time to peak and SRFs. It
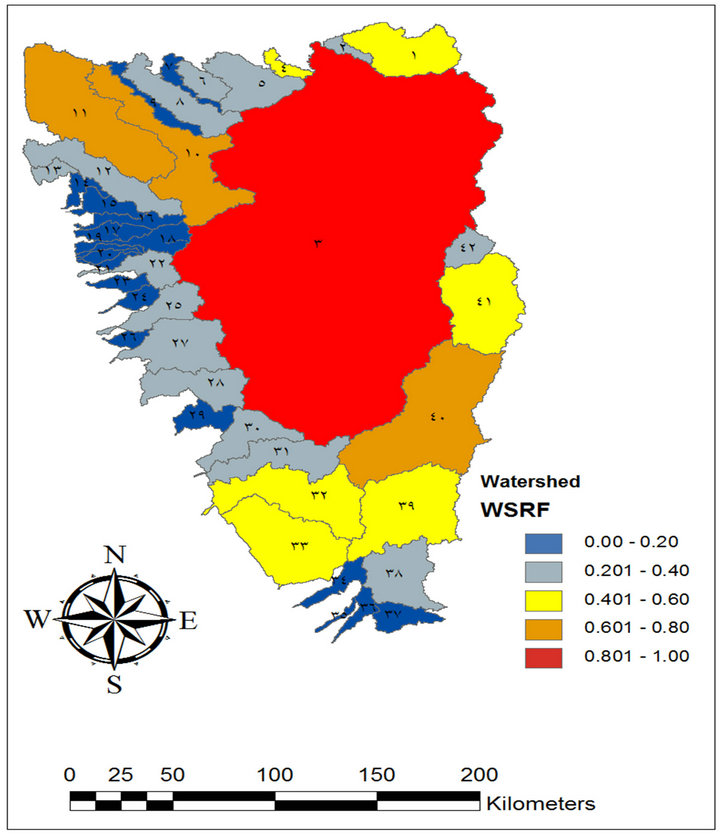
Figure 13. weighted risk map for main watersheds draining towards Sinai coast, with respect to the peak flow value.
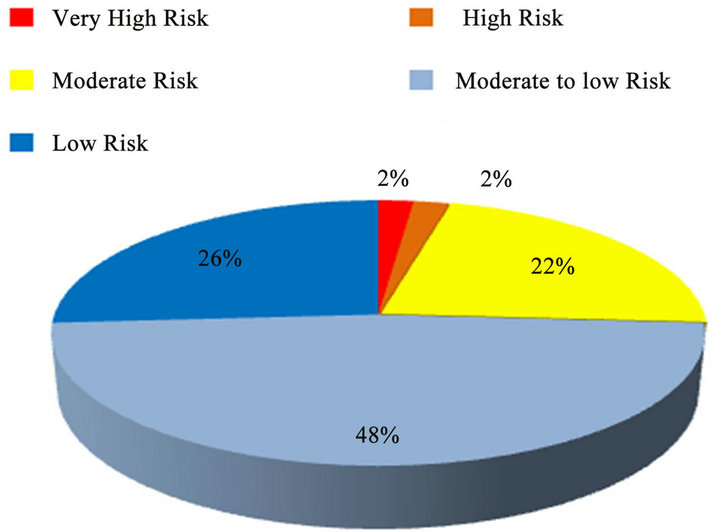
Figure 14. WSRF ranges for main watersheds draining towards Sinai coast taken peak discharge risk.
was noticed that the drainage basin slope has a great effect on the floods generated peak time followed by shape factor, correlation of 1/D is positive, which is opposite to what was expected, and this is because watersheds with small areas have higher drainage density, Figure 12, and to overcome this, streams threshold had to be reduced and this led to long processing time. Therefore 1/D SRF is neglected in WSRF calculation in this work.
The weight coefficients were calculated as explained before; Table 8 represents the final weights assigned to each risk factor with total summation of 1. Standardized Risk Factors were recalculated and WSRF were estimated using these weight coefficients. Table 9 shows sample of SRF calculations results with respect to the peak flow time risk.
Figure 15 represents the main watersheds flowing through Sinai Peninsula, with different colours each representing the risk level of the watershed, WSRF, as computed by Equation (8).
The analysis showed that the flood risk factor for main watersheds flowing through Sinai Peninsula could be classified into 5 categories according to their WSRF, Figure 16.
6.1.3. Overall Risk
To combine both effects of peak discharge value and time to peak risk for flash flood risk assessment of the study area, the maximum value of WSRF due to peak discharge and WSRF due to time to peak is considered as the overall WSRF (Table 10).
 (11)
(11)

Table 6. The standardized risk factor for peak discharge risk (SRFQn).

Table 7. Correlation between time to peak and SRF values.
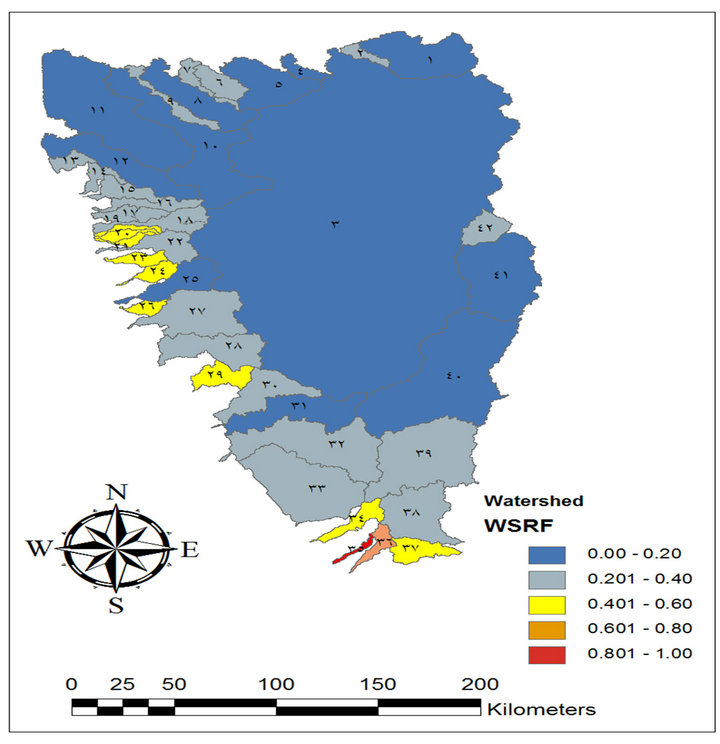
Figure 15. Weighted risk map for main watersheds draining towards Sinai coast, with respect to the peak flow time.
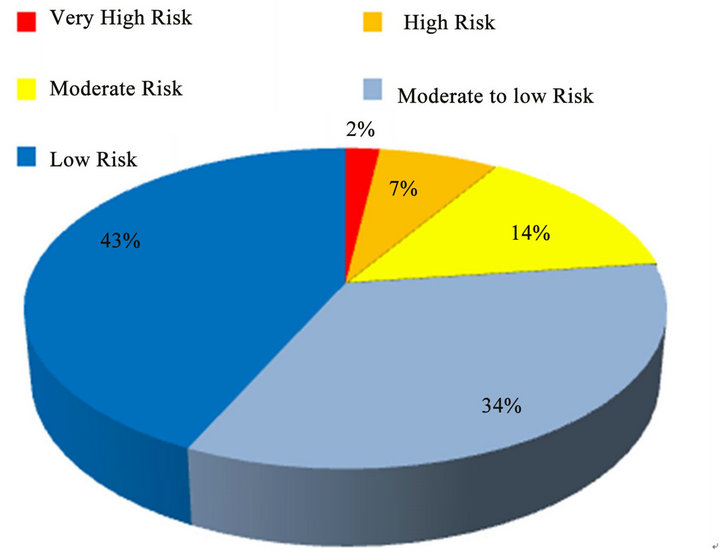
Figure 16. WSRF ranges for main watersheds draining towards Sinai coast.
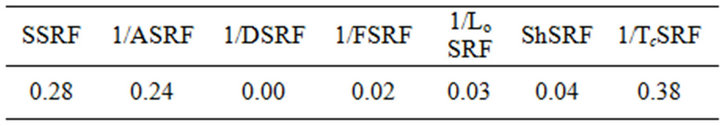
Table 8. The weight coefficient (W).
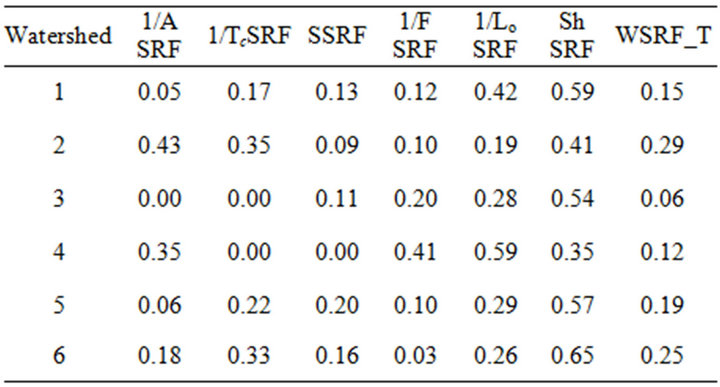
Table 9. The standardized risk factor due to time to peak risk (SRF).
Figure 17 represents the main watersheds flowing through Sinai Peninsula, with different colours each representing the overall risk level of the watershed, WSRF, as computed by Equation (10). The analysis showed that the flood risk factor for main watersheds flowing through Sinai Peninsula could be classified into 4 categories according to their overall WSRF, Figure 18.
7. Conclusions and Recommendations
Flood protection measurements depending solely on recurrence interval have been adopted for long time without giving weight to the morphological parameters of the watersheds that cause such floods. The work presented the use of multi criteria analysis technique to develop a risk factor when defining flood events.
Based on the analysis results the following conclusions were obtained:
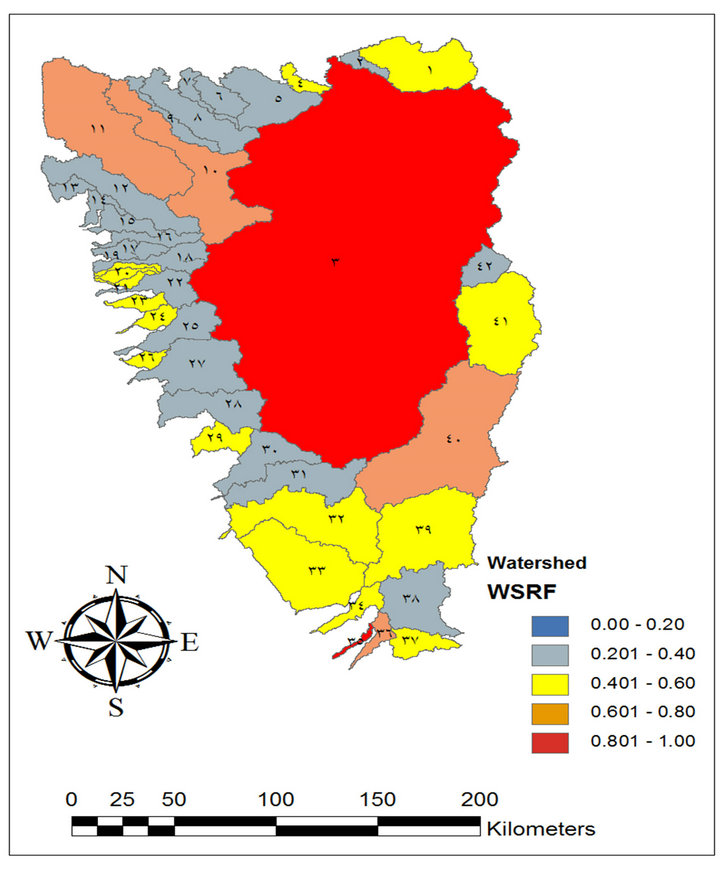
Figure 17. weighted risk map for main watersheds draining towards Sinai coast.
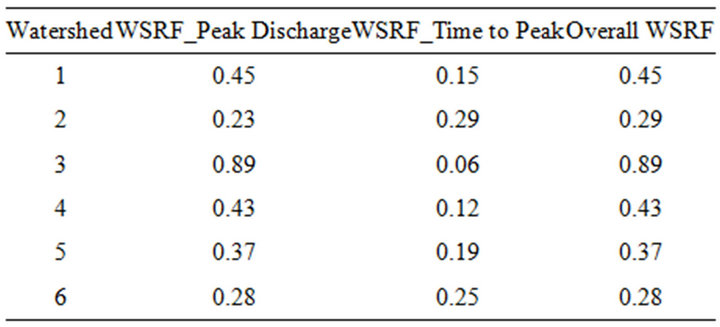
Table 10. Overall weighted standardized risk factors (WSRF) sample.
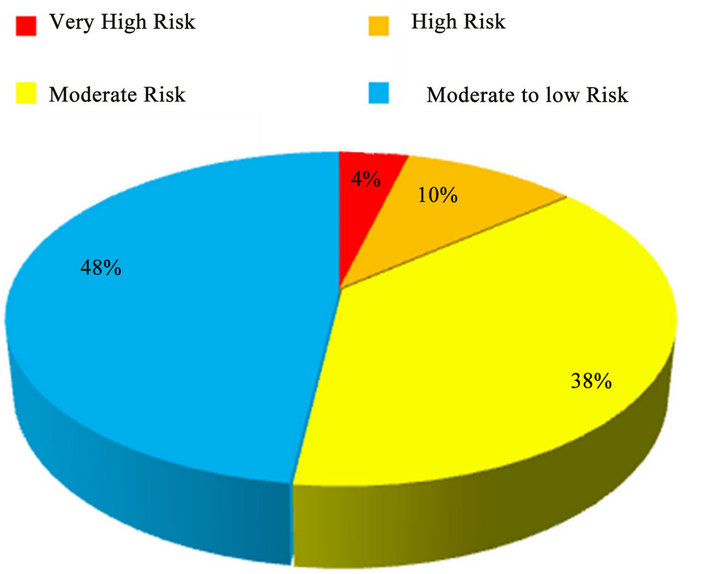
Figure 18. Overall WSRF ranges for main watersheds draining towards Sinai coast taken discharge and time risk.
1) A new criterion was used to evaluate the risk factor for the floods in Sinai. This criterion could be used in other places with similar characteristics.
2) The main watersheds flowing through Sinai Peninsula are classified into four categories where 4% of watersheds have very high risk, 10% has high risk, 38% has moderate risk and 48% has moderate to low risk.
3) The produced risk map is helpful to know the locations that have high flood risk in order to prevent loss of life and minimize damages to property.
4) The drainage basin area is the morphological parameter that has the highest effects on the peak floods generated followed by time of concentration and slope; other factors have less effect such as the shape factor, drainage frequency, drainage density and surface runoff length.
5) The drainage basin slope is the morphological parameter that has the highest effect on the time to peak followed by the shape factor.
It is also recommended to use the Weighted Standardized Risk Factor (WSRF) obtained during the design of flood protection measurements and/or the calculation of design peak flows for crossing structures. This may lead to more economic design procedure that can be adopted in drainage design guidelines and manuals. Studies should be carried out to investigate how to implement these results in the design procedure.
REFERENCES
- I. Z. El-Shamy, “New Approach for Hydrological Assessment of Hydrographic Basins of Recent Recharge and Flooding Possibilities,” 10th Symposium Quaternary and Development, Egypt, 18 April 1992, p. 15.
- A. M. Elmoustafa, “Weighted Normalized Risk Factor for Floods Risk Assessment,” Ain Shams Engineering Journal, Vol. 3, No. 4, 2012, pp. 327-332
- Resources Technology Company, “Flash Flood Risk Assessment for Area from Marsa Alam to Ras Banas Report,” 2008.
- A. M. Youssef and M. A. Hegab, “Using Geographic Information Systems and Remote Sensing Techniques for Investigation of New Proposed Sohag-Hurghada Highway across the Egyptian Desert,” 2005.
- M. G. El-Behiry, A. Shedid, A. Abu-Khadra and M. ElHuseiny, “Integrated GIS and Remote Sensing for Runoff Hazard Analysis in Ain Sukhna Industrial Area,” Egypt, 2005.
- M. L. El-Rakaiby, “Drainage Basins and Flash Flood Hazard in Selected Parts of Egypt,” Egyptian Journal of Geology, Vol. 33, No. 1-2, 1989, pp. 307-323.
- R. E. Horton, “Drainage Basin Characteristics,” Transactions—American Geophysical Union, Vol. 13, 1932, pp. 350-361. doi:10.1029/TR013i001p00350