Advances in Materials Physics and Chemistry
Vol.05 No.10(2015), Article ID:60668,12 pages
10.4236/ampc.2015.510043
Flux Pinning in Y- and Ag-Doped MgB2
Jack Dyson1, Daniele Rinaldi1, Gianni Barucca1, Gianni Albertini1*, Simone Sprio2, Anna Tampieri2
1SIMAU, Università Politecnica delle Marche, Ancona, Italy
2Institute of Science and Technology for Ceramics, National Research Council, Faenza, Italy
Email: *albertdom@vodafone.it
Copyright © 2015 by authors and Scientific Research Publishing Inc.
This work is licensed under the Creative Commons Attribution International License (CC BY).
http://creativecommons.org/licenses/by/4.0/


Received 24 August 2015; accepted 25 October 2015; published 28 October 2015
ABSTRACT
High temperature superconductor research is presently concentrated upon the flux pinning pro- perties of the Abrikosov lattice of the mixed-mode superconducting phase. The temperature ther- mal fluctuations, current and magnetic field unpin the flux vortices and so cause electromagnetic resistivity in high temperature superconductors. Materials with higher vortex pinning exhibit less resistivity and are more attractive for industrial uses. In the present article, we measured and correlated the pinning flux energy barrier, determined by AC magnetic measurements, and trans- mission electron microscopy measurements to the critical current Jc in Yttrium- and Silver-doped MgB2 superconductors. The energy of the flux vortex was evaluated as a function of the magnetic field. The energy barrier curves suggest an optimal doping level to occur in doped materials. This result only depends on the optimal size and distribution of precipitates, and not on their chemical composition. The energy barriers have been compared with that of undoped MgB2 in literature.
Keywords:
Flux Pinning, AC Magnetic Measurements, Critical Current, Yttrium-Doping, Silver-Doping, MgB2 Superconductors, Transmission Electron Microscopy, X-Ray Diffraction

1. Introduction
Magnesium diboride MgB2 BCS-type superconductors (SCs) are widely used in sensors, electric power appli- cations and electronic devices. In fact, even though their critical temperature
 is lower than in tra- ditional cuprate SCs, their upper critical field
 is actually higher while an operating temperature of
 is relatively easy to reach using liquid hydrogen or cryocoolers. The absence of weak links in the matrix (no inter-granular obstacles impede current flow) as well as a strong coupling between grains makes MgB2 very useful in technological applications [1] . The possible enhancement of the critical temperature and the improvement of the existing high levels of transport current are therefore important topics for this material. On the other hand, the low density of the pure compound and the relative scarcity of pinning centres, actually reduce the sustainable current density in high magnetic fields.
The metal-like structure of MgB2 at room temperature makes it ideal for applications in engineering contexts unlike the cuprate SCs, which exhibits a non-metallic behaviour at room temperature. The latter fact limits the technological applications of cuprate due to difficulties associated with the material processing. As an example, MgB2 can be readily transformed into wires and tapes whereas the well-known cuprate YBCO needs to be deposited onto wires through specifically settled processes.
Superconductivity in MgB2 is based on two differing mechanisms due to its electronic structure. MgB2 has strong
 bonds in the B planes and weak
 bonds in between them. Phonon modes in the Boron planes have a dominant effect due to strong electron-phonon
 coupling [2] [3] , which results in the formation of strong electron pairs confined to the planes. It is related to a complicated Fermi surface, with two superconduct- ing bands, which induces a strongly anisotropic conductivity in the lattice structure. The two bands produce different levels of superconductivity, the intra-planar variant being the weaker, leaving a particularly large conductivity in the Boron ab-plane. The high critical temperature
 of MgB2 is due to the electron-phonon coupling in the plane [4] where the inter- and intra-band scattering effects tend to reduce the
 value [4] [5] .
The complicated dual band superconductivity structure of MgB2 affects the main superconducting parameters like the irreversibility field,
 , the upper critical field
 , the critical superconducting temperature
 and, importantly, also the critical current
 [6] [7] . In order to increase the values of the last two parameters, the introduction of controlled amounts of doping agents is an interesting procedure: in past experiments, the critical superconducting field was observed to rise but the critical temperature remained idle [7] . To the best of our knowledge, increase of
 induced by doping MgB2 was only reported in the high field case of nano-C doped MgB2 [8] .
Conversely, it was found that the critical current could be modified through doping. Indeed, in MgB2 the current flow is not governed by the weak link mechanism and hence the vortex dynamics alone determines the value of . Compounds like Nb3Sn support a higher
 [9] because factors like mass density, packing fraction and connectivity as well as impurities like MgO play a major enhancing role in the material. In type II SCs, operating in the mixed regime, the Abrikosov flux lattice can be driven by the electric field, which induces a backward electromotance, dissipating power as the flux changes through the circuit. In such complicated scenarios, thermally activated flux flow (TAFF) and flux creep have been observed [10] . The remedy to this is the introduction of pinning centres locking the flux vortices with a potential thus allowing the critical current to increase. Different types of pinning centres can be introduced, e.g. grain boundaries, point defects as well as impurities and lattice variations brought on by doping [8] .
In order to make the formation of pinning centres effective to increase , they should exhibit sizes as large as the coherence length [8] . In MgB2 it is valued in the range between 2 and 10 nm [8] [11] . Zehetmayer et al. [7] report that neutron radiation induces defects of about 5 - 10 nm in size, thus creating pinning centres that in- fluence mainly the intra-band
 scattering. Compared to the alternative Carbon doping, neutron irradia- tion seems an efficient method for adding pinning centres into the material. Since grain boundaries also act as pinning centres, the decreasing grain dimensions improve the critical current. Beside the pinning centres, the densification of the compound in general enhances the superconducting state.
For MgB2 in particular, good results in
 enhancement have been obtained by the use of doping agents. Different elements have been used so far, spanning from rare-earths to magnetic elements as well as Silicon [5] [12] [13] . The best results are obtained when Carbon substitutes Boron. Carbon is an electron donor that can influence the Fermi surface of the MgB2 lattice. The result is a significant enhancement of
 and
and
 through enhanced intra-band scattering [7] . The Carbon substitution in the Boron layer causes an in-plane lattice distortion, tending to reduce the coherence length.
 and
and
 actually increase owing to the extra intra- band scattering in
 and
and
 orbitals. This improves the flux pinning in high fields and in turn
 when the doping levels are optimal [11] [14] . Unfortunately, these gains were accompanied by a lowering of
 .
.
Alternatively, SiC doping causes lattice distortion as well dislocation, which in turn acts as pinning centres [15] [16] . Good results have been obtained also by means of graphene doping [16] [17] .
Improvement of
 can also occur without ion substitution in the MgB2 lattice. In this respect,
 values higher than in pure sample were found in Cu-doped samples, due to the formation of an additional MgCu2 phase that acted as pinning centres [18] [19] . If, on the contrary, substitution of Magnesium with Copper occurs, a hole-donor compound is obtained, which produced an unexpected reduction in
 [20] [21] . Also Silver doping in MgB2 yielded an increase of the critical current, due to the formation of MgAg nanoparticles that acted as pinning centres [22] - [24] .
On the basis of these previous investigations, it can be concluded that, since
 depends on the vortex dynamics, a high flux pinning efficiency is fundamental in sustaining high levels of critical current.
This paper studies the behaviour of the vortex pinning potential (barrier) in Magnesium diboride doped with Silver or Yttrium, a hole and an electron donor, respectively. Samples are prepared by means of hot isostatic pressing (HIP) or uniaxial hot pressing (UHP) techniques, respectively. The correlation between structural properties and performance, in terms of critical current, was analysed in order to elucidate the importance of pinning centres in doped MgB2. In particular, scope of this work is to clarify the influence of Silver and Yttrium doping agents (at our best knowledge the latter was rarely studied) on the height of the vortex energy barrier. This last is a fundamental property for improving the superconducting critical current in the presence of external magnetic fields. Moreover, the model used to evaluate the flux energy barrier proved to be a convenient tool for the analysis and the comprehension of the Jc magnitude in relation with structural parameters. In fact, non linear and complex phenomena involved in the depinning mechanism need special care in the data analysis.
In a previous study of MgB2 [23] , it was discussed that the sample purity and density were not directly related to the superconducting properties, while the pinning centres were suggested to play a fundamental role. Interest- ing results in this sense were obtained with small amounts of Ag and Y doping. In order to make this last point clear, our results are compared with those reported in literature in the case of undoped MgB2 samples, either synthesized as bulk or as film.
2. Experimental
UHP (Y-doped) and HIP (Ag-doped) techniques have been used to obtain consolidated MgB2 bulk samples. The UHP (Uniaxial Hot Pressing) samples were prepared as follow, magnesium, boron and yttrium powders in the composition Mg1−xYxB2, have been heated in vacuum at a rate of ~25 K/min up to the sintering temperature of 1373 K. At T = 773 K, a pressure of 30 MPa was applied and kept constant. The sample was kept at the final temperature for 20 min and then spontaneously cooled up to ambient temperature under vacuum. No pressure is applied during the cooling. The HIP (Hot Isostatic Pressing) samples were prepared starting from the composition Mg1−xAgxB2. At first, a pressure of 150 MPa in inert atmosphere was applied, followed by a cold isostatic pressing at 300 MPa. The pellets were then encapsulated under vacuum prior pressure-heating treatments. Pressure and temperature were increased to reach the final value simultaneously (150 MPa and 1073 K, for 1 hour). Then the samples spontaneously cool under high pressure until the temperature of 373 K, then the pressure was lowered up to atmospheric pressure.
These complex preparation techniques are explained in detail in Ref. [23] . The samples are listed in Table 1. Once manufactured, the samples were structurally characterized by X-ray diffraction (XRD) using a Bruker D8 Advance diffractometer (operating with a Cu-Kα radiation source) together with transmission electron micro- scopy (TEM), carried out on a Philips CM200 electron microscope operating at 200 kV. For TEM observations, the samples were prepared by scraping small amounts of powder from each pellet over carbon coated copper grids.

Table 1. Studied samples with molar composition and preparation technique.
The AC magnetic measurements were carried out on a Quantum Design PPMS system. Complex magnetic susceptibility data were collected as a function of temperature by applying a static field (varying from 1.5 to 7.0 T), being the AC field fixed at 1 Oersted, with frequency (f) varying from 100 Hz to 10 KHz for each applied static field. The nonlinear complex susceptibility has been measured up to the third harmonic for each measuring frequency. These experimental measurements are fitted using nonlinear numerical analysis (see appendix) and values for the flux pinning potential (energy barrier) calculated in each case [22] [25] - [28] . These were grouped according to the applied field for each case of Y and Ag doping.
3. Results and Discussion
X-ray patterns recorded for the Ag- and Y-doped MgB2 samples are reported in Figure 1. In the whole range of investigation, no significant change of MgB2 lattice parameters was found, within experimental error. Thus we concluded that no substitutions occurred in the MgB2 unit cell.
 (a)
(a)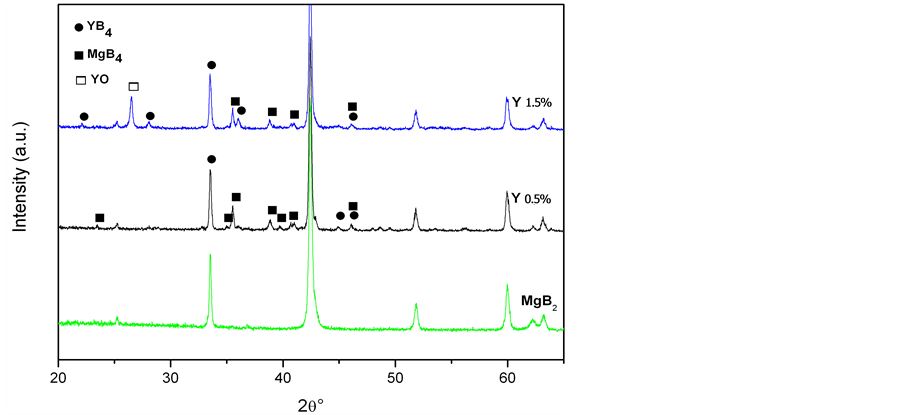 (b)
(b)
Figure 1. X-ray patterns of Ag-doped (a) and Y-doped (b) MgB2 samples. A re- ference scan from an undoped MgB2 sample (prepared by HIP) is also reported.
All the diffraction peaks of the undoped sample are attributed to pure MgB2 and MgO compounds while addi- tional peaks are observed in the doped samples.
For the Ag-doped samples, the increase in Ag concentration caused the Mg peaks to disappear while the phase Ag-Mg, presents as ε’-Ag0.24Mg0.76 (ICDD card number 39-0992) in the AG1 sample, as ε’-Ag0.24Mg0.76 and ε-AgMg3 (ICDD card number 39-0991) in AG5, becomes AgMg3 (ICDD card number 01-1170) in the AG20 sample. Furthermore, the presence of metallic Ag was found to increase with the amount of Ag intro- duced in the MgB2 matrix. The mean dimension of the Ag-Mg grains evaluated through the Scherrer formula was 9 ± 1 nm for the AG1 sample, 10 ± 1 nm for AG5 and 13 ± 1 nm for AG20.
In the Y-doped samples, X-ray measurements showed the presence of MgB4 (ICDD card number 73-1014) and YB4 (ICDD card number 79-1992) phases in addition to MgB2 and MgO. The intensity of MgB4 peaks remained unchanged with the Yttrium content, whereas those belonging to YB4 increased. The evaluated average grain size of MgB4 was the same for both Y05 and Y15 samples: d = 54 ± 1 nm. The average grain size of YB4 was 13 ± 3 nm for Y05 and 38 ± 2 nm for Y15.
Better results in XRD analysis with respect to a previous work [23] are due to the improved instrument re- solution. The sample Y10 could not be analysed by XRD but this deficiency does not invalidate the conclusions of the present work, as highlighted in the following discussion.
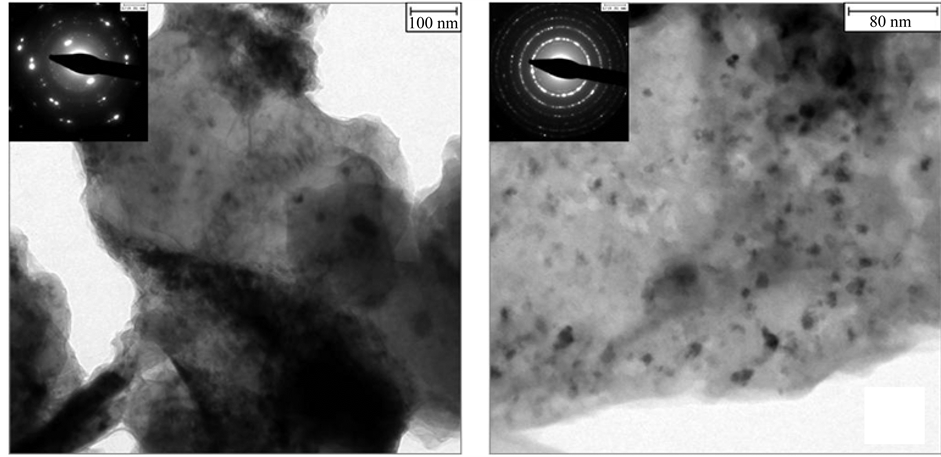
Transmission Electron Microscopy (TEM) analyses of Ag- and Y-doped samples confirmed the results of X-ray analysis and show the presence of precipitates outside the MgB2 grains. In particular two bright field images for sample AG5 are given in Figure 2. Small dark precipitates of size ranging from 10 nm to 20 nm are also easily visible. The corresponding electron diffraction patterns are shown in the insets. Diffraction spots and rings can be attributed to the presence of the MgB2 lattice and Magnesium-Silver phases (it was not actually possible to distinguish between Ag or Mg3−xAgx by TEM diffraction analyses).
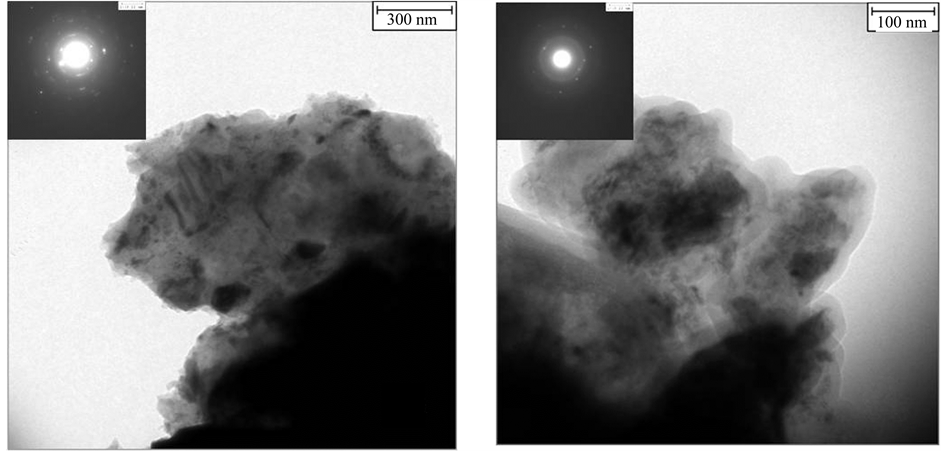
Figure 3 shows two bright field images of the Y-doped sample Y15. Small dark precipitates having sizes ranging from few nanometres to a few tens of nanometres are visible. The diffraction images related to these areas indicate the presence of MgB4 and YB4 phases (it was not possible to distinguish between the two phases).
The values of
 and
and
 were measured through the AC complex magnetic susceptibility [23] . From these parameters the ability of the material to support the superconducting state can be inferred. A measure of the quality of a superconductor is the transition ratio, TR (defined as
 where
where
 is the transition width, for more details see Ref. [21] ). A further parameter is the ratio
 , with
 .
.
According to Table 2, the Ag- and Y-doped samples have relatively good performances as superconductors
 (a) (b)
Figure 2. (a) Sample AG5 seen as a TEM image and as a diffraction pattern (inset). (b) Sample AG5 seen as a TEM image and as a diffraction pattern (inset) at around twice the magnification of image (a).
 (a) (b)
Figure 3. (a) Sample Y15 seen as a TEM image and as a diffraction pattern (inset); (b) Sample Y15 seen as a TEM image and as a diffraction pattern (inset) at around thrice the magnification of image (a).
Table 2. Superconductor behaviour parameterised according to the Tc, TR and ΔT200 indices.
and the two groups show similar behaviour albeit at different levels. In particular, the critical temperature is comparable to those reported in literature for MgB2 superconductors.
The critical current was valued by means of AC magnetic susceptibility as a function of temperature in a range just below the critical temperature in absence of a DC applied field. Overall trends in
 for various samples are shown in Figure 4. In terms of the absolute temperature, the Y-doped group obtained better perfor- mance. No major difference in absolute current has been detected among the Y-doped samples but degradation is evident in the AG20 sample among the Ag-doped samples.
For a deeper understanding of the critical current behaviour, we consider the pinning mechanism in the super- conducting regime and compute the energy barrier for the pinning, especially when an external field is applied. In this framework the higher the flux pinning barrier, the higher the maximum current the sample will support. In fact, when the magnetic flux detaches, the Lorentz forces induce a finite resistivity, which destroys the super- conducting state. In this context different models based on the complex magnetic AC susceptibility measure- ments in presence of applied external fields have been proposed. Zazo et al. valued the activation energy for the flux by applying the Arrhenius law [26] . For a YBaCuO polycrystalline sample, they reported an activation energy varying from 3.41 to 1.41 eV; in this respect the Arrhenius law turned out to be too simple to correctly interpret the complex flux dynamics of the system in our case.
In order to improve the analysis, Qin et al. [27] suggested that the dependence of the flux creep activation
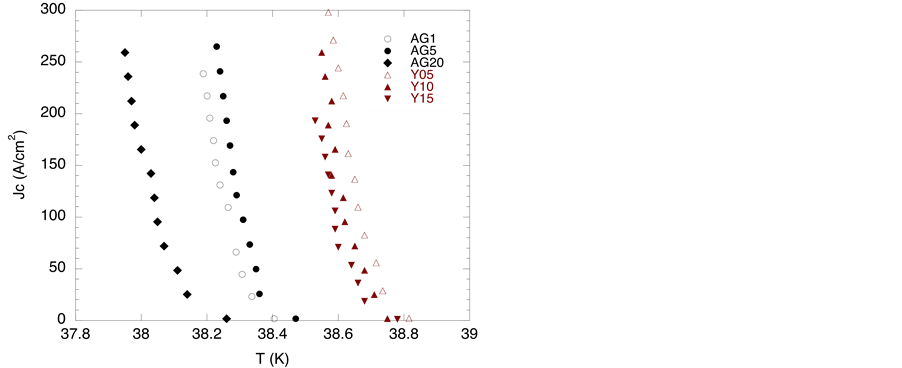
Figure 4. The critical current derived from AC susceptibility measurements plotted as a function of the temperature.
energy upon applied magnetic field follows a power law and proposed the following mathematical model:
 (1)
(1)
where
 is the flux pinning energy barrier,
 is the applied magnetic induction,
 (2)
(2)
is the critical current evaluation according to the Bean critical state model [23] [29] ,
 is the measuring field, d is the sample half-thickness, U(T) is a temperature scaling function
 (3)
(3)
and
 is the irreversibility temperature to be determined from the data.
On the left hand side of Equation (1), f is the measurement frequency and
 is the inverse of the cha- racteristic time scale.
Amalgamating these expressions gives the experimental relationship:
 (4)
(4)
where
 and
and

T is set to , the temperature at which the maximum in the imaginary part of the complex susceptibility occurs [27] . In fact at this temperature the complete flux penetration is established for every tuple
 [29] . At this point it is sufficient to set the value of
 to the onset temperature of third susceptibility harmonic valued at the higher frequency [28] . Equation (4) is linear with respect to
 , plotting it in the
 plane at constant
 . Unfortunately, using Equation (4), as a model with the present data, does not satisfactorily produce the expected straight line with slope
 and intercept
 .
.
Ghigo et al. [28] suggested the modified equation which we adopt here:
 (5)
(5)
Setting
 and
and
 we obtain:
 (6)
(6)
The experimental x values are calculated with
 as above. The equation above is fitted using a non- linear algorithm to
 data to get values for
 and
and
 (see Appendix). Applying this model a satis- factory fit is obtained: the graph in Figure 5 is a plot of this fitted curve for different field levels for the 20% Ag doping.
In Figure 6 the valued
 are plotted as a function of applied field.
The phenomenological data analysis procedure described above gives the simplest, most reliable impression of how doping influences the energy barrier variation supported by the data.
Both for Yttrium and Silver a decrease of U0 barrier is observed at increasing applied magnetic field. At a fixed field, the U0 values do not always increase with increasing concentration of dopant, thus indicating that
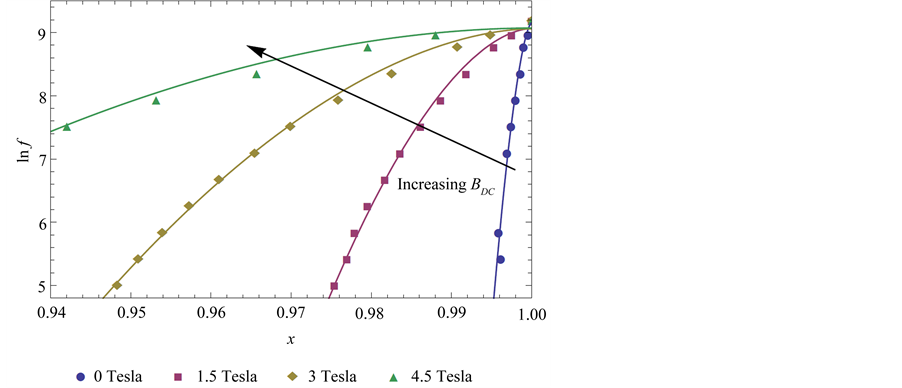
Figure 5. The frequency logarithm (ln f) of the measurement AC magnetic field plotted against x (as defined in the text). The power law (7) is fitted to x valued from the experimental data. The fit concerns the 20% Ag doped MgB2 sample at different DC field: BDC field is expressed in Tesla.

 (a) (b)
Figure 6. The energy barrier variation U0 with applied DC field across each doping series (the zero field point omitted due to low confidence). (a) Ag series. (b) Y series.
optimal concentrations for obtaining high barriers occurs.
The data in Figure 6 resemble a power law: however, at high field values the samples exhibit the same behaviour regardless of doping content.
These experiments suggest the occurrence of a maximum doping level in a type II superconductor for the optimal flux pinning properties―a possible consequence of which is the maximum sustainable
 for the material.
No significant improvements have been detected in
 although the doped samples exhibit high
 (rang- ing from 38.85 K to 38.38 K). As outlined in the introduction, the value of
 depends on the electron-phonon coupling as well as the intra- and inter-band scattering and electron density.
The values of
 and
and
 could change in principle when Y substitutes for Mg because Y is an electron donor. In our case, although there is no experimental evidence for Mg substitution in the crystalline structure, the critical current is affected by the introduction of Ag or Y. This can be explained in terms of the formation of pinning centres. In fact both the X-ray and TEM analyses demonstrated the existence of non-superconducting precipitates, with dimensions in the range 2 to 10 nm; exactly those required to act as efficient pinning centres [7] [8] . In the Y-doped samples, among the other precipitates with higher dimensions, the mean radius for the YB4 is 13 ± 3 nm for the sample at 0.5% doping, increasing up to
 nm for 1.5% doping.
In the Ag-doped samples we detected in MgB2 doped at 1% Ag nanometric precipitates of MgO and AgxMg3−x. These precipitates, having a mean radius of 9 ± 1 nm, tend to become larger with Ag concentration (D = 10 ± 1 nm in AG5 and d = 13 ± 1 nm in AG20) and moreover will transform into the AgMg3 phase. The precipitate size increases with the dopant concentration for both types of dopant.
The behaviour of the calculated energy barrier is in agreement with the hypothesis concerning the role played by pinning centres. The Y doping is more effective than Ag at very low dopant concentration and low fields. In all cases the pinning barrier decreases rapidly with the field.
The MgB2 doped at 0.5% Y has a possible YOx phase as well as a better distribution of pinning centres compared with the sample doped at 1.5% Y which has larger YB4 precipitates. Both of these contain MgO and MgB4.
In the case of the Ag-doped samples, increasing concentration of Ag increases the number of precipitates such as Ag-Mg of appropriate size to act as pinning centres. By exceeding a certain value of the concentration of Ag, precipitates tend to grow (in size, but probably also in density) losing their effectiveness as pinning centres. The energy barrier variation for both types of doping follows a similar trend.
The effectiveness of doping to increase the energy barrier is deduced after comparing these experimental data with those obtained from undoped MgB2 samples reported in literature. In MgB2 film [30] , U0 is about 0.9 eV for magnetic field in the range 0 - 1 T, decreasing down to 0.08 at about 7 T. The data have been valued by fitting r to the Arrhenius law. In bulk MgB2 Jin et al. valued U0 ranging from 0.6 eV to 0.25 eV at 0.5 and 1 T respectively, by means of current measurements [31] . Senatore et al. compared the experimental results of AC measurements in Bulk MgB2, with susceptibility curves obtained by numerical calculations, assuming a non- linear diffusion equation for the magnetic field. They obtained good results fitting with U0 = 0.7 eV at 0.02 T [32] . Although the reported data are obtained from different samples and different techniques, they confirm that the doping strongly modifies the barrier height. Moreover, at high field (7 - 9 T) Patnaik et al. found U0 about 0.17 eV [33] , in textured film which is comparable to the values presented in this work, thus confirming that at high field the studied pinning centres are less effective (see also above and Ref. [30] ).
Our data indicate a strong increase of the energy barrier in doped samples with respect to all these values obtained in the undoped samples, at least at low fields (less than about 5 T).
The obtained U0 values indicate an optimal doping level for both the dopants (about 5% for Ag and 0.5% for Y doping). The dopant excess degrades the samples and introduces disorder.
4. Conclusions
The Y and Ag doped MgB2 superconductors have been studied by means of magnetic, XRD and TEM measure- ments. The flux pinning energy barrier U0 has been evaluated and compared among the different samples. The energy barrier height U0 ranges from 3.5 to 6 eV for the Ag and Y doped samples respectively at low field and fast decreases with the applied magnetic field. The U0 values of undoped samples shown in the literature (lower then 1 eV at 1 T ) are lower with respect to the doped samples here reported (higher then about 2 eV at 1 T), thus putting in evidence the efficiency of doping, at least at low magnetic field (about 5 T), as explained in the discussion. Better performance levels were achieved in cases where doping was low. As the doping agents do not substitute Mg, the reported results can be considered a clue that efficiency of the pinning centres depends on their size and distribution. The detection of optimal doping levels can be related to the occurrence of optimal dimensions and distributions of the precipitates.
As Y-doping is rarely studied, this paper also reports useful information on that electron donor dopant.
Cite this paper
JackDyson,DanieleRinaldi,GianniBarucca,GianniAlbertini,SimoneSprio,AnnaTampieri, (2015) Flux Pinning in Y- and Ag-Doped MgB2. Advances in Materials Physics and Chemistry,05,426-438. doi: 10.4236/ampc.2015.510043
References
- 1. Chandrashekar, R.G., Tiwari, R.S., Srivastava, O.N. and Malik, S.K. (2007) Enhancement of Flux Pinning and High Critical Current Density in Graphite Doped MgB2 Superconductor. Journal of Applied Physics, 101, Article ID: 043906.
- 2. Buzea, C. and Yamashita, T. (2001) Review of the Superconducting Properties of MgB2. Semiconductor Science and Technology, 14, R115.
http://dx.doi.org/10.1088/0953-2048/14/11/201 - 3. Cheng, C.H., Zhao, Y., Zhu, X.T., Nowotny, J., Sorrell, C.C., Finlayson, T. and Zhang, H. (2003) Chemical Doping Effect on the Crystal Structure and Superconductivity of MgB2. Physica C: Superconductivity, 386, 588-592.
http://dx.doi.org/10.1016/S0921-4534(02)02167-6 - 4. Cohen, L.F., Bugoslavsky, Y., Perkins, G.K., Moore, J., Miyoshi, Y. and Caplin, A.D. (2004) Magnetic Properties of MgB2 in the Presence of Disorder. Physica C, 408-410, 628-631.
http://dx.doi.org/10.1016/j.physc.2004.03.087 - 5. Wang, X.-L., Dou, S.X., Hossain, M.S.A., Cheng, Z.X., Liao, X.Z., Ghorbani, S.R., Yao, Q.W., Kim, J.H. and Silver, T. (2010) Enhancement of the In-Field Jc of MgB2 via SiCl4 Doping. Physical Review B, 81, Article ID: 224514.
- 6. Kim, J.H., Dou, S.X., Oh, S., Jercinovic, M., Babic, E., Nakane, T. and Kumakura, H. (2008) Correlation between Doping Induced Disorder and Superconducting Properties in Carbohydrate Doped MgB2. Journal of Applied Physics, 104, Article ID: 063911.
http://dx.doi.org/10.1063/1.2980275 - 7. Zehetmayer, M., Krutzler, C., Eisterer, M., Jun, J., Kazakov, S.M., Karpinski, J. and Weber, H.W. (2006) Effect of Disorder on the Irreversible Magnetic Properties of Single Crystalline MgB2: Comparison of Carbon Doping and Neutron Irradiation. Physica C, 445-448, 65-68.
http://dx.doi.org/10.1016/j.physc.2006.03.079 - 8. Mudgel, M., Awana, V.P.S., Kishan, H. and Bhalla, G.L. (2008) Significant Improvement of Flux Pinning and Irreversibility Field in Nano-Carbon-Doped MgB2 Superconductor. Solid State Communications, 146, 330-334.
http://dx.doi.org/10.1016/j.ssc.2008.03.009 - 9. Scanlan, R.M., Fietz, W.A. and Koch, E.F. (1975) Flux Pinning Centers in Superconducting Nb3Sn. Journal of Applied Physics, 46, 2244-2249.
http://dx.doi.org/10.1063/1.321816 - 10. Patnaik, S., Gurevich, A., Bu, S.D., Kaushik, S.D., Choi, J., Eom, C.B. and Larbalestier, D.C. (2004) Thermally Activated Current Transport in MgB2 Films. Physical Review B, 70, Article ID: 064503.
http://dx.doi.org/10.1103/PhysRevB.70.064503 - 11. Shekhar, C., Giri, R., Tiwari, R.S., Srivastavaa, O.N. and Malik, S.K. (2007) Enhancement of Flux Pinning and High Critical Current Density in Graphite Doped MgB2 Superconductor. Journal of Applied Physics, 102, Article ID: 093910.
http://dx.doi.org/10.1063/1.2805650 - 12. Ojha, N., Varma, G.D., Singh, H.K. and Awana, V.P.S. (2009) Effect of Rare-Earth Doping on the Superconducting Properties of MgB2. Journal of Applied Physics, 105, Article ID: 07E315.
- 13. Zhou, S.H. and Dou, S.X. (2010) Properties of MgB2 Bulks after Combined Doping with Fe and C by Adding Iron(II) Lactate (C6H10FeO6). Solid State Sciences, 12, 105-110.
http://dx.doi.org/10.1016/j.solidstatesciences.2009.10.013 - 14. Jiang, C.H. and Kumakura, H. (2007) Stoichiometry Dependence of the Critical Current Density in Pure and Nano-SiC Doped MgB2/Fe Tapes. Physica C: Superconductivity, 451, 71-76.
http://dx.doi.org/10.1016/j.physc.2006.11.001 - 15. Dou, S.X., Pan, A.V., Zhou, S., Ionescu, M., Wang, X.L., Horvat, J., Liu, H.K. and Munroe, P.R. (2003) Superconductivity, Critical Current Density and Flux Pinning in MgB2-x(SiC)x/2 Superconductor after SiC Nanoparticle Doping. Journal of Applied Physics, 94, 1850.
http://dx.doi.org/10.1063/1.1586467 - 16. De Silva, K.S.B., Xu, X., Wang, X.L., Wexler, D., Attard, D., Xiang, F. and Dou, S.X. (2012) A Significant Improvement in the Superconducting Properties of MgB2 by Co-Doping with Graphene and Nano-SiC. Scripta Materialia, 67, 802-805.
http://dx.doi.org/10.1016/j.scriptamat.2012.07.014 - 17. De Silva, K.S.B., Xu, X., Gambhir, S., Wang, X.L., Li, W.X., Wallaceb, G.G. and Dou, S.X. (2011) Flux Pinning Mechanisms in Graphene-Doped MgB2 Superconductors. Scripta Materialia, 65, 634-637.
http://dx.doi.org/10.1016/j.scriptamat.2011.06.047 - 18. Tampieri, A., Celotti, G., Sprio, S. and Rinaldi, D. (2003) Effects of Cu and Other Metallic Dopings on the Superconducting Properties of MgB2. International Journal of Modern Physics B, 17, 438-445.
http://dx.doi.org/10.1142/S0217979203016078 - 19. Ma, Z.Q., Liu, Y.C., Han, Y.J., Zhao, Q. and Gao, Z.M. (2008) Variation of the Enhancement Mechanism in the Critical Current Density of Cu-Doped MgB2 Samples Sintered at Different Temperatures. Journal of Applied Physics, 104, Article ID: 063917.
http://dx.doi.org/10.1063/1.2982088 - 20. Medvedeva, N.J., Ivanovskii, A.L., Medvedeva, J.E. and Freeman, A.J. (2001) Electronic Structure of MgB2 and Related Binary and Ternary Borides. Physical Review B, 64, Article ID: 205020.
http://dx.doi.org/10.1103/PhysRevB.64.020502 - 21. Tampieri, A., Celotti, G., Sprio, S., Rinaldi, D., Barucca, G. and Caciuffo, R. (2002) Effects of Copper Doping in MgB2 Superconductor. Solid State Communications, 121, 497-500.
http://dx.doi.org/10.1016/S0038-1098(01)00514-2 - 22. Chandrashekar, R.G., Tiwari, R.S., Srivastava, O.N. and Malik, S.K. (2007) Enhancement of Flux Pinning and High Critical Current Density in Graphite Doped MgB2 Superconductor. Journal of Applied Physics, 101, Article ID: 043906.
- 23. Sprio, S., Rinaldi, D., Celotti, G., Pialorsi, E. and Tampieri, A. (2008) Structure and Superconducting Properties of Pure and Variously Doped Bulk MgB2 Obtained by Uniaxial and Isostatic Hot Pressing. Journal of Materials Science: Materials in Electronics, 19, 1012-1022.
http://dx.doi.org/10.1007/s10854-007-9443-x - 24. Akamaru, S., Ishikawa, F., Nishimura, K., Abe, T. and Matsuyama, M. (2013) Effects of Metal (Ag, Sn and Zn) Nanoparticles Inserted into MgB2 Grain Boundaries on Transport and Superconducting Properties. Materials Transactions, 54, 2258-2264.
http://dx.doi.org/10.2320/matertrans.M2013254 - 25. Anderson, P.W. and Kim, Y.B. (1964) Hard Superconductivity: Theory of the Motion of Abrikosov Flux Lines. Reviews of Modern Physics, 36, 39-43.
http://dx.doi.org/10.1103/revmodphys.36.39 - 26. Zazo, M., Torres, L., Iniguez, J., de Francisco, C. and Munoz, J.M. (1984) Study of the Frequency and Low-Field Dependence of AC Susceptibility in YBaCuO. Journal of Applied Physics, 76, 7133-7135.
Anderson, P.W. (1962) Theory of Flux Creep in Hard Superconductors. Physical Review Letters, 9, 309-311.
http://dx.doi.org/10.1103/PhysRevLett.9.309 - 27. Qin, M.J., Wang, X.L., Soltanian, S., Li, A.H., Liu, H.K. and Dou, S.X. () Dependence of the Flux Creep Activation Energy on Current Density and Magnetic Field for the MgB2 Superconductor. Physical Review B, 64, Article ID: 060505.
- 28. Ghigo, G., Botta, D., Chiodoni, A., Gerbaldo, R., Gozzelino, L., Laviano, F., Mezzetti, E. and Minetti, B. (2003) Pinning Energy and Vortex-Phase Diagram of MgB2 Bulk Materials. International Journal of Modern Physics B, 17, 584-589.
http://dx.doi.org/10.1142/S0217979203016273 - 29. Bean, C.P. (1962) Magnetization of Hard Superconductors. Physical Review Letters, 8, 250-253.
http://dx.doi.org/10.1103/PhysRevLett.8.250 - 30. Sidorenko, A., Zdravkov, V., Ryazanov, V., Horn, S., Klimm, S., Tidecks, R., Wixforth, A., Koch, T. and Schimmel, T. (2005) Thermally Assisted Flux Flow in MgB2: Strong Magnetic Field Dependence of the Activation Energy. Phylosophical Magazine, 85, 1738-1790.
http://dx.doi.org/10.1080/14786430500036678 - 31. Jin, H., Wen, H.-H., Yang, H.-P., Liu, Z.-Y., Ren, Z.-A., Che, G.-C. and Zhao, Z.-X. (2003) Rigid Vortices in MgB2. Applied Physics Letters, 83, 2626.
- 32. Senatore, C., Polichetti, M., Zola, D., Di Matteo, T., Giunchi, G. and Pace, S. (2003) Vortex Dynamics and Pinning Properties Analysis of MgB2 Bulk Samples by AC Susceptibility Measurements. Superconductor Science and Technology, 16, 183-187.
http://dx.doi.org/10.1088/0953-2048/16/2/310 - 33. Patnaik, S., Gurevich, A., Bu, S.D., Kaushik, S.D., Choi, J., Eom, C.B. and Larbalestier, D.C. (2004) Thermally Activated Current Transport in MgB2 Films. Physical Review B, 70, Article ID: 064503.
http://dx.doi.org/10.1103/PhysRevB.70.064503
Appendix
The quadruple
 are to be considered as fitting parameters. The equation is forward sensitive to the
 parameter and is better fitted using a backward optimisation algorithm with respect to this variable. Here again it is sufficient to set the value of
 to the onset temperature of third susceptibility harmonic valued at the higher frequency [28] ―removing one of the unknowns, leaving the triplet
 to determine for every data line. Choosing a particular data line, the second and third parameters are determined through “standard” nonlinear fit, while
 is seeded through a few preliminary tests (Equation (8) below indicates that in most cases the correct
 ).
).
The value of the fitted
 coefficient is then computed for the fit and tabulated. The operation is then repeated for other values of
 until a maximum
 case can be identified. That is taken to be the best fit for the data under consideration. There are sufficient data at every field and temperature value and this together with physical regularization permits a more than reasonable degree of confidence in this fitting system. In fact, for every line, {8, 32, 64, 128, 256} respective
 values are sampled to extract the best value. The answer always converges to a stable limit in every case.
Practically, there are two areas where problems can occur. The first is the intrinsic mathematical form. In practice the observed curvature, C, of the data points with respect to Equation (5) is small which implies that in Equation (6) one can perturb , and set:
 (7)
(7)
and expand the curvature function as a series:
 (8)
(8)
For
 and small
 the curvature:
 and varies directly as
 which is small
and approximately constant (for a given curve) in this temperature range. This range is exactly where the measurements are assumed to be taken and the low curvature exhibited by the data sets in turn limit the range for
 to small numbers. In fact a few numerical tests show that
 for every curve in the experi- ment.
These curves tend also to be a good guide to the reliability of the data itself. When for a data series the
 values are closely grouped the data set shows a higher continuity and greater physical plausibility. If an


 (a) (b)
Figure 7. An example of the α parameter backward optimisation process: the nonlinear fit residual R2 is maximised in every applied field case. (a) The α line grouping MgB2 doped with Ag at 20%―note that the α grouping is close for every applied field case; (b) The α line grouping MgB2 doped with Y at 0.5%―the anomaly in the set is the α value to the far right, not surprising as it is the line for zero applied field at this Y doping percentage.
value lies far outside the group then that data point would be an outlier and a value for
 developed from it might better be discarded or viewed at least with a certain degree of suspicion. In fact this situation happens for almost all the data series for the zero DC field plots (see Figure 7(b)).
Mathematically, that confirms the intuition that the three parameter nonlinear fit is a perturbation of Equation (5) in the irreversible temperature region and the relatively small values of y and
 probably mean that it is not too far from a convex optimisation problem. This hypothesis is supported by Figure 7. In fact as already stated, working with the data using this model it is possible to obtain good fits with consistent values for all the pa- rameters―if there are anomalies then they occur due to experimental issues as opposed to data analysis/extrac- tion.
NOTES

*Corresponding author.