World Journal of Neuroscience
Vol.3 No.3(2013), Article ID:34914,7 pages DOI:10.4236/wjns.2013.33019
Clinico-radiological dissociation in multiple sclerosis: Future prospects
![]()
Neurology Service, University Hospital Virgen del Rocio, Sevilla, Spain
Email: *elena.zpt@gmail.com
Copyright © 2013 Elena Zapata-Arriaza, María Díaz-Sánchez. This is an open access article distributed under the Creative Commons Attribution License, which permits unrestricted use, distribution, and reproduction in any medium, provided the original work is properly cited.
Received 8 April 2013; revised 20 May 2013; accepted 25 June 2013
Keywords: Multiple Sclerosis; Disability Progression; Magnetic Resonance Imaging; Diffusion-Tensor Imaging, Proton Magnetic Resonance Spectroscopic Imaging
ABSTRACT
Magnetic resonance imaging (MRI) has significantly contributed to our capabilities of diagnosis multiple sclerosis (MS) since it is able to detect demyelinating lesions in almost 100% of patients. However, there are modest correlations between irreversible disability and white matter lesion load, as measured by T2-weighted MRI scans, which represents the clinicoradiological paradox of MS. We report the case of a patient with MS and few neurological manifestations despite extensive T2 visible morphologic abnormalities. The use of non-conventional MRI techniques, which are more specific in the analysis of the pathological substrate of demyelinating lesions and normal appearing brain matter (both white and gray matter), might assist us to overcome this limitation of conventional MRI.
1. INTRODUCTION
Magnetic resonance imaging (MRI) has become an essential tool in the diagnosis of multiple sclerosis (MS) since it is able to demonstrate dissemination in space (DIS) and time (DIT) of demyelinating lesions and to rule out alternative diagnosis. Our ability to make an early diagnosis of MS in patients with clinically isolated syndromes (CIS) with the support of conventional MRI techniques has been strongly demonstrated. However, its role as a prognostic marker for disability progression is less clear. This is especially applicable to the T2 lesion volume, where studies have only shown modest clinicoradiological correlations [1-5].
2. CASE PRESENTATION
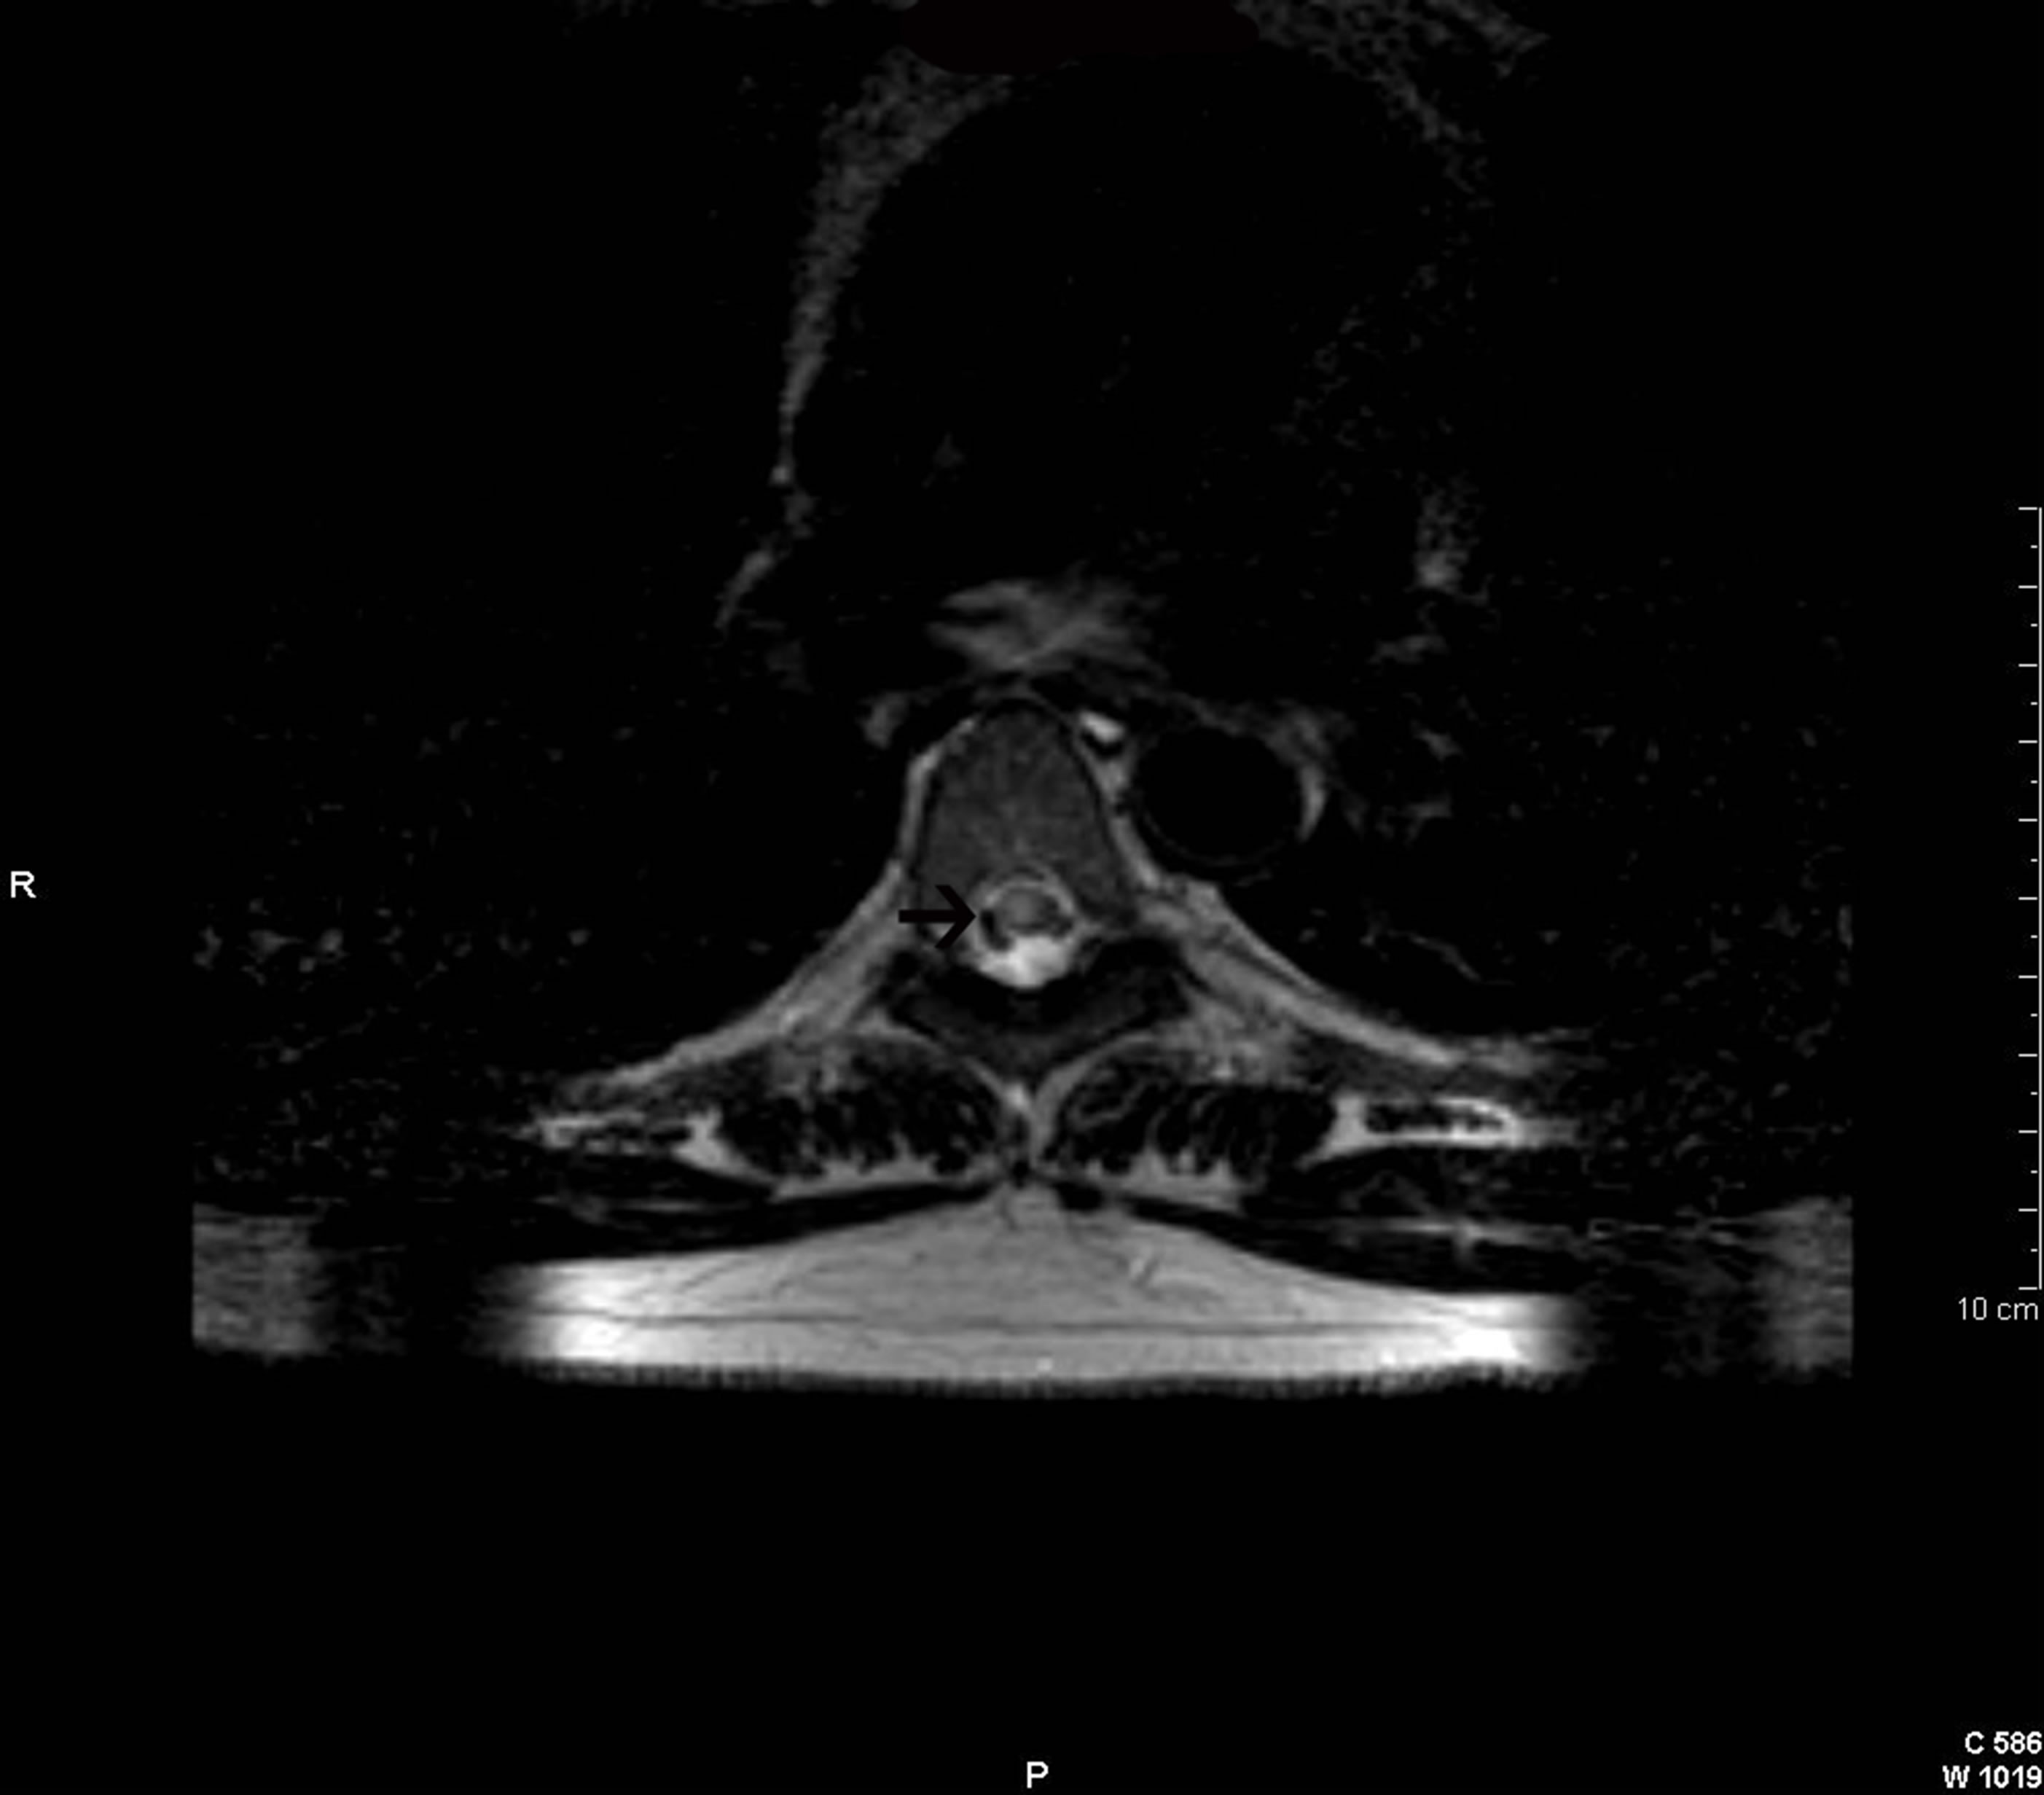
To illustrate the clinico-radiological dissociation of MS, we report the case of a patient of 46 years admitted to our hospital because of a progressive episode of dizziness, gait unsteadiness, and double vision. The patient had previously experienced neither fever nor signs of infection. She denied having contact with animals or having recently received vaccinations. As medical history, she had exclusively suffered an episode of left hemifacial hypoesthesia from which she recovered spontaneously two years ago. In addition, she refused toxic habits or to receive any treatment. She did not refer any other symptoms. The general examination on admission was normal. At neurological examination, left limb hyperreflexia and gait ataxia with positive Romberg sign were observed. We did not identify any nystagmus or ophthalmoparesis despite the binocular diplopia the patient mentioned. Cranial MRI was performed and showed multiple typical demyelinating lesions both in supratentorial and infratentorial regions Figures 1 and 2. These lesions tended to confluence in some localizations. The T2 lesion burden was high and lesions were extensively scattered throughout the periventricular and juxtacortical regions. The corpus callosum and posterior fossa were also affected. In isolation, few of these lesions appeared hypointense on T1-weighted images, and some showed gadolinium-enhancement Figure 3. In addition, cervical and dorsal spine MRI was carried out in which we observed a single demyelinating plaque extending between the D5-D6 levels. This spinal lesion did not show contrast enhancement Figure 4. Patient’s imaging study fulfilled the MRI criteria for DIS and DIT characteristic of MS and listed in the latest revision of the McDonald diagnostic criteria [6]. On the other hand, peripheral blood exam that included blood count, biochemistry, erythrocyte sedimentation rate (ESR), vitamins, thyroid hormones, long chain fatty acids, angiotensin converting
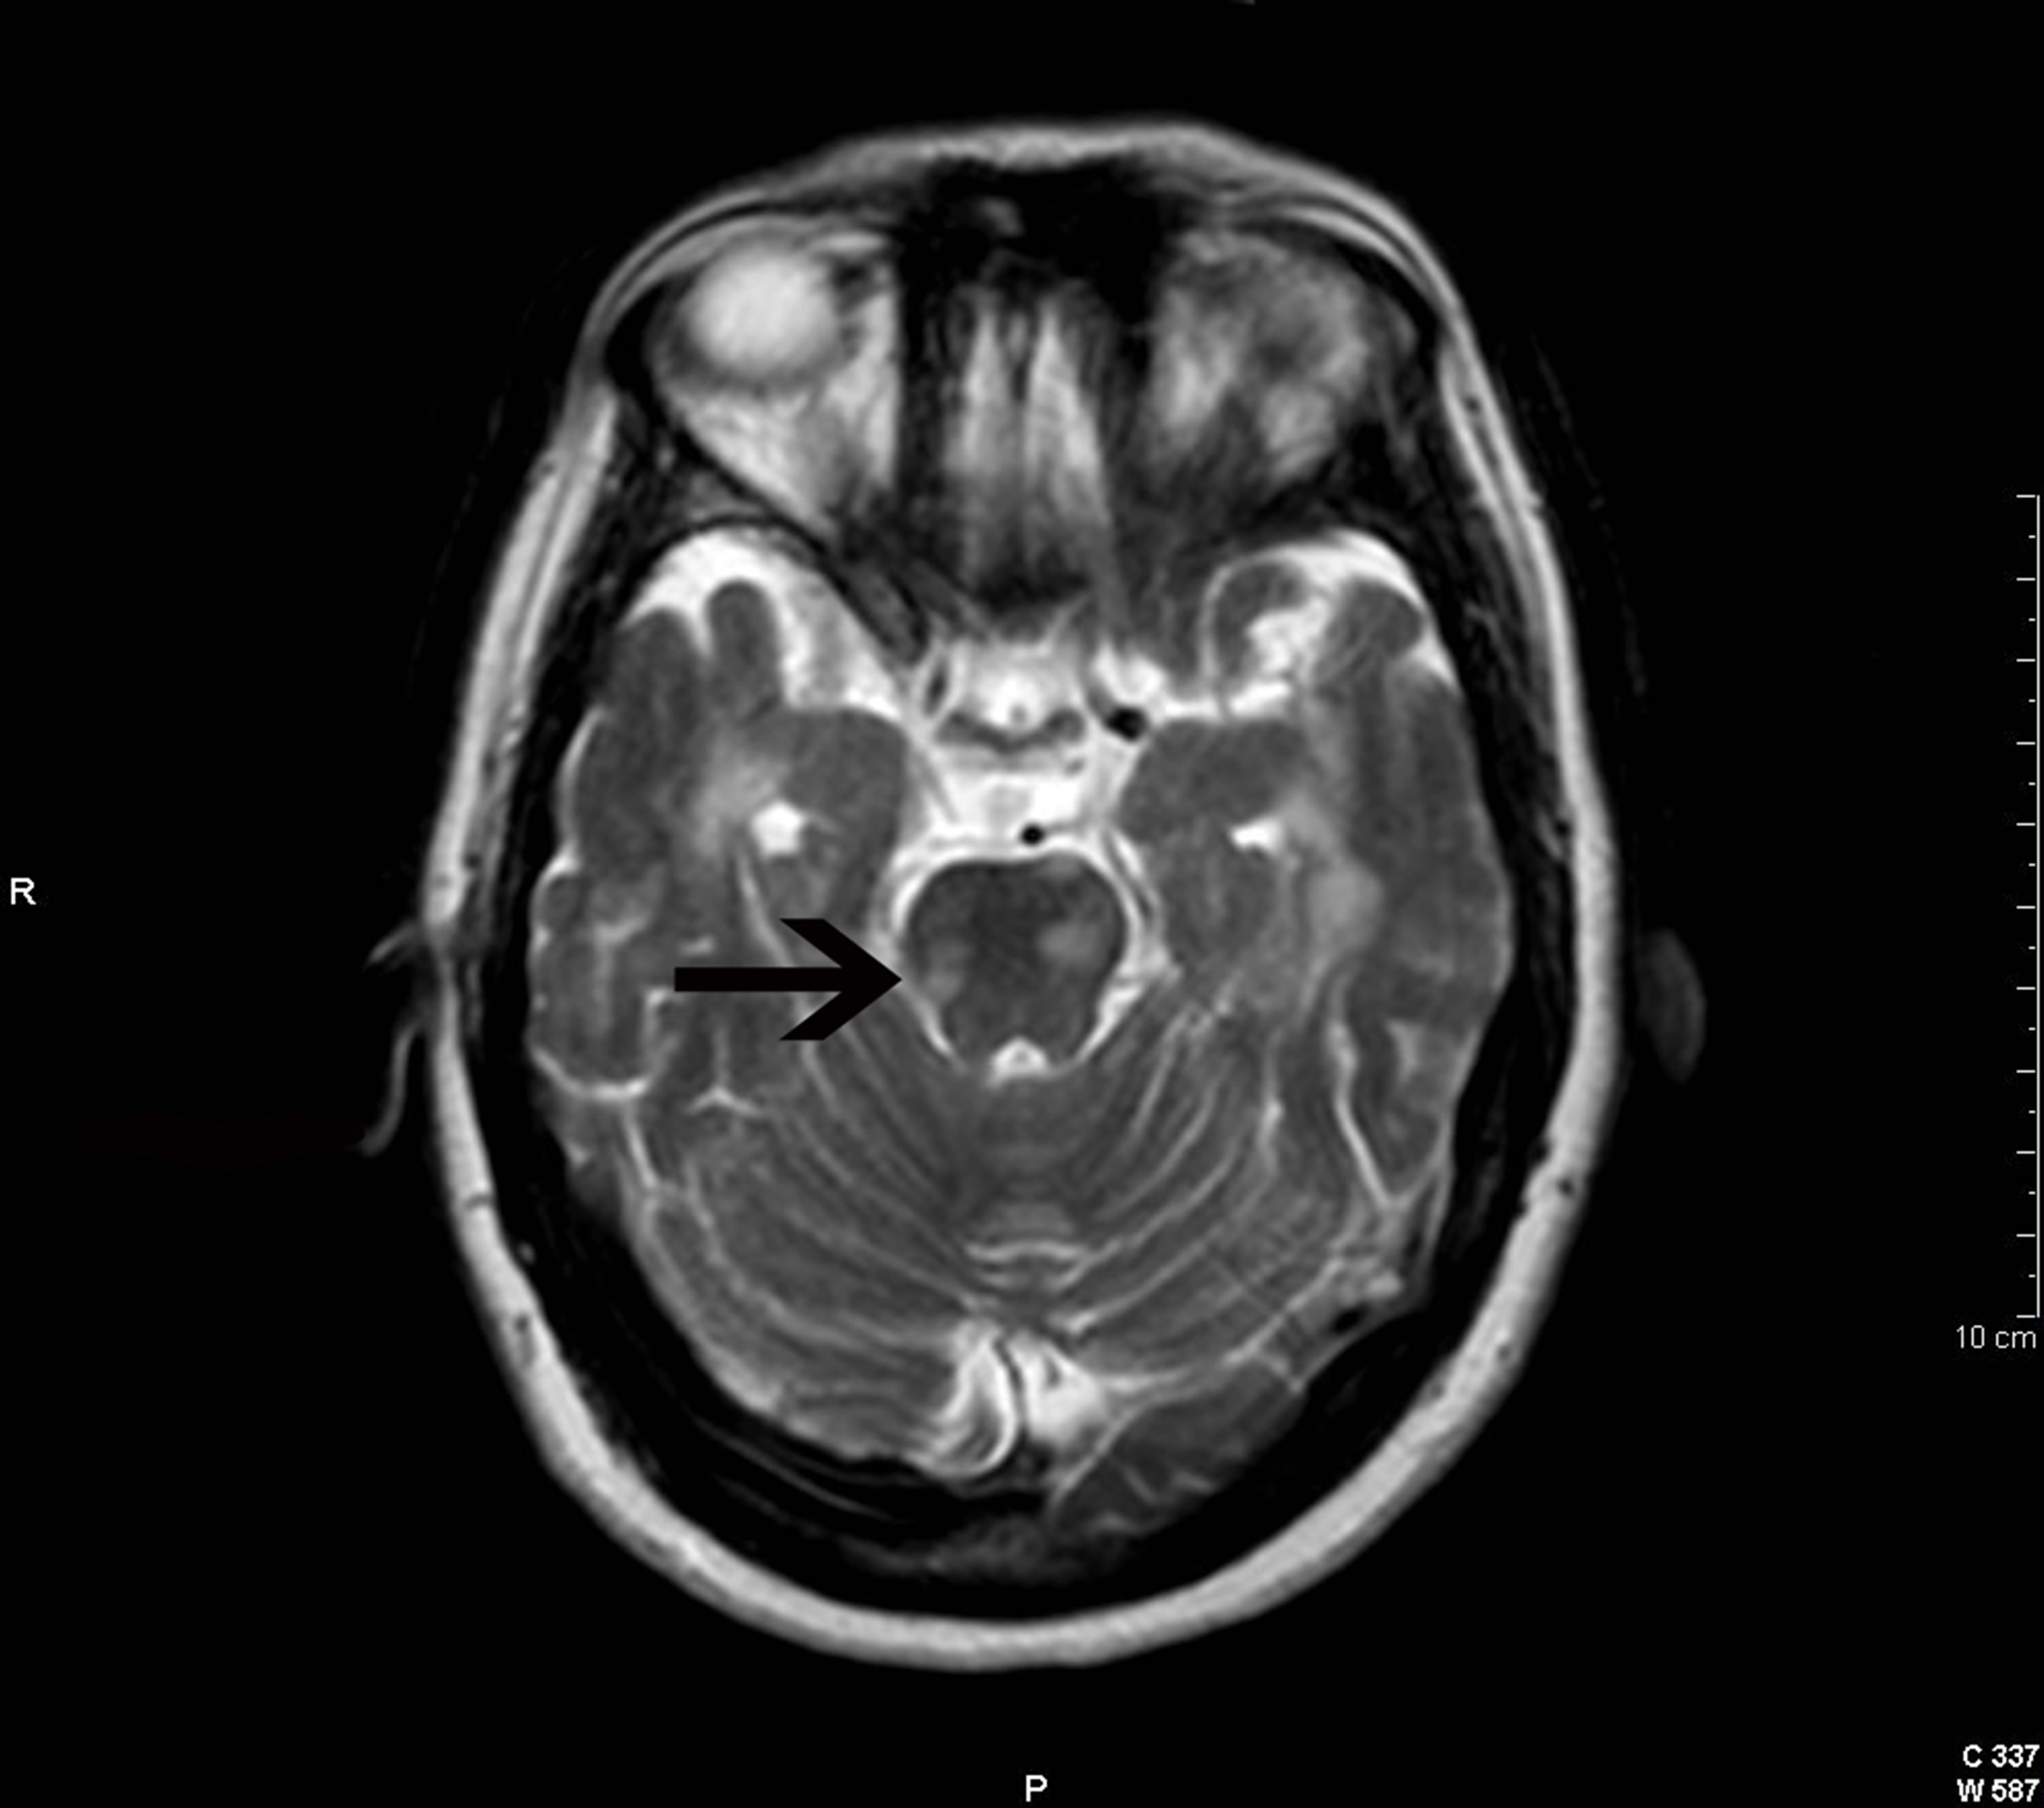
Figure 1. Cranial axial T2-weighted image showing several demyelinating lesions in the brain stem. See probably symptomatic lesion at the pons (arrow).
enzyme, immunological and serological examinations was normal except for an ESR value of 30 mm/h. The cerebrospinal fluid analysis was also normal, except for the detection of IgG oligoclonal bands not presented in blood, a finding that confirmed the existence of intrathecal IgG synthesis typical of MS. Brainstem relapse in the context of relapsing-remitting MS was diagnosed. The patient received high-dose steroid treatment and experienced a great improvement of her deficits, only persisting mild unsteadiness. Because of the diagnosis of relapsing-remitting MS and the large T2 lesion load, disease modifying therapy was initiated.
3. DISCUSSION
MRI is the most sensitive method for revealing demyelinating lesions in the central nervous system (CNS) [7]. This has made MRI a basic examination for the diagnosis of MS. Its use has allowed the diagnosis of the disease from earlier stages since it provides evidence of DIS and DIT of demyelinating lesions without being necessary to wait for a second relapse [8]. It has also contributed to our understanding of the pathophysiology of the disease. However, the correlation between conventional MRI lesion measures and the development of disability is only modest. Exclusively, total T1 hypointense lesion volume (T1 “black holes”), spinal cord sectional area at the C2 level, and brain atrophy have shown a positive association with the progression of long-term disability [9]. By contrast, white matter lesion volume measured by T2- weighted scans only seems to have a small prognostic
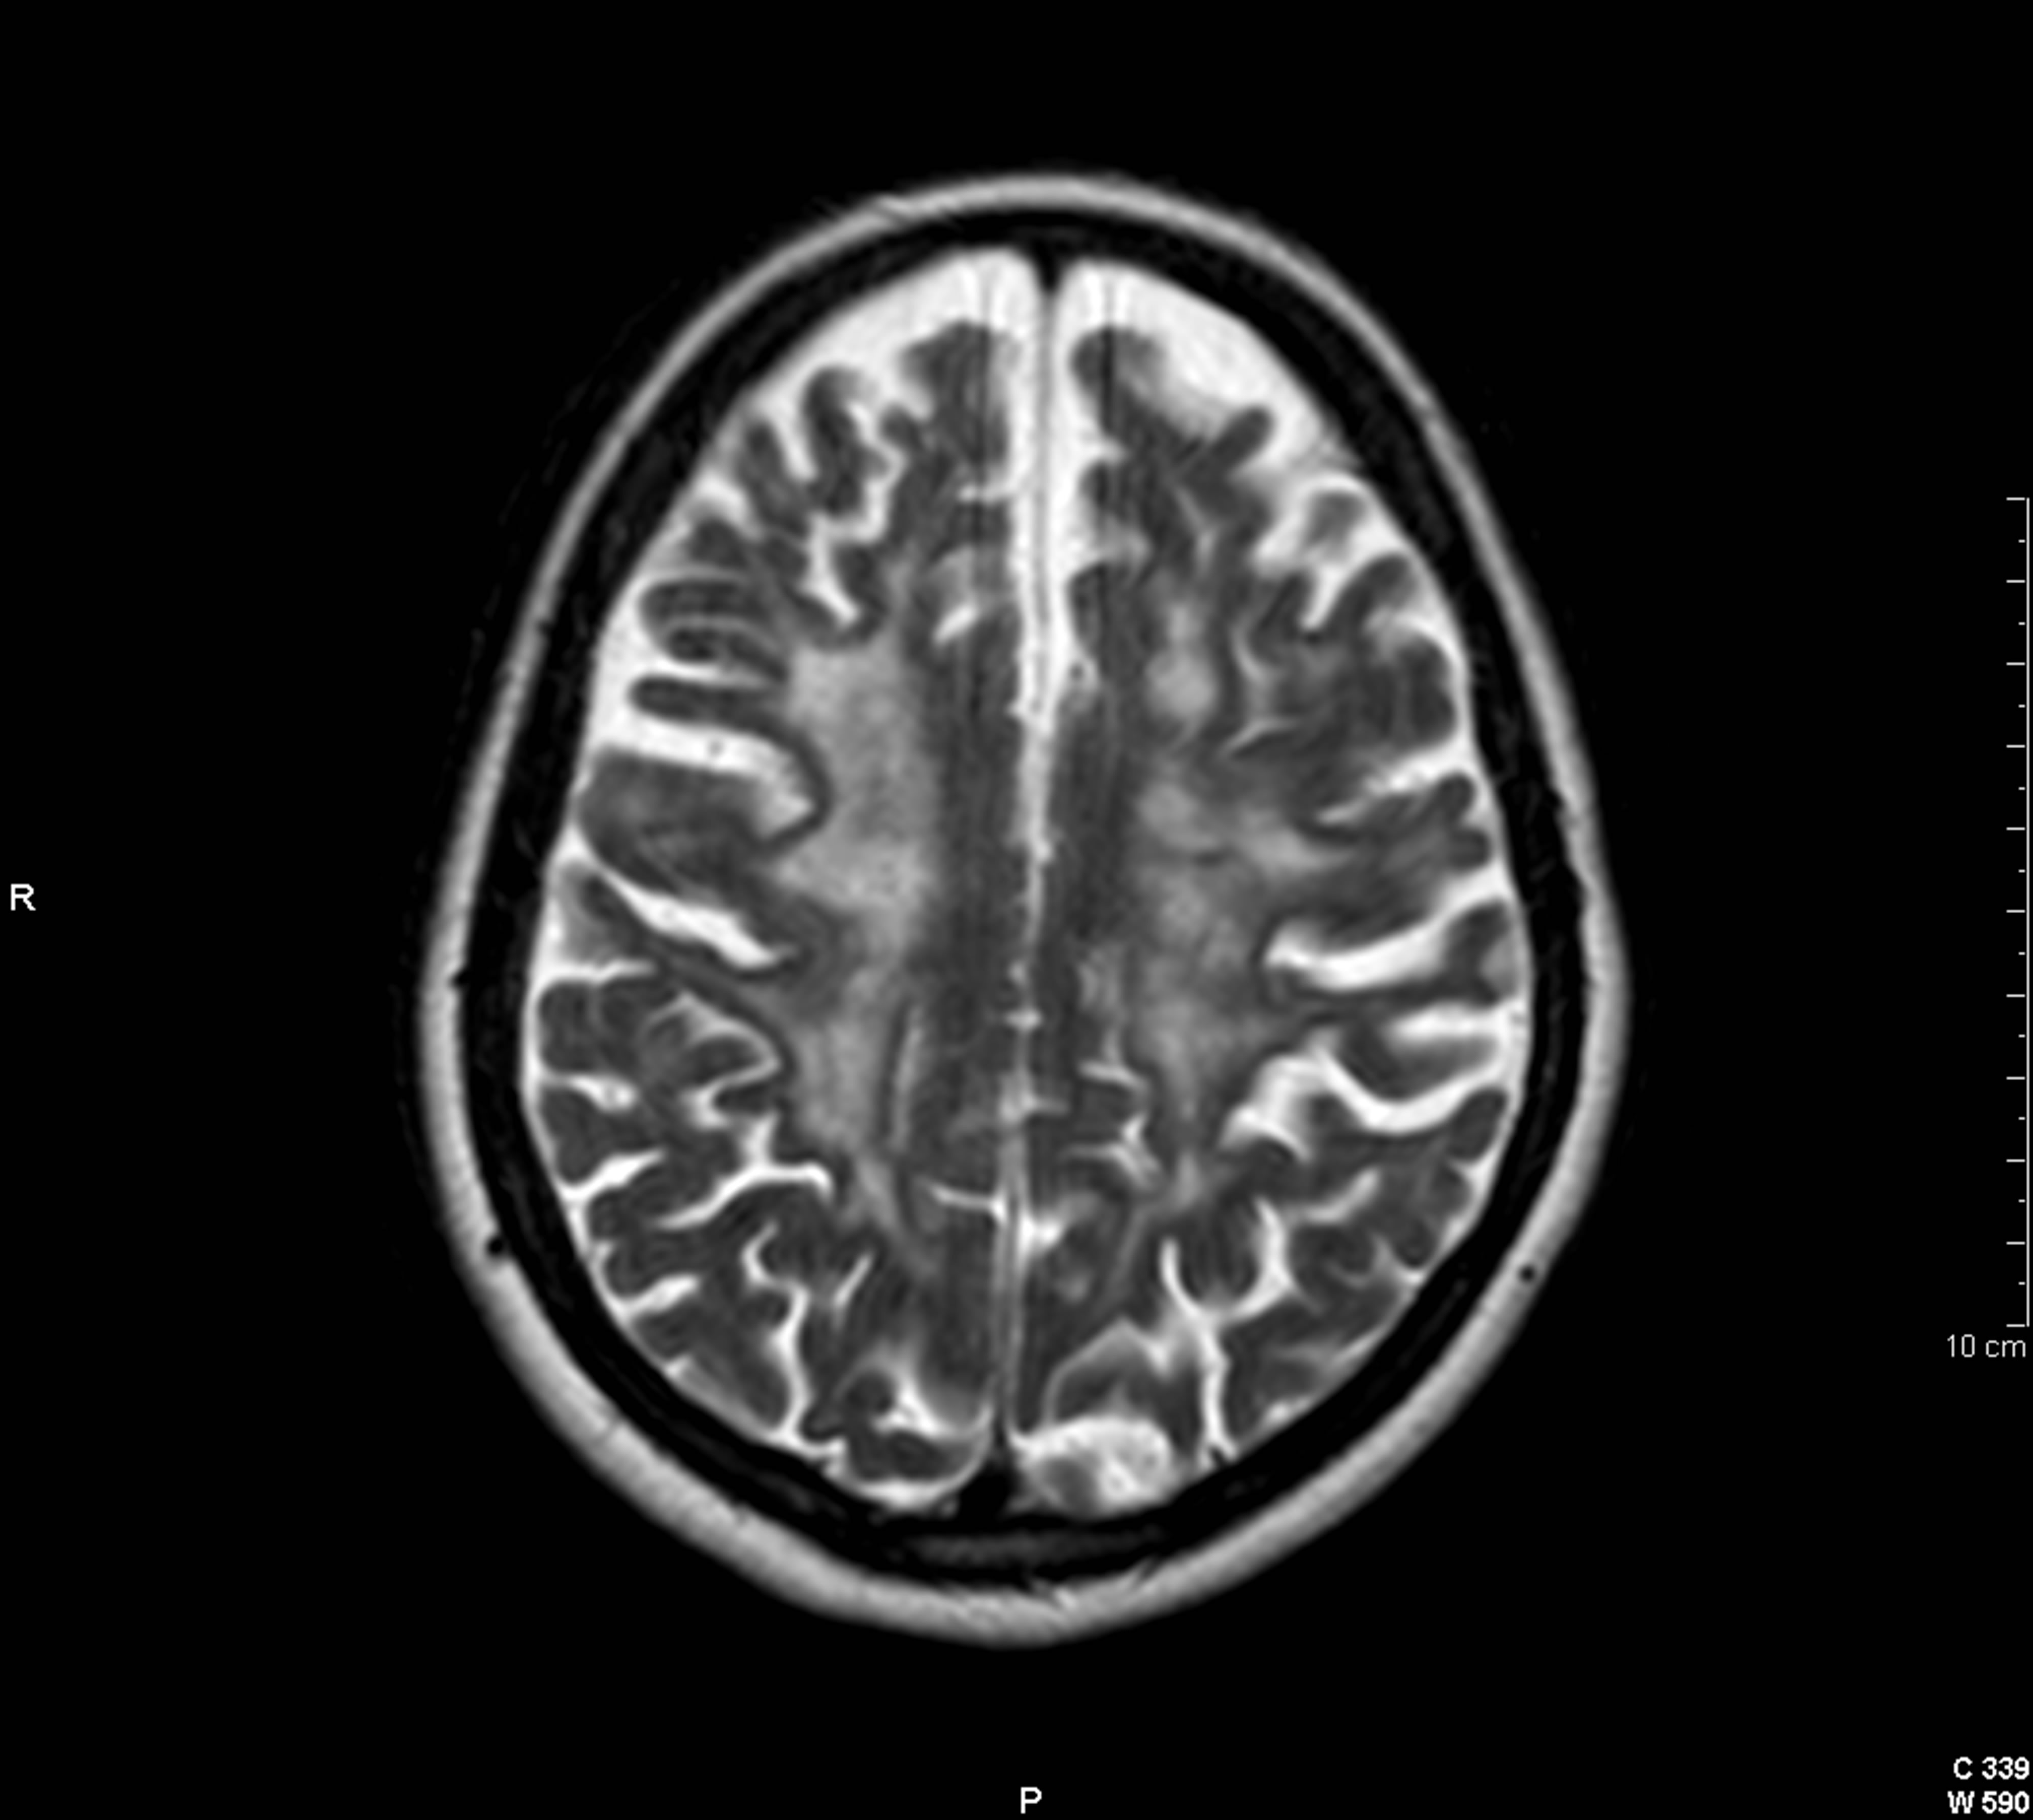
Figure 2. Cranial axial T2-weighted image showing multiple juxtacortical demyelinating lesions with a tendency to confluence.
value in predicting the accumulation of disability in MS [1-5]. In the case of our patient, it is remarkable the large T2 lesion load and the minimum clinical activity in terms of relapses and disability progression. Several theories have been proposed in an attempt to explain what is known as clinico-radiological paradox in MS. It is considered that this discordance between clinical and imaging measures is mainly due to the own limitations of the T2 sequence because of its lack of histopathological specificity. Thus, regardless of the stage, MS plaques appear hyperintense on this sequence. Therefore, this finding is not specific and only reflects an increase in tissue concentration of free water, not being able to discern whether the hyperintensity is secondary to oedema, inflammation, demyelination, axonal loss, remyelination and/or reactive gliosis [1-5]. These pathological substrates confer different degrees of neurological impairment, however, all T2 hyperintensities are interpreted in the same way, which explains, at least partially its poor correlation with the irreversible disability of individual patients. Still, we should consider that clinico-radiological dissociation in MS has a multifactorial origin and that this paradox can be explained by other causes such as the presence of lesions in clinically silent regions, no performance of spinal MRI in some cases, underestimation of damage to the normal appearing brain tissue (both white and gray matter) and compensation by cortical adaption [1-5]. Finally, another cause of this discordance could be the utilization of inappropriate clinical rating scales. The limitations of the Expanded Disability Status Scale (EDSS) are well known. They include incomplete coverage of CNS domains, non-linearity and observer bias [10].
 (a)
(a)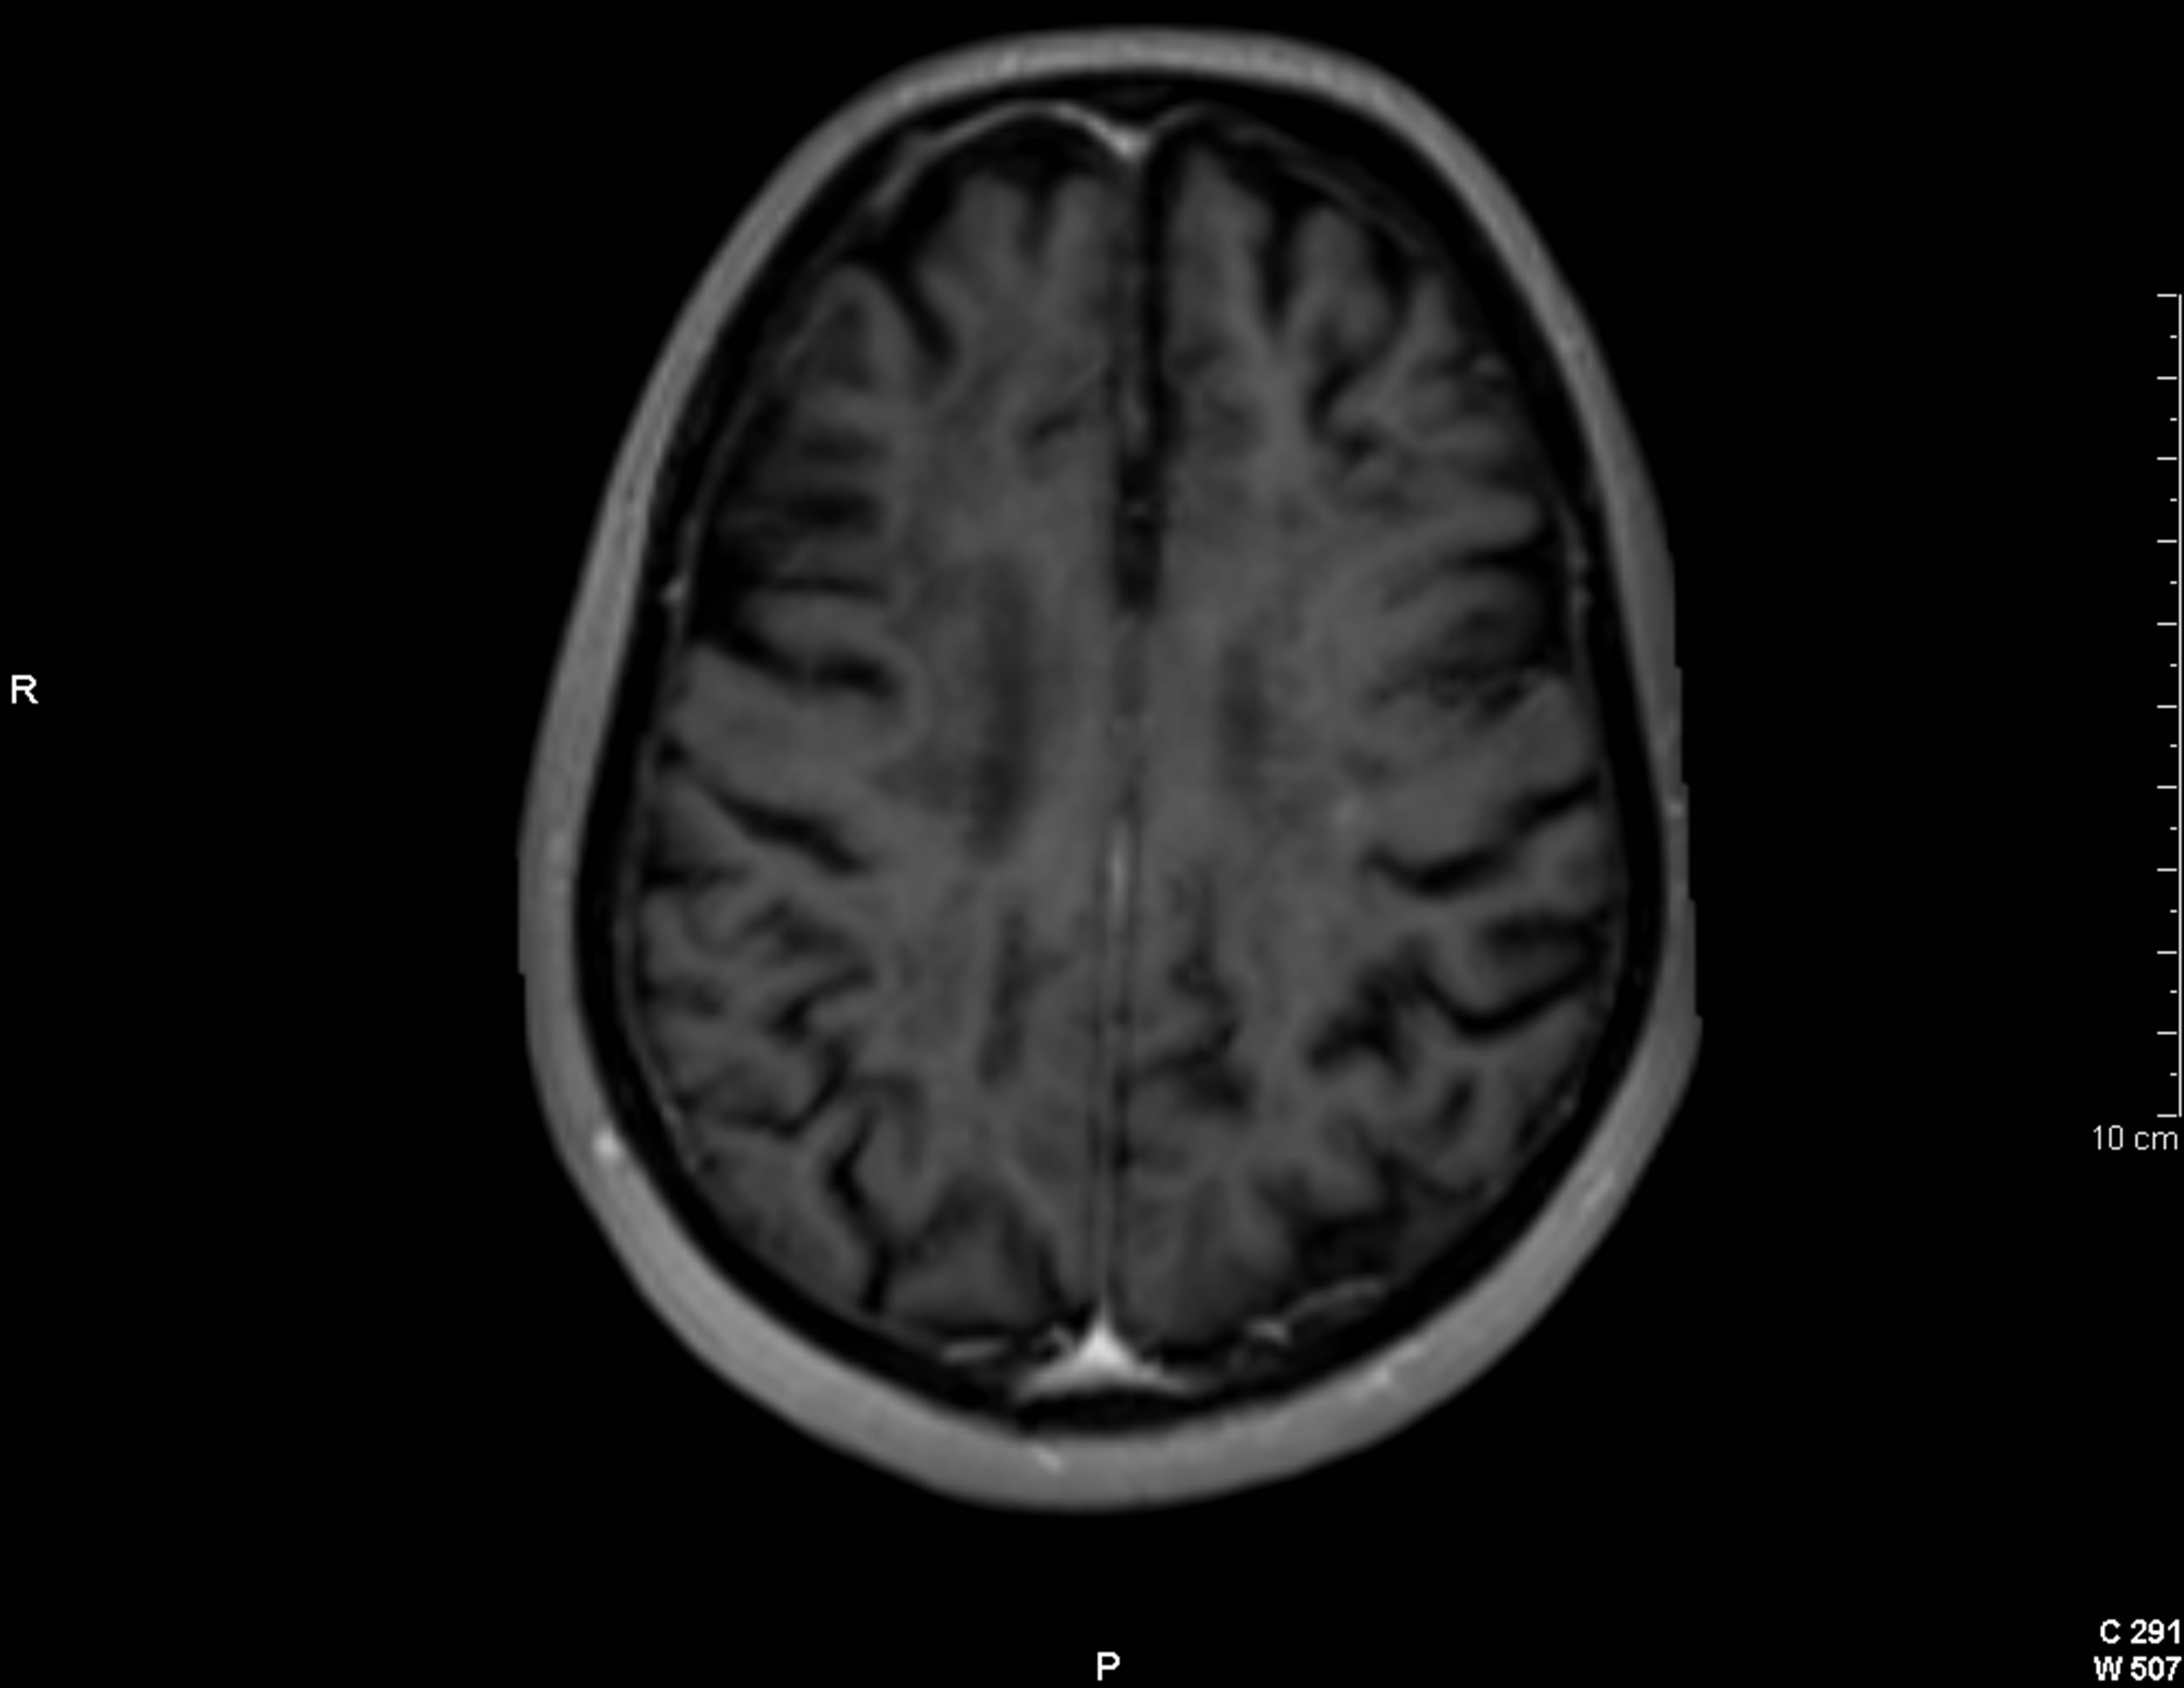 (b)
(b)
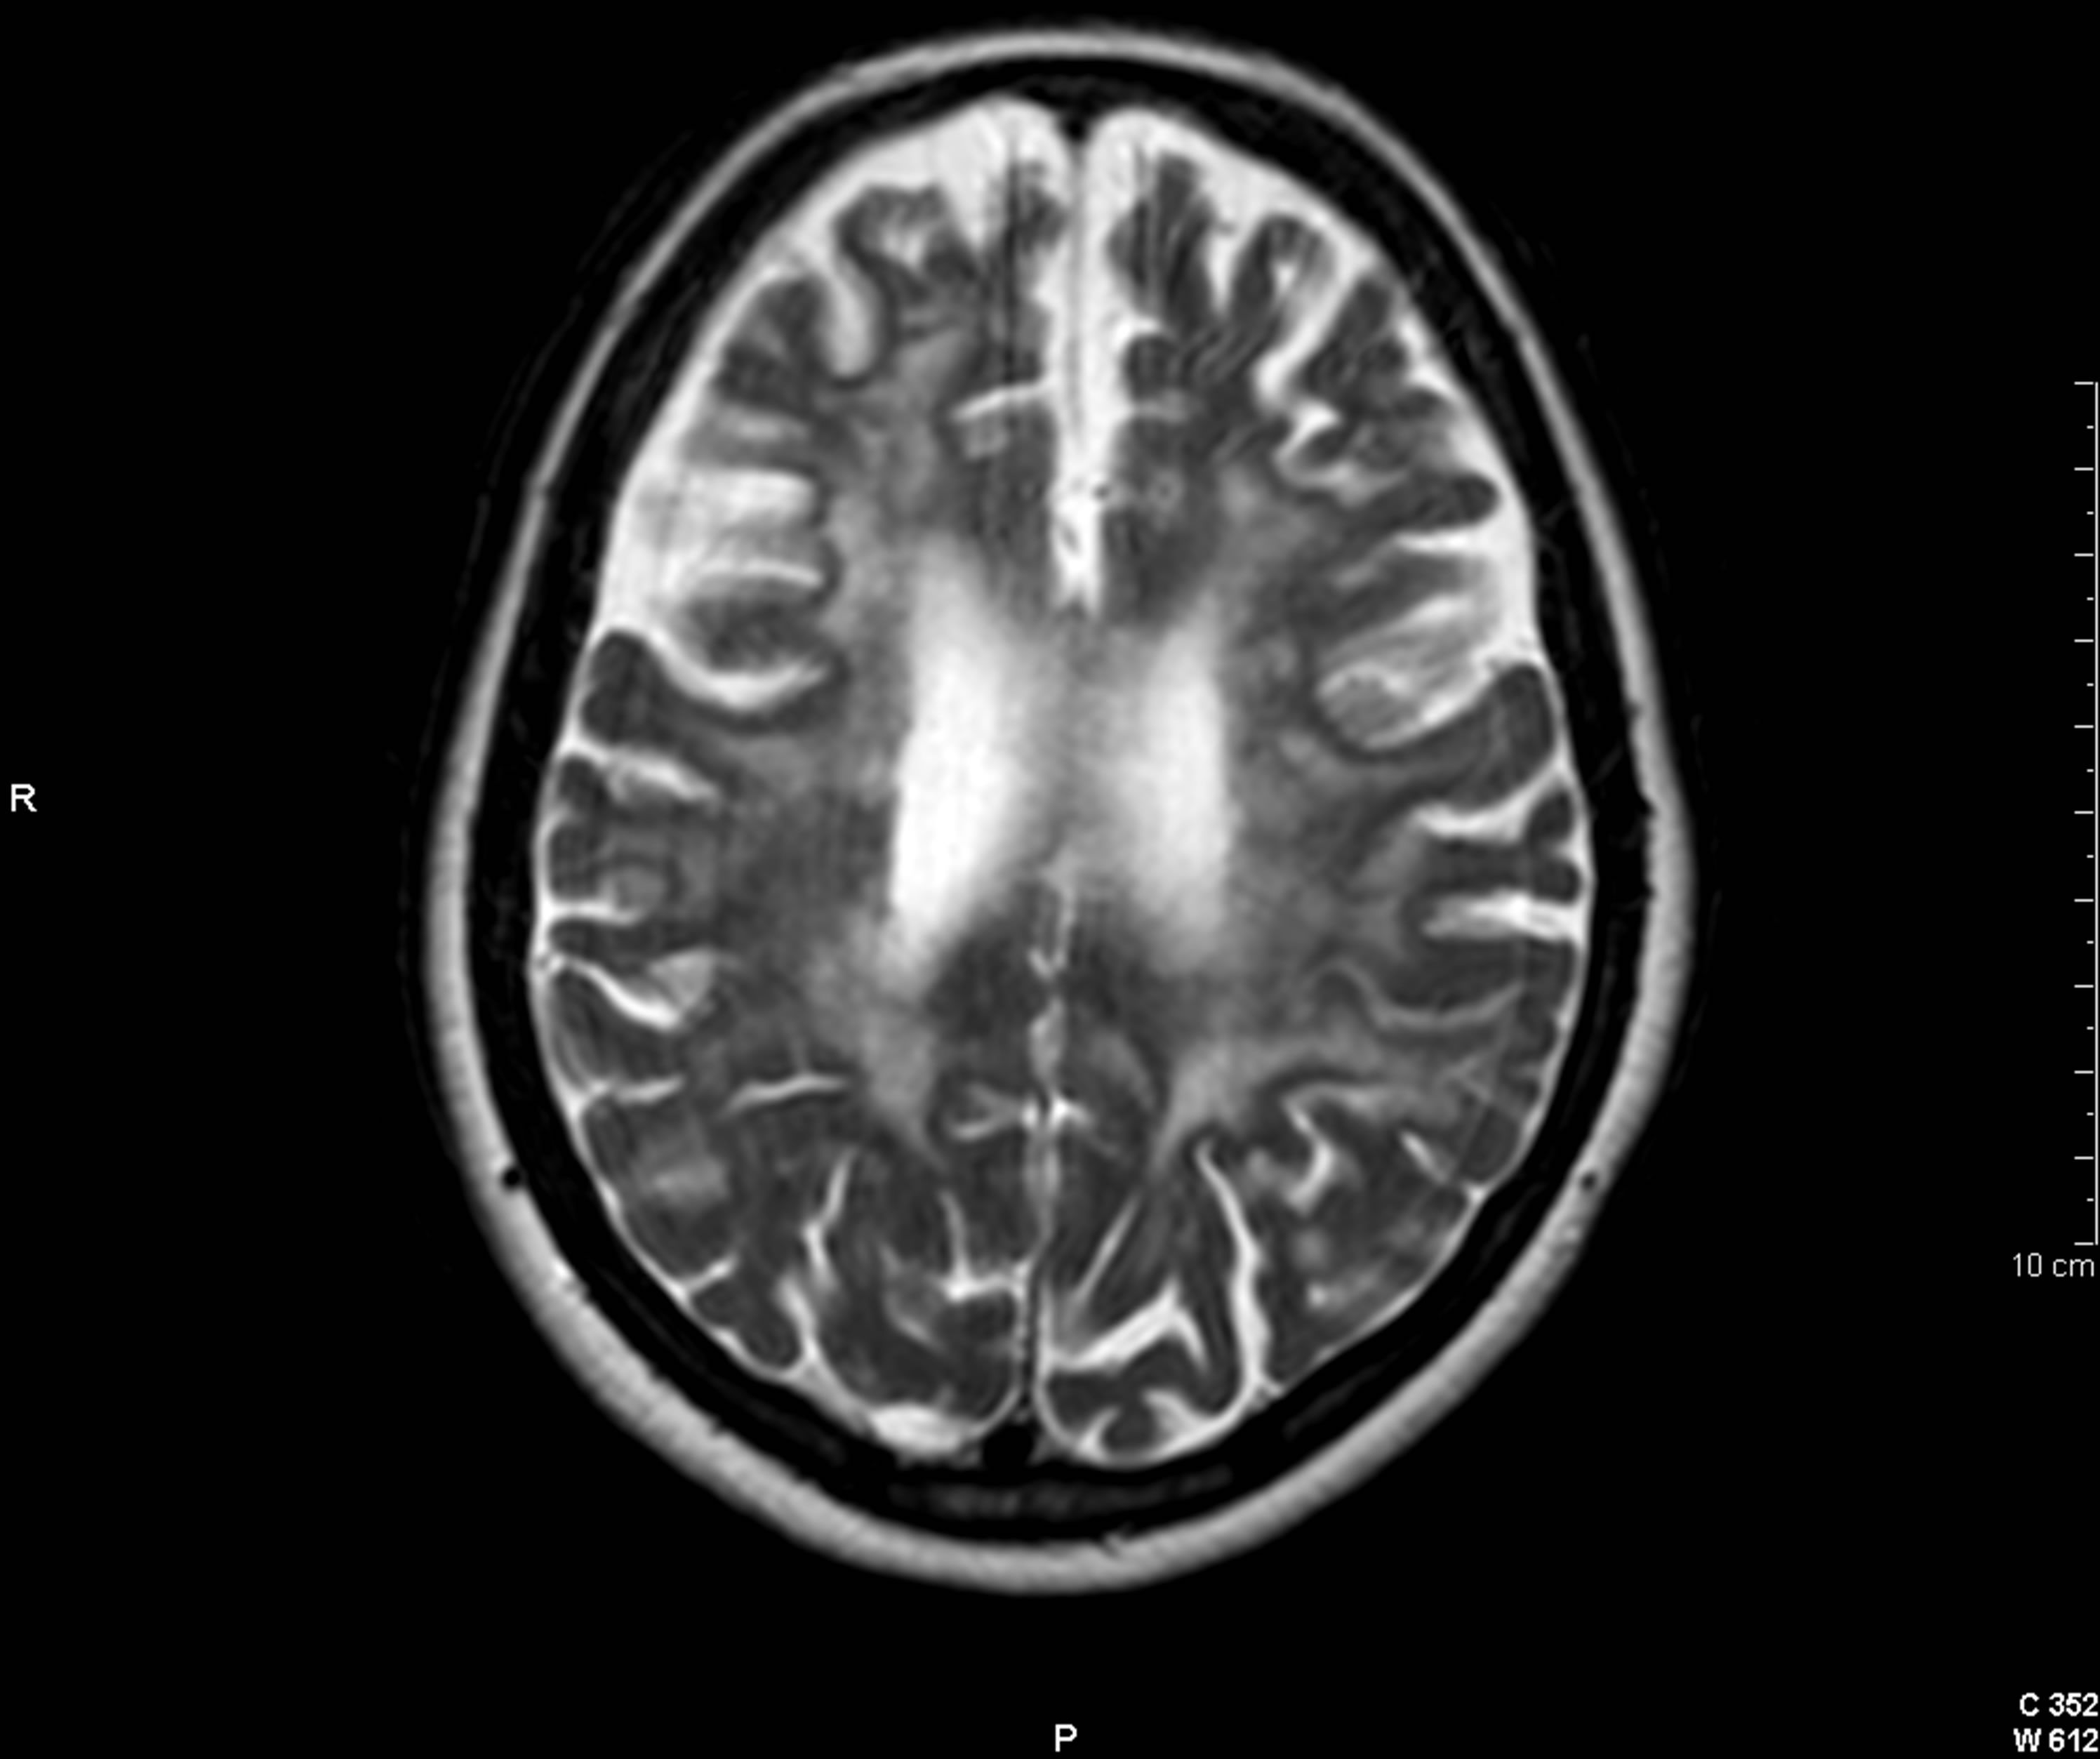
Figure 3. Cranial axial T2-weighted image (a) showing a large burden of periventricular demyelinating lesions. On postgadolinium T1-weighted imagen (b), exclusively, two of these lesions show a solid punctiform enhacement (arrows).
 (a)
(a)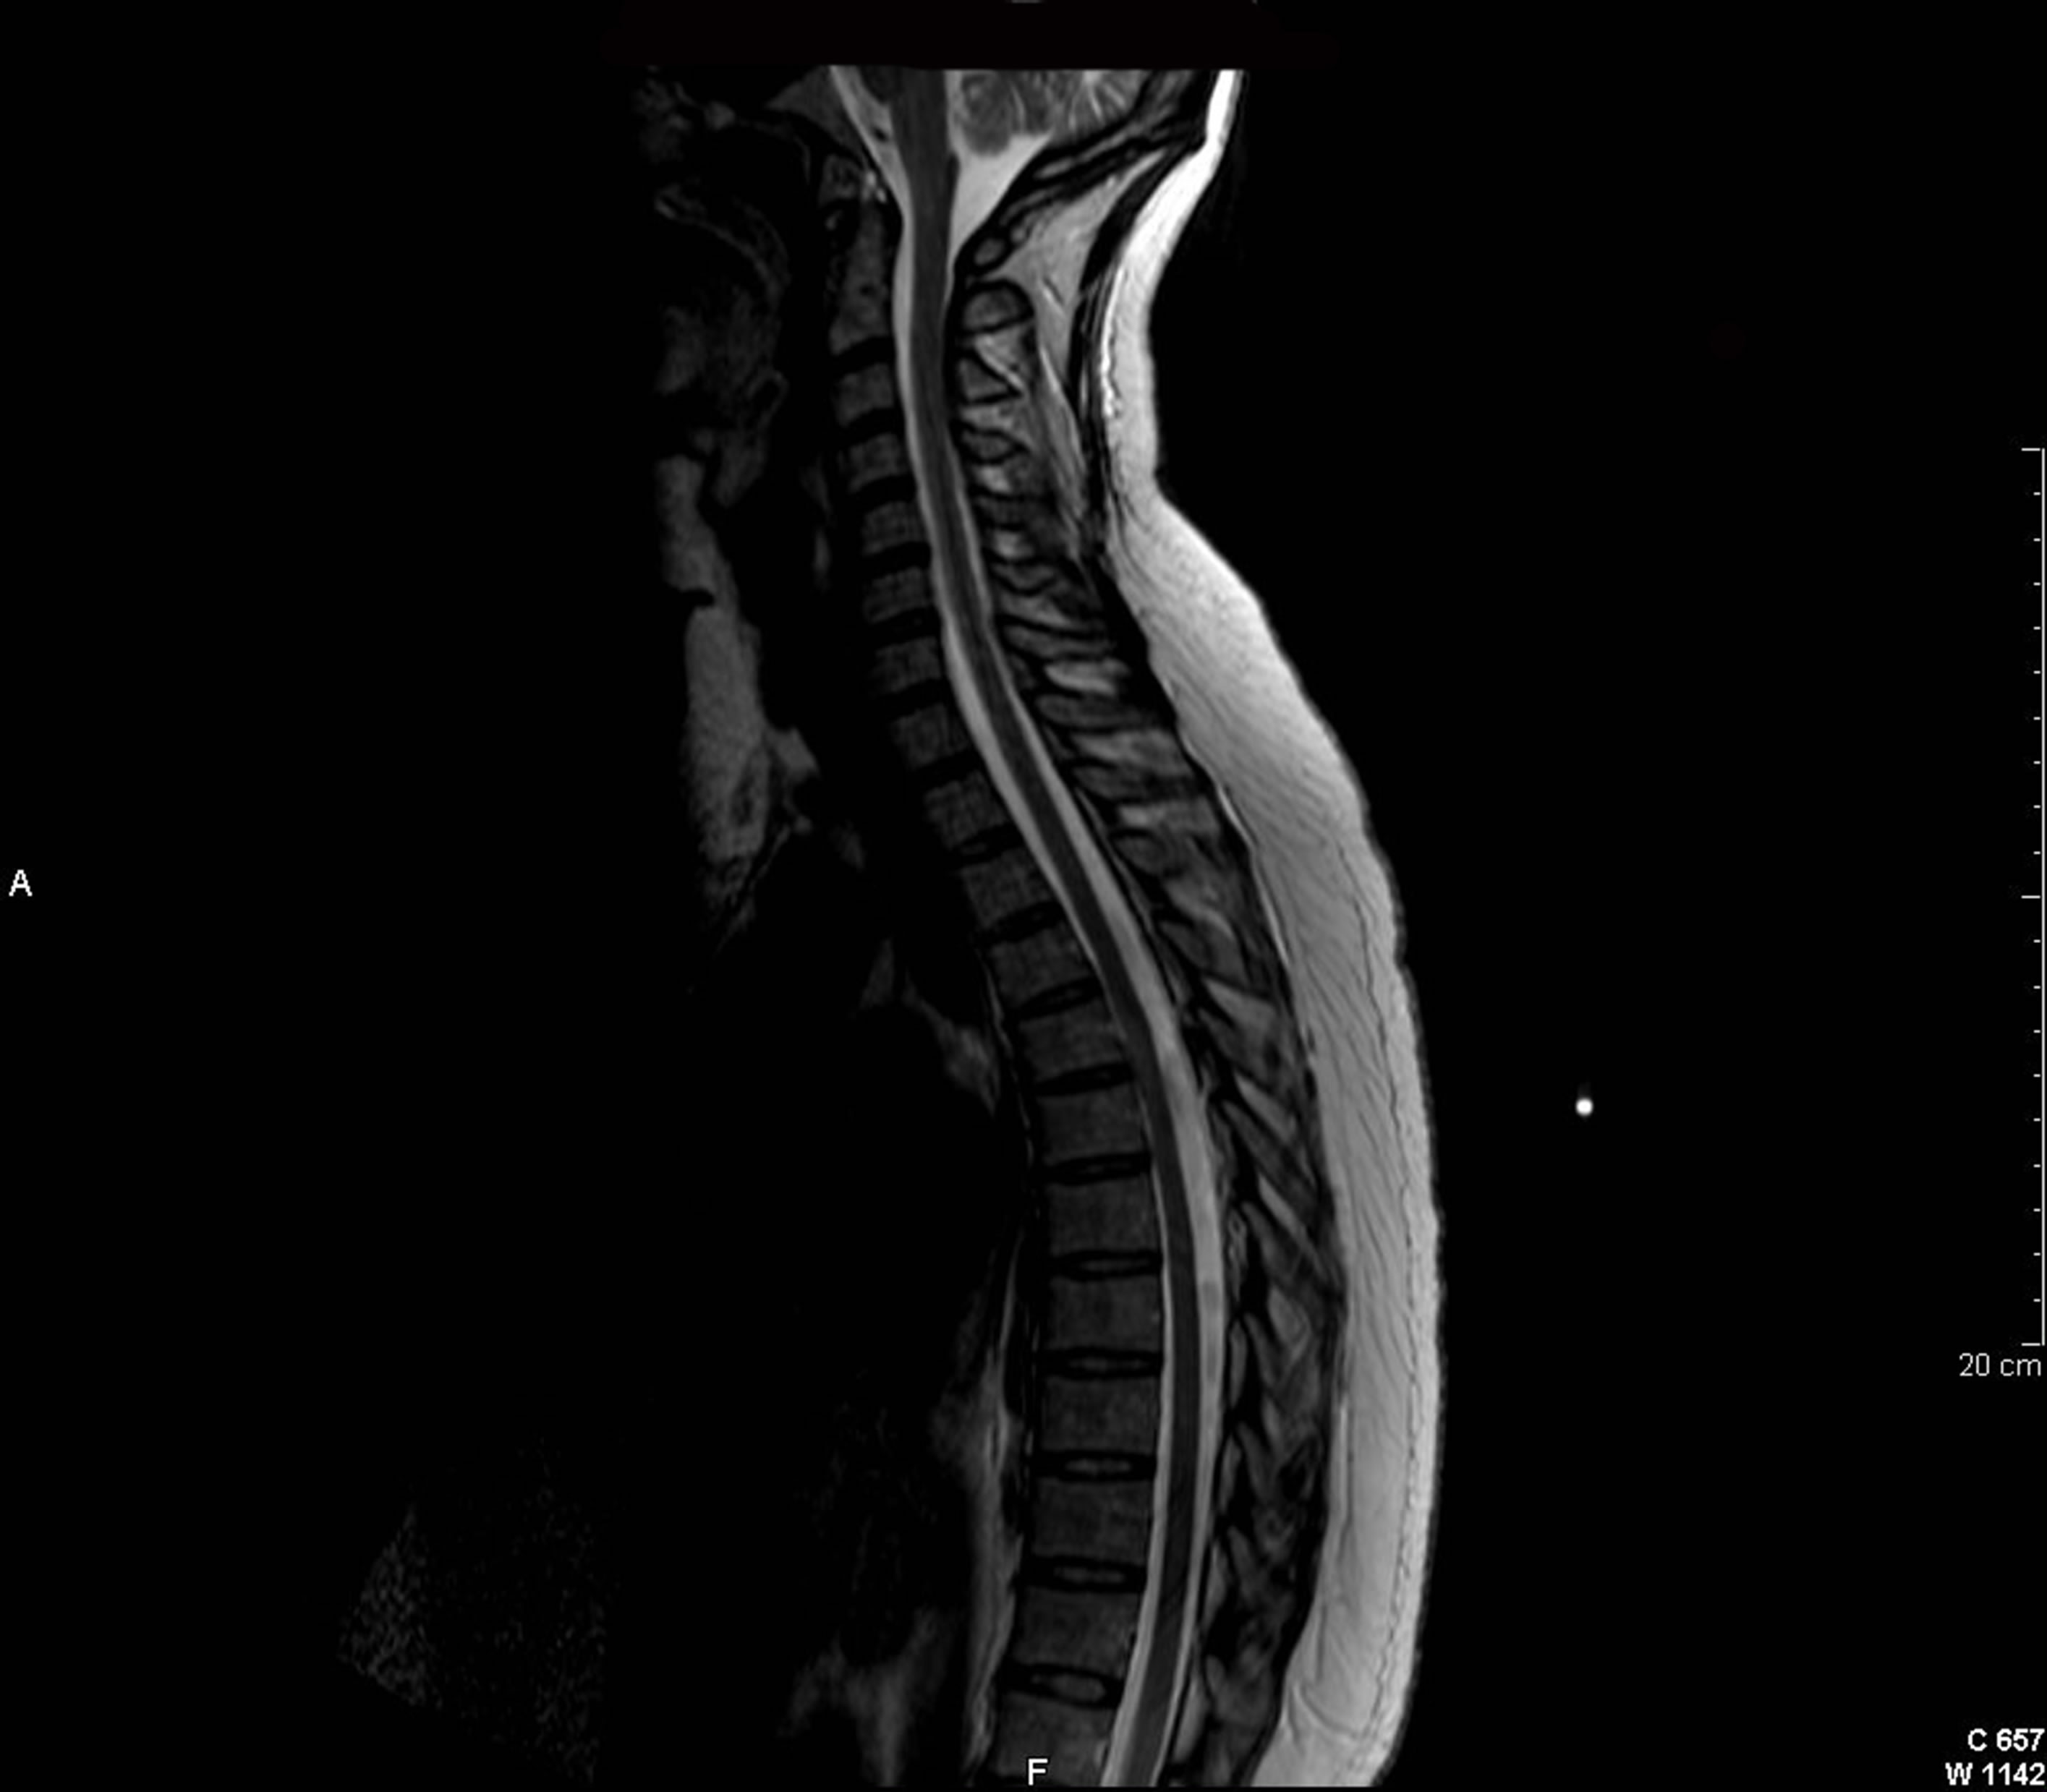 (b)
(b)
Figure 4. Axial (a) and sagittal (b) T2-weighted images of the spinal cord showing a demyelinating lesion at the D5-D6 level (arrows).
In this context, non-conventional MRI methods such as magnetization transfer imaging (MTI), diffusion-tensor imaging (DTI) and proton MR spectroscopic imaging (H-MRSI) have demonstrated a greater specificity for the study of the heterogeneous pathological substrate of demyelinating lesions. Besides, they may reveal otherwise undetectable tissue damage in MS [11-19]. For all these reasons, their utilization would more precisely define tissue injury and dysfunction, and consequently may more closely predict clinical course and response to therapy.
MTI quantifies the interaction between MRI-visible free water protons and MRI-invisible protons associated with macromolecules (lipids and proteins), providing a measure of tissue integrity, especially myelin, in brain [12]. This technique allows us to obtain quantitative data, the ratio of magnetization transfer (MTR), and provides an indirect assessment of the concentration of myelin and axons in brain. The MTR decreases slightly with oedema, but the decline is more intense with demyelination and axonal loss [11]. In MS patients there has been observed a decrease in the value of MTR not only in plaques but also in normal appearing white matter. The lowest MTRs have been detected in T1-black holes with greater axonal injury [11-13].
With DTI, the three-dimensional diffusion of water molecules is quantified, which in turn can be used to describe the orientation and integrity of fibers tracts, as axons [14]. The restriction of water molecules movement depends on the direction in which the diffusion is measured. This property is known as anisotropy and results in a greater diffusion along axons in comparison with the transversal measurement. With DTI we can obtain brain maps of mean diffusivity (MD) and fractional anisotropy (FA). The processes that modify tissue integrity and eliminate some of the restrictive barriers produce an increase in MD and a decrease in FA. As tracts undergo demyelination or axon loss, their microstructure is disrupted, which in turn alters the diffusion of water. It has been detected very high MD values with very low FA values in acute plaques, which may reflect the existence of oedema, demyelination and/or axonal damage. In chronic demyelinating lesions, the increase in MD with the reduction of FA observed seems to be in relation to axonal loss. In addition, in normal appearing white matter of MS patients has also been quantified MD values slightly higher with a reduction of FA when compared with control subjects [15,16].
H-MRSI reveals metabolic information in particular regions of a tissue. The most prominent peak in the spectrum from brain tissue is N-acetylaspartate (NAA), which is almost exclusively contained within neurons and their processes. Chronic demyelinating lesions are characterized by a reduced concentration of NAA, which reflects the permanent axonal loss [17,18]. In acute plaques has been also seen a decrease in the NAA peak, which may be transient or may represent an irreversible axonal injury, as well as an increase of choline and lactate concentrations associated with an increase in myelin turnover and anaerobic metabolism of inflammatory cells, respectively. In addition, in such plaques has been detected the presence of relatively high lipid peaks as a reliable indicator of active demyelination. Besides, with H-MRSI it was found that the concentration of NAA decreases in normal appearing white matter of patients with MS too [19].
On the other hand, focal damage in MS can lead to neural plasticity or reassignment of functions to other anatomic sites. Functional MRI (f-MRI) can be used to measure the effects of brain plasticity. F-MRI utilizes the different magnetic properties of oxygenated and deoxygenated blood to detect regions of increased or decreased cerebral blood flow. In this way, an increase in brain activity results in increased local blood flow and glucose consumption, without elevation of the tissue oxygen consumption. These changes lead to an increase in the oxyhemoglobin concentration compared with the deoxyhemoglobin concentration resulting in an increment in the signal of the activated cortical areas. In MS patients, f-MRI has revealed the existence of functional reorganization phenomena. Thus, patients with a higher degree of tissue damage but with a mild disability show extensive changes in the reassignment of functions, while this phenomenon is not so obvious when the disability is severe [20,21].
In conclusion, conventional MRI has an established role in helping to make the diagnosis of MS due to its high sensitivity in detecting demyelinating lesions in the CNS and its ability to exclude alternative pathologies. However, its limited histopathological specificity and underestimation of damage to the normal appearing brain tissue (both white and gray matter), especially of the T2-weighted scans, justify its reduced value as a prognostic marker for the development of disability. These limitations might be overcome by the introduction of nonconventional MRI techniques with more accurate measurements of disease burden, which could provide valuable insights for the monitoring and management of MS patients.
REFERENCES
- Mostert, J.P., Koch, M.W., Steen, C., Heersema, D.J., De Groot, J.C. and De Keyser, J. (2010) T2 lesions and rate of progression of disability in multiple sclerosis. European Journal of Neurology, 17, 1471-1475. doi:10.1111/j.1468-1331.2010.03093.x
- Pelletier, J., Audoin, B., Reuter, F. and Ranjeva, J. (2009) Plasticity in MS: From functional imaging to rehabilitation. The International MS Journal, 16, 26-31.
- Zivadinov, R. (2009) Advanced magnetic resonance imaging metrics: Implications for multiple sclerosis clinical trials. Methods and Findings in Experimental and Clinical Pharmacology, 31, 29-40. doi:10.1358/mf.2009.31.1.1346612
- Strasser-Fuchs, S., Enzinger, C., Ropele, S., Wallner, M. and Fazekas, F. (2008) Clinically benign multiple sclerosis despite large T2 lesion load: Can we explain this paradox? Multiple Sclerosis Journal, 14, 205-211. doi:10.1177/1352458507082354
- Barkhof, F. (2002) The clinico-radiological paradox in multiple sclerosis revisited. Current Opinion in Neurology, 15, 239-245. doi:10.1097/00019052-200206000-00003
- Polman, C.H., Reingold, S.C., Banwell, B., Clanet, M., Cohen, J.A., Filippi, M., Fujihara, K., Havrdova, E., Hutchinson, M., Kappos, L., Lublin, F.D., Montalban, X., O’Connor, P., Sandberg-Wollheim, M., Thompson, A.J., Waubant, E., Weinshenker, B. and Wolinsky, J.S. (2011) Diagnostic criteria for multiple sclerosis: 2010 Revisions to the McDonald criteria. Annals of Neurology, 69, 292- 302. doi:10.1002/ana.22366
- Paty, D.W., Oger, J.J., Kastrukoff, L.F., Hashimoto, S.A., Hooge, J.P., Eisen, A.A., et al. (1988) MRI in the diagnosis of MS: A prospective study with comparison of clinical evaluation, evoked potentials, oligoclonal banding, and CT. Neurology, 38, 180-185. doi:10.1212/WNL.38.2.180
- McDonald, W.I., Compston, A., Edan, G., Goodkin, D., Hartung, H.P., Lublin, F.D., McFarland, H.F., Paty, D.W., Polman, C.H., Reingold, S.C., Sandberg-Wollheim, M., Sibley, W., Thompson, A., van den Noort, S., Weinshenker, B.Y. and Wolinsky, J.S. (2001) Recommended diagnostic criteria for multiple sclerosis: Guidelines from the international panel on the diagnosis of multiple sclerosis. Annals of Neurology, 50, 121-127. doi:10.1002/ana.1032
- Van Walderveen, M.A.A., Barkhof, F., Hommes, O.R., Polman, C.H., Tobi, H., Frequin, S.T.F.M., et al. (1995) Correlating MRI and clinical disease activity in multiple sclerosis: Relevance of hypointense lesions on shortTR/short-TE (T1-weighted) spin-echo images. Neurology, 45, 1684-1690. doi:10.1212/WNL.45.9.1684
- Kurtzke, J.F. (1983) Rating neurologic impairment in multiple sclerosis: An expanded disability status scale (EDSS). Neurology (Cleveland), 33, 1444-1452. doi:10.1212/WNL.33.11.1444
- Pike, G.B., De Stefano, N., Narayanan, S., et al. (1999) Combined magnetization transfer and proton spectroscopic imaging in the assessment of pathologic brain lesions in multiple sclerosis. American Journal of Neuroradiology, 20, 829-837.
- Filippi, M., McGowan, J.C. and Tortorella, C. (2007) Measures of magnetization transfer in multiple sclerosis. In: Cohen, J.A. and Rudick, R.A., Eds. Multiple Sclerosis Therapeutics, 3rd Edition, Informa Healthcare, London, 143-144, 171.
- Carlos Santos, A., Narayanan, S., De Stefano, N., et al. (2000) Magnetization transfer can predict clinical evolution in patients with multiple sclerosis. Journal of Neurology, 249, 662-668. doi:10.1007/s00415-002-0686-4
- Fox, R.J. (2008) Picturing multiple sclerosis: Conventional and diffusion tensor imaging. Seminars in Neurology, 28, 453-466. doi:10.1055/s-0028-1083689
- Vrenken, H., Pouwels, P.J.W., Geurts, J.J.G., et al. (2006) Altered diffusion in multiple sclerosis normal appearing brain tissue: Cortical diffusion changes seem related to clinical deterioration. Journal of Magnetic Resonance Imaging, 23, 628-636. doi:10.1002/jmri.20564
- Audoin, B., Maxime, G., Reuter, F., et al. (2007) Structure of WM bundles constituting the working memory system in early multiple sclerosis: A quantitative DTI tractography study. NeuroImage, 36, 1324-1330. doi:10.1016/j.neuroimage.2007.04.038
- Fu, L., Matthews, P.M., De Stefano, N., et al. (1998) Imaging of axonal damage of normal appearing white matter in multiple sclerosis. Brain, 121, 103-113. doi:10.1093/brain/121.1.103
- Mathews, P.M., Francis, G., Antel, J. and Arnold, D.L. Proton magnetic resonance spectroscopy for metabolic characterization of plaques in multiple sclerosis. Neurology, 41, 1521-1526. doi:10.1212/WNL.41.8.1251
- Chard, D.T., Griffin, C.M., McLean, M.A., et al. (2002) Brain metabolite changes in cortical grey and normalappearing white matter in clinically early relapsing-remitting multiple sclerosis. Brain, 125, 2342-2352. doi:10.1093/brain/awf240
- Rocca, M.A., Colombo, B., Falini, A., Ghezzi, A., Martinelli, V., Scotti, G., et al. (2005) Cortical adaptation in patients with MS: A cross-sectional functional MRI study of disease phenotypes. The Lancet Neurology, 4, 618-626. doi:10.1016/S1474-4422(05)70171-X
- Mainero, C., Pantano, P., Caramia, F. and Pozzilli, C. (2006) Brain reorganization during attention and memory tasks in multiple sclerosis: Insights from functional MRI studies. Journal of the Neurological Sciences, 245, 93-98. doi:10.1016/j.jns.2005.08.024
NOTES
*Corresponding author.