Open Journal of Genetics
Vol.4 No.2(2014), Article ID:44677,26 pages
DOI:10.4236/ojgen.2014.42013
Diversity and Frequencies of HLA Class I and Class II Genes of an East African Population
Trevor A. Peterson1, Thomas Bielawny1, Philip Lacap1, Rae-Anne Hardie, Christina Daniuk1, Lillian Mendoza1, Subotheni Thavaneswaran2, Tony Kariri3, Joshua Kimani2,3, Charles Wachihi3, Maboku Kimani3, Terry Blake Ball1,2, Francis A. Plummer1,2, Ma Luo1,2*
1National Microbiology Laboratory, Winnipeg, Canada
2Department of Medical Microbiology, University of Manitoba, Winnipeg, Canada
3Department of Medical Microbiology, University of Nairobi, Nairobi, Kenya
Email: *Ma.Luo@phac-aspc.gc.ca
Copyright © 2014 by authors and Scientific Research Publishing Inc.
This work is licensed under the Creative Commons Attribution International License (CC BY).
http://creativecommons.org/licenses/by/4.0/


Received 11 January 2014; revised 10 February 2014; accepted 9 March 2014
ABSTRACT
Human Leukocyte Antigens (HLAs) play an important role in host immune responses to infectious pathogens, and influence organ transplantation, cancer and autoimmune diseases. In this study we conducted a high resolution, sequence-based genotyping of HLA class I and class II genes of more than 2000 women from Kenya, eastern Tanzania and southern Uganda around Lake Victoria and analyzed their allele, phenotype and haplotype frequencies. A considerable genetic diversity was observed at both class I and II loci. A total of 79 HLA-A, 113 HLA-B, 53 HLA-C, 25 HLA-DPA1, 60 HLA-DPB1, 15 HLA-DQA1, 44 HLA-DQB1 and 38 HLA-DRB1 alleles have been identified. The most common class I alleles were A * 02:01:01 (10.90%), B * 58:02 (8.79%), and C * 06:02:01 (16.98%). The most common class II alleles were DPA1*01:03:01 (40.60%), DPB1 * 01:01:01 (23.45%), DQA1 * 01:02:01 (31.03%), DQB1 * 03:01:01 (21.79%), DRB1 * 11:01:02 (11.65%), DRB3 * 02:02:01 (31.65%), DRB4 * 01:01:01 (10.50%), and DRB5 * 01:01:01 (10.50%). Higher than expected homozygosity was observed at HLA-B (P = 0.022), DQA1 (P = 0.004), DQB1 (P = 0.023), and DRB1 (P = 0.0006) loci. The allele frequency distribution of this population is very similar to the ones observed in other sub-Saharan populations with the exception of lower frequencies of A * 23 (5.55% versus 11.21%) and DQA1 * 03 (4.79% versus 11.72%), and higher frequencies of DPB1 * 30 (2.26% versus 0.37%) and DRB1 * 11 (21.51% versus 15.89%). The knowledge of the diversity and allele/ phenotype frequencies of the HLA alleles of this east African population, can contribute to the understanding of how host genetic factors influence disease susceptibility and effective anti-retroviral treatment of HIV infections and future vaccine trials.
Keywords:HLA-A, HLA-B, HLA-C, HLA-DPA1, HLA-DPB1, HLA-DQA1, HLA-DQB1, HLA-DRB1, HLA Frequencies, HLA Class I, HLA Class II, East African

1. Introduction
The Human Leukocyte Antigen (HLA) genes are the most polymorphic genes within the human genome and play an important role in initiating the immune response to invading pathogens. Associations between specific HLA alleles and increased/decreased risk of autoimmunity diseases [1] [2] as well as resistance and susceptibility to pathogenic infections have been reported in many studies [3] . The information related to the HLA allele frequencies and their compositions in a given population can contribute not only to the anthropological and transplantation studies, but also to the understanding of disease epidemiology. In turn, it can also provide valuable information for designing effective vaccine and clinical trials.
As a founder population under the extensive selective pressure exerted by many infectious diseases, East African populations are expected to have a very diverse HLA class I and II allele composition. A previous analysis of the genetic makeup of African populations and their genetic diversity has shown extensive variations in multiple genetic markers such as microsatellites, insertions/deletions and single nucleotide polymorphisms [4] . Comparison of HLA composition of Kenya and Cameroon populations showed various similarities and differences for specific frequencies of HLA-A and -B alleles [5] and similar genetic distance in HLA-C has been observed between the Caucasian and African population and between the African and Asian populations [6] .
In this study, we conducted high resolution sequence-based typing of the HLA class I and II genes [7] and comprehensive analysis of allele frequencies of more than 2000 women from Kenya, eastern Tanzania and southern Uganda around lake Victoria. A considerable genetic diversity was observed at both class I and II loci. The class I and class II HLA allele frequencies of the study population were compared with that of several sub-Saharan African and North African, Western European Caucasoid and Asian populations [8] . The knowledge of the diversity of the HLA alleles of different populations, their similarities and differences can contribute to the understanding of how host genetic factors influence disease susceptibility and effectiveness of anti-retroviral treatment of HIV infections, as well as better preparation for future vaccine trials.
2. Materials and Methods
2.1. Study Population
The study population is consisted of more than 2000 women enrolled before 2008 in the Pumwani sex worker cohort in Nairobi, Kenya. HIV status is not the requirement for enrolment. In this study, 2161 individuals were typed for HLA-A, 2179 individuals for HLA-B, 2152 individuals for HLA-C, 2160 individuals for DPA1, 2215 individuals for DPB1, 2098 individuals for DQA1, 2070 individuals for DQB1, and 1090 individuals for DRB1, DRB3, DRB4 and DRB5. Due to insufficient DNA quantity for some samples, not all individuals were typed for each locus. The Ethics Committee of the University of Manitoba and the Ethics and Research Committee of Kenyatta National Hospital has approved this study and informed consent was obtained from all women enrolled in the study.
2.2. DNA Preparation
The DNA used for HLA typing was isolated from patients of the cohort using QIAmp DNA Mini Kit and QIAgen EZ1 Blood Robot (QIAgen Inc, Mississauga, Ontario, Canada) and was quantified by standard UV spectrophotometric analysis.
2.3. PCR Amplification and Sequencing Primers
Exons 2 and 3 and intron 2 were amplified for HLA-A, HLA-B, and HLA-C. Both gene-specific and allele specific primers were used to sequence the PCR products. Exon 2 of DQA1, DQB1, DPA1 and DPB1 was amplified and sequenced. DRB typing was accomplished using a two-step sequence based genotyping method described previously [9] . Allele-specific primers were then developed to resolve ambiguous allele combinations. PCR, sequencing PCR and allele specific primers are listed in Table 1.
2.4. PCR Reactions
The 50 µl PCR reaction mixture consisted of 60mM Tris-HCl (pH 9.0), 15mM (NH4)2SO4, 1.5 mM MgCl2, 0.1% gelatin, 100 mM each dNTP, 25 pmol of each primer, 1.25 Unit of Taq DNA polymerase (Invitrogen Life Technologies, Burlington, ON, Canada) and 100 - 200 ng DNA. The cycle parameters used in the PTC-100 programmable Thermal Controller (MJ Research, Inc., Waltham, MA USA) were 35 cycles of 1 min denaturation at 96˚C, 1 min at a specific annealing temperature (Table 1), 2 min extension at 72˚C, followed by a final 10 minutes extension at 72˚C. Five µl PCR product was checked by 1.0% agarose gel electrophoresis for the correctly sized PCR products. The remaining PCR products were purified with the “High Pure PCR Product Purification Kit” (Roche Molecular Biochemicals, Laval QC, Canada) or with Amicon Microcon-PCR Centrifugal filter device (Millipore, Bedford, MA USA) for sequencing PCR. Sequencing PCR programs consisted of 80 cycles of 1 minute denaturation at 96˚C, followed by 1 min at the primer’s specific annealing temperature, then 2 minutes of extension at 60˚C, followed by a final extension at 10 minutes. Allele specific primers were used to resolve allele ambiguities (Table 2). For the allele specific primers, the annealing step was done at the melting temperature of the primer for 15 seconds to allow for highly specific binding to the specific allele.
2.5. Sequencing and HLA Typing
ABI PRISM BigDye Terminator Cycle Sequencing Ready Reaction Kits (Applied Biosystems, Foster City, CA, USA) were used for all sequencing. The amplified PCR products from this were purified and then analyzed using ABI PRISM 310 GENETIC ANALYZER (Applied Biosystems). Class I and II alleles were typed using software Codon Express™, a computer program developed based on a Taxonomy Based Sequencing Analysis (TBSA) [7] . The HLA databases were downloaded from IMTG/HLA Database (http://www.ebi.ac.uk/imgt/hla/).
2.6. Statistical Analysis
PyPop 0.7.0 was used to calculate allele frequencies, Hardy-Weinberg equilibrium, deviations from expected genotype and homozygosity frequencies, and for the Ewens-Watterson homozygosity test of neutrality. SPSS 13.0 was used to calculate phenotype frequencies and combined counts of homozygosity for members typed at all loci. Linkage disequilibrium analysis was done by using an online tool developed for LD analysis (http://www.hiv.lanl.gov/). Allele frequencies from different populations were obtained from an online collection of past studies on HLA allele frequencies (http://allelefrequencies.net/).
3. Results
3.1. HLA Class I Allele Diversity and Frequencies
Extensive diversity has been observed at each HLA class I locus in this East African population. Similar to other populations the greater allele diversity is observed in HLA-B, followed by HLA-A, and then HLA-C. A total of 79 HLA-A alleles, 113 HLA-B alleles, and 53 HLA-C alleles were identified in this population excluding many potential new alleles to be identified.
Of the 79 HLA-A alleles identified, 9 with frequencies above 5% (Table 3). These alleles were A * 02:01:01 (10.90%), A * 68:02:01 (9.93%), A * 74:01:01 (7.47%), A * 30:02:01 (7.43%), A * 30:01:01 (6.55%), A * 01:01:01 (6.36%), A * 02:02 (5.76%), A * 03:01:01 (5.76%), and A * 23:01:01 (5.48%). Six of the 113 HLA-B alleles identified in this population are with frequencies above 5% (Table 3). These alleles were B * 58:02 (8.79%), B * 15:03:01 (8.47%), B * 53:01:01 (7.85%), B * 45:01:01 (6.61%), B * 42:01:01 (6.47%), and B *49:01:01 (5.26%). Seven out of the 53 HLA-C alleles identified are with frequencies above 5% (Table 3). These alleles were C * 06:02:01 (16.98%), C * 07:01:01 (14.29%), C * 04:01:01 (13.01%), C * 17:01:01 (9.36%), C * 02:10 (6.67%), C * 16:01:01 (5.95%), and C * 18:01:01 (5.81%). A total of 25 HLA-A alleles, 39 HLA-B alleles and 17 HLA-C alleles were only identified in one individual in the population.

Table 1. List of HLA Class I and II PCR primers and Sequencing PCR primers.
*The primers were combined with DRBPCRR primer in PCR reaction to produce the PCR products.
3.2. HLA Class II Allele Diversity and Frequencies
As expected, the HLA class II loci is less diverse than the class I loci in this population. A total of 25 DPA1 alleles, 60 DPB1 alleles, 15 DQA1 alleles, 44 DQB1 alleles and 40 DRB1 alleles were identified excluding potential new alleles to be confirmed.
Class II alleles with frequencies above 5% in this population were 4 DPA1 alleles [DPA1 * 01:03:01 (40.60%), DPA1 * 02:01:01 (18.40%), DPA1 * 03:01 (17.89%), DPA1 * 02:02:02 (15.83%)], 6 DPB1 alleles [DPB1 * 01:01:01 (23.45%), DPB1 * 04:02:01 (17.56%), DPB1 * 02:01:02 (14.47%), DPB1 * 04:01:01 (9.59%), DPB1 * 03:01:01 (7.86%), DPB1 * 18:01 (5.35%)], 5 DQA1 alleles [DQA1 * 01:02:01 (31.03%), DQA1 * 05:01:01 (25.79%), DQA1 * 01:01:01 (15.59%), DQA1 * 04:01:01 (9.10%), DQA1 * 02:01 (7.22%)], 6 DQB1 alleles [DQB1 * 03:01:01 (21.79%), DQB1 * 06:02:01 (17.46%), DQB1 * 02:01:01 (17.10%), DQB1 * 05:01:01 (16.09%), DQB1 * 06:04:01 (6.91%), DQB1 * 04:02 (6.33%)], and 8 DRB1 alleles [DRB1 * 11:01:02 (11.65%), DRB1 * 13:02:01 (10.78%), DRB1 * 15:03:01 (10.23%), DRB1 * 07:01:01 (7.57%), DRB1 * 11:02 (7.06%), DRB1 * 03:01:01 (6.70%), DRB1 * 03:02:01 (6.42%), and DRB1 * 13:01:01 (5.05%)] (Table 4). For other functional DRB loci, the DRB3 phenotype was most common in the population at 84.77%, the DRB4 phenotype was observed in 22.57% population, and the frequency of the DRB5 phenotype was 21.28%. Only 5 unique DRB3 alleles were identified in this population (Table 4) with DRB3 * 02:02:01 (54.76%), DRB3 * 03:01:01 (25.79%) and DRB3 * 01:01:02 (18.57%) as the most abundant alleles. Only one allele was identified at DRB4 (DRB4 * 01:01:01) and DRB5 (DRB5*01:01:01). Four HLA-DPA1 alleles, 11 DPB1 alleles, 1 DQA1 allele, 5 DQB1 alleles, and six DRB1 alleles were only found in one individual in the population.
3.3. Homozygosity at Class I and Class II Loci
As expected the frequency of homozygosity was lower in HLA class I genes than that in class II genes. The frequencies of homozygosity for class I loci are 5.78%, 6.71% and 9.11% for HLA-B, -A, and -C respectively. Whereas, the frequencies of homozygosity for class II loci are 27.50%, 13.23%, 23.31%, 16.68%, and 8.50% for DPA1, DPB1, DQA1, DQB1 and DRB1, respectively.
Among the 2103 individuals who were fully typed at the class I loci, 297 individuals were homozygous at one class I locus (14.12%), 56 individuals (2.66%) were homozygous at two class I loci, and 16 individuals (0.76%) were homozygous at all three class I loci. Among the 867 individuals who were fully typed at the class II loci, 249 were homozygous at one class II locus, 137 (15.80%) were homozygous at two class II loci, 61 (7.04%) were homozygous at three class II loci, 12 (1.38%) were homozygous at four class II loci, and 8 (0.92%) were homozygous at all the class II loci.
We analyzed homozygosity at all class I and class II loci (excluding DRB3, DRB4, and DRB5) for 834 individuals who have been fully typed for HLA-A, -B, -C, -DRB1, -DPA1, -DPB1, -DQA1 and -DQB1. Of these
Table 2. Allele specific primers for determining multiple results.
Table 3. Frequency of HLA class I (HLA-A, -B, and -C) phenotypes and genotypes in the Pumwani sex worker cohort.
a: Incomplete low-res typing results, b: Cannot determine allele due to SNPs or SNP combinations in sequence that do not exist in database.
fully typed individuals, 246 (29.50%) were homozygous for one loci, 148 (17.56%) were homozygous at two loci, 75 (8.99%) were homozygous at three loci, 20 (2.40%) at four loci, 8 (0.96%) were homozygous at five loci, 1 (0.12%) at 6 loci, 4 (0.48%) at 7 loci and 2 (0.24%) at all loci. The frequency of individuals with one or more homozygous loci was 60.43% in this fully typed subgroup.
The observed homozygosity in HLA-B is higher than expected (P = 0.022), while there is no significant difference between expected and observed homozygosity in HLA-A (P = 0.063) and HLA-C (P = 0.729). At the class II loci, higher than expected homozygosity was observed in HLA-DQA1 (P =0.004), HLA-DQB1 (P = 0.023), and HLA–DRB1 (P = 0.006). The Ewens-Watterson homozygosity test of neutrality was tested on each locus however there were no significant results at any loci. All the class I and class II Allele frequency distributions of the population are visualized in Figure 1 from highest to lowest frequency.
3.4. HLA Genotypes, Haplotypes and Linkage Disequilibrium
Genotype frequencies were analyzed at each locus using Pypop 0.7.0. The following genotypes were more frequent than expected A * 74:01:01-A * 36:01:01 (P = 0.003), A * 30:01:01-24:02:01 (P = 0.003), A * 24:02:01- 02: 02 (P = 0.010), A * 23:01:01-A * 03:01:01 (P = 0.012), A * 74:01-A * 74:01 (P = 0.007), B * 45:01:01-B * 44:03:01 (P = 0.037), B * 57:03:01-B * 07:02:01 (P = 0.003), C * 03:04:02-C * 02:10 (P = 0.008), C * 04:01: 01-C * 03:04:01 (P = 0.007), C * 17:01:01-C * 04:07 (P = 0.020), C * 18:01-C * 07:04:01 (P = 0.020), C * 18:01-C * 16:01:01 (P = 0.012), DPA1 * 03:01-DPA1 * 01:07 (P = 0.001), DPA1 * 01:03:01-DPA1 * 01:03:01 (P = 0.004), DPA1 * 02:02:02-DPA1 * 02:02:02 (P = 0.027), DPB1 * 03:01:01-DPB1 * 30:01 (P = 0.003), DPB1 * 04:01:01-DPB1 * 01:01:01 (P = 0.046), DQA1 * 01:01:01-DQA1 * 01:01:01 (P = 0.008), DQA1 * 03:01:01-DQA1 * 03:01:01 (P = 0.006), DQB1 * 05:01:01-DQB1 * 05:01:01 (P = 0.036), DQB1 * 06:03:01- DQB1 * 03:01:01 (P = 0.034), DQB1 * 06:04:01-DQB1 * 02:01:01 (P = 0.045), and DRB1 * 07:01:01-DRB1 * 15:03:01 (P = 0.004) (Table 5(a)). The following genotypes were less frequent than expected A * 74:01:01-A * 30:01:01 (P = 0.027), C * 16:01:01-C * 06:02:01 (P = 0.030), DPA1 * 02:02:02-DPA1 * 01:03:01 (P = 0.024), DPB1 * 04:02:01-DPB1 * 03:01:01 (P = 0.035) and DQB1 * 03:01:01-DQB1 * 02:01:01 (P = 0.048) (Table 5(b))
3.5. Linkage Disequilibrium Analysis of HLA Class I and II Alleles Identified Specific Class I and Class II Haplotypes
The most abundant two-locus haplotypes were class II haplotypes [DPA1 * 01:03:01-DQA1 * 01:02:01 (16.26%), DQA1 * 05:01:01-DQB1 * 03:01:01 (16.05%), DQA1 * 01:02:01-DQB1 * 06:02:01 (14.88%) and DPA1 * 02:02:02-DPB1 * 01:01:01 (14.43%)]. The most frequent class I two-locus haplotypes were B * 58:02- C * 06:02:01 (8.04%), B * 42:01:01-C * 17:01:01 (6.37%) and B * 15:03:01-C * 02:10 (6.37%). The most common two-locus class I and II haplotypes were C * 07:01:01-DPA1 * 01:03:01 (8.02%), C * 06:02:01-DPA1 * 01:03:01 (6.64%), C * 07:01:01-DQA1 * 01:02:01 (5.93%), C * 04:01:01-DQA1 * 01:02:01 (5.89%), and C * 04:01:01-DPA1 * 01:03:01 (5.89%) (Table 6).
Linkage disequilibrium analysis of HLA class I and II alleles identified specific class I and class II haplotypes (Table 7 and Table 8). This data was obtained using the online tool previously described in the Methods section.
There were 13 unique class I (A-B-C) haplotypes with frequencies above 1% in the population (Table 9) that were identified using Pypop 0.7.0. The most prevalent class I haplotypes were 30:01:01-42:01:01-17:01:01 (3.12%), 02:02-58:02-06:02:01 (2.09%), 36:01-53:01:01-04:01:01 (2.09%) 66:01:01-58:02-06:02:01 (2.04%), 68:02:01-15:10:01-03:04:02 (1.89%), 02:01:01-15:03:01-02:10 (1.74%), 30:02:01-45:01:01-16:01:01 (1.64%), 74:01:01-15:03:01-02:10 (1.57%), 01:01:01-81:01:01-18:01:01 (1.49%), 68:02:01-07:02:01-07:02:01 (1.42%), 74:01:01-58:02-06:02:01 (1.41%), 02:01:01-45:01:01-16:01:01 (1.27%), and 74:01:01-49:01:01-07:01:01
Table 4. Frequency of HLA class II (-DPA1, -DPB1, -DQA1, -DQB1, -DRB1, -DRB3, -DRB4, -DRB5) phenotypes and genotypes in the Pumwani sex worker cohort.
aHigh res not typed; bCannot determine allele due to SNPs or SNP combinations in sequence that do not exist in database; cSample sizes only included high-res typed individuals at that loci.
(1.17%). Nine unique class II haplotypes (DPA1-DPB1-DQA1-DQB1-DRB1) were found in more than 1% of the population (Table 10). These common class II haplotypes were 02:02:02-01:01:01-04:01:01G-04:02- 03:02:01 (2.71%), 03:01-04:02:01-05:01:01-03:01:01-11:02 (2.42%), 01:03:01-02:01:02-01:02:01-06:02:01- 15:03:01 (2.25%), 02:02:02-01:01:01-05:01:01-03:01:01-11:01:02 (2.02%), 01:03:01-04:01:01-01:02:01-06:02: 01-15:03:01 (1.56%), 03:01-04:02:01-01:02:01-06:02:01G-11:01:02 (1.56%), 02:01:01-01:01:01-02:01-02:01: 01-07:01:01 (1.21%), 03:01-04:02:01-02:01-02:01:01-07:01:01 (1.21%), and 03:01-04:02:01-01:02:01-06:02: 01-15:03:01 (1.10%).
 (a)
(a) (b)
(b)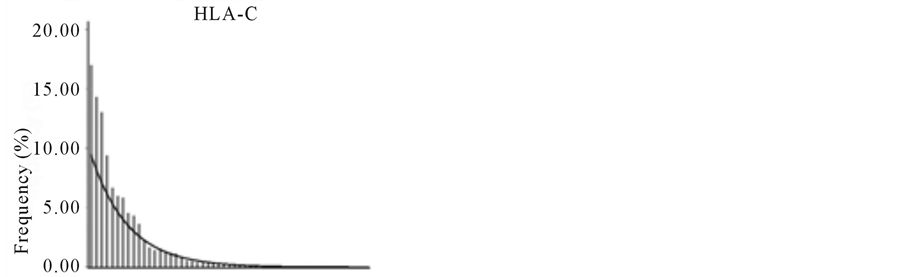 (c)
(c)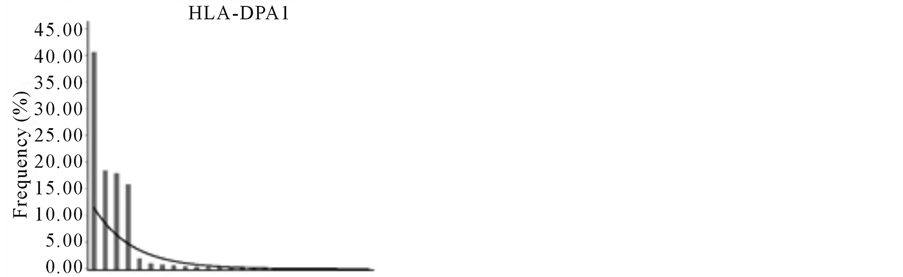 (d)
(d)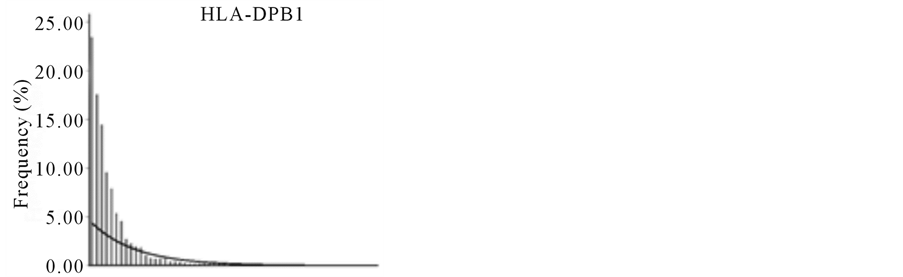 (e)
(e) (f)
(f) (g)
(g)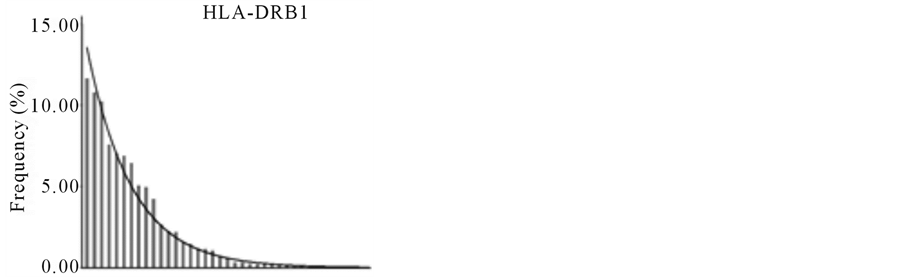 (h)
(h)
Figure 1. Distribution of HLA alleles arranged by highest to lowest frequency in the Pumwani sex worker cohort. (a) HLA-A. (b) HLA-B. (c) HLA-C. (d) HLA-DPA1. (e) HLA-DPB1. (f) HLA-DQA1. (g) HLA-DQB1. (h) HLA-DRB1.
Table 5. HLA Genotypes that deviated significantly from Hardy-Weinberg expectations in the Pumwani sex worker cohort.
3.6. Comparison of HLA Allele Frequencies of Pumwani Cohort with other World Populations
We compared the HLA class I and class II allele frequencies of this population with other populations in the world including Sub-Saharan Africa, western Africa, Europe and Asia [8] (Table 11 and Table 12). As expected the HLA class I and class II allele frequency distribution of Pumwani cohort is very similar to that of other Sub-Saharan Africa and North Africa populations with the exception of lower frequencies of A * 23 (5.55% versus 11.21%) and DQA1 * 03 (4.79% versus 11.72%), and higher frequencies of DPB1 * 30 (2.26% versus 0.37%) and DRB1 * 11 (21.51% versus 15.89%). The frequencies of specific allele groups in Pumwani cohort are much higher than Asian and Caucasian populations, such as A * 29, A * 30, A * 36, A * 66, A * 68, A * 74, B*42, B * 46, B * 58, B * 81, C * 02, C * 06, C * 17, C * 18, DPA1 * 03, DPB1 * 01, DPB1 * 17, DPB1 * 18
Table 6. Common HLA Two-locus Haplotypes in the Pumwani sex worker cohort.
Table 7. Linkage Disequilibrium between HLA class I alleles in the Pumwani sex worker cohort.
Table 8. Linkage Disequilibrium between HLA Class II alleles in the Pumwani sex worker cohort.
Table 9. Frequencies of the most abundant HLA class I haplotypes in the Pumwani sex worker cohort.
DPB1 * 30, and DQA1 * 04. Whereas, the frequencies of B * 51, C * 01, C * 12, DQA1 * 03, DRB1 * 04 and DRB1 * 07 are much lower in Pumwani cohort than Asian and Caucasian populations. B * 38, B * 46, B * 54 and B * 55 were not detected in the more than 2000 women genotyped.
4. Discussion
Analysis of HLA class I and II allele distributions in different populations is an important part of vaccine, anthropological and disease association studies [1] -[3] [5] -[7] [9] -[12] . While many studies have been conducted in a diversity of world populations, few studies have analyzed both class I and class II alleles at the high resolution and few have studied population size as large as ours in this study. The identification of 245 HLA class I alleles and 184 class II alleles in this population, further demonstrates the genetic diversity in this East African population. The HLA class I and class II allele frequency distribution of the East African population will no doubt play an important role in shaping pathogen diversity and influencing pathogen evolution through host-pathogen interactions.
In this study population, homozygosity at the HLA-B -DQA1 and -DPB1 loci was significantly higher than expected. HLA association studies have shown that homozygosity for certain alleles/supertypes was associated with both better and worse clinical outcomes [10] . Frequencies of specific alleles such as A * 74:01, DPA1 * 01:03:01, DPA1 * 02:02:02, DQA1 * 01:01:01, DQA1 * 03:01:01, and DQB1 * 05:01:01 were higher than expected. The significant deviations from expected frequencies may suggest a potential benefit conferred to individuals homozygous for these alleles against common pathogens. For example, A * 74:01 is associated with
Table 11. Comparison of HLA class I (-A, -B, and -C) allele distributions between Pumwani cohort, and other world populations.
-Alleles with frequencies below 2.00% were not included.
slower disease progression to AIDS in HIV infected individuals [13] , DPA1 * 01:03:01 is associated with slower seroconversion in this population [14] .
The frequencies of multiple class I (A-B-C) alleles in this cohort were higher than 1% and majority of them were unique to Sub-Saharan populations including Kenyan Luo and Kenyan Nandi populations. Haplotype A * 30:01-B * 42:01-C * 17:01 has also been identified in a sub-Saharan population [15] and a North African population from Morocco [16] . The existence of similar haplotypes between different ethnic populations suggests an ancestral linkage.
Comparing allele frequencies between different world populations showed similarities among African
Table 12. Comparison of HLA class II (-DPA1, -DPB1, -DQA1, -DQB1, and -DRB1) allele distributions between Pumwani Cohort, and other world populations.
Alleles with frequencies below 2.00% were not included.
populations, and significant difference between African population and other world populations, such as Asian and European populations. While most allele groups were found in every population, there were a few that were unique to specific regions such as B * 46 and B * 54 which was frequent in Asian populations but was rare in western Caucasoid Europeans and African populations, while A * 74 was highly prevalent in sub-Saharan Africa but was rare in other populations. As expected, similar frequencies were observed between this east African population and other sub-Saharan populations (http://www.allelefrequencies.net/). There were a few differences, such as A * 23, DQA1 * 03, DPB1 * 30 and DRB1 * 11.
Genetic diversity at the HLA loci enables this east African population to deal with the great number of infectious pathogens [17] at the population level. The large number of alleles and the new alleles identified in this population [5] [18] -[25] could reflect the founder population under the intensive balanced selective pressure by infectious pathogens. The insignificant deviation from Ewens-Watterson homozygosity test of neutrality could be due to the large number of alleles identified in this population. Furthermore, a recent paper showed that negative frequency-dependent selection can limit the utility of the EW test in detecting selection acting on the HLA genes [26] .
Acknowledgements
We would like to thank Chris Czarnecki, Janis Huntington, Kulvinder Gill, Binhua Liang, Erin Knight, Kimberly, Summer Pham, Cara Weessies, Felicia Foster for their help in HLA typing. We would also like to thank Gary Van Domselaar for the HLA allele format conversion program.
References
- Azurdia, R.M., Luzzi, G.A., Byren, I., et al. (1999) Lichen Sclerosus in Adult Men: A Study of HLA Associations and Susceptibility to Autoimmune Disease. British Journal of Dermatology, 140, 79-83. http://dx.doi.org/10.1046/j.1365-2133.1999.02611.x
- Gladman, D.D., Anhorn, K.A., Schachter, R.K. and Mervart, H. (1986) HLA Antigens in Psoriatic Arthritis. The Journal of Rheumatology, 13, 586-592.
- Rohowsky-Kochan, C., Skurnick, J., Molinaro, D. and Louria, D. (1998) HLA Antigens Associated with Susceptibility/Resistance to HIV-1 Infection. Human Immunology, 59, 802-815. http://dx.doi.org/10.1016/S0198-8859(98)00086-X
- Tishkoff, S.A., Reed, F.A., Friedlaender, F.R., et al. (2009) The Genetic Structure and History of Africans and African Americans. Science, 324, 1035-1044. http://dx.doi.org/10.1126/science.1172257
- Luo, M., Embree, J., Ramdahin, S., et al. (2002) HLA-A and HLA-B in Kenya, Africa: Allele Frequencies and Identification of HLA-B*1567 and HLA-B*4426. Tissue Antigens, 59, 370-380. http://dx.doi.org/10.1034/j.1399-0039.2002.590503.x
- Sanchez-Mazas, A., Steiner, Q.G., Grundschober, C. and Tiercy, J.M. (2000) The Molecular Determination of HLACw Alleles in the Mandenka (West Africa) Reveals a Close Genetic Relationship between Africans and Europeans. Tissue Antigens, 56, 303-312. http://dx.doi.org/10.1034/j.1399-0039.2000.560402.x
- Luo, M., Blanchard, J., Pan, Y., Brunham, K. and Brunham, R.C. (1999) High-Resolution Sequence Typing of HLADQA1 and -DQB1 Exon 2 DNA with Taxonomy-Based Sequence Analysis (TBSA) Allele Assignment. Tissue Antigens, 54, 69-82. http://dx.doi.org/10.1034/j.1399-0039.1999.540108.x
- Middleton, D., Menchaca, L., Rood, H. and Komerofsky, R. (2003) New Allele Frequency Database: http://www.allelefrequencies.net. Tissue Antigens, 61, 403-407. http://dx.doi.org/10.1034/j.1399-0039.2003.00062.x
- Luo, M., Blanchard, J., Brunham, K., et al. (2001) Two-Step High Resolution Sequence-Based HLA-DRB Typing of Exon 2 DNA with Taxonomy-Based Sequence Analysis Allele Assignment. Human Immunology, 62, 1294-310. http://dx.doi.org/10.1016/S0198-8859(01)00339-1
- Flores-Villanueva, P.O., Yunis, E.J., Delgado, J.C., et al. (2001) Control of HIV-1 Viremia and Protection from AIDS Are Associated with HLA-Bw4 Homozygosity. Proceedings of the National Academy of Sciences of the United States of America, 98, 5140-5145. http://dx.doi.org/10.1073/pnas.071548198
- Hill, A.V., Allsopp, C.E., Kwiatkowski, D., et al. (1991) Common West African HLA Antigens Are Associated with Protection from Severe Malaria. Nature, 352, 595-600. http://dx.doi.org/10.1038/352595a0
- Kijak, G.H., Walsh, A.M., Koehler, R.N., et al. (2009) HLA Class I Allele and Haplotype Diversity in Ugandans Supports the Presence of a Major East African Genetic Cluster. Tissue Antigens, 73, 262-269. http://dx.doi.org/10.1111/j.1399-0039.2008.01192.x
- Peterson, T.A., Kimani, J., Wachihi, C., et al. (2013) HLA Class I Associations with Rates of HIV-1 Seroconversion and Disease Progression in the Pumwani Sex Worker Cohort. Tissue Antigens, 81, 93-107. http://dx.doi.org/10.1111/tan.12051
- Hardie, R.A., Knight, E., Bruneau, B., et al. (2008) A Common Human Leucocyte Antigen-DP Genotype Is Associated with Resistance to HIV-1 Infection in Kenyan Sex Workers. AIDS, 22, 2038-2042. http://dx.doi.org/10.1097/QAD.0b013e328311d1a0
- Cao, K., Moormann, A.M., Lyke, K.E., et al. (2004) Differentiation between African Populations Is Evidenced by the Diversity of Alleles and Haplotypes of HLA Class I Loci. Tissue Antigens, 63, 293-325. http://dx.doi.org/10.1111/j.0001-2815.2004.00192.x
- Canossi, A., Piancatelli, D., Aureli, A., et al. (2010) Correlation between Genetic HLA Class I and II Polymorphisms and Anthropological Aspects in the Chaouya Population from Morocco (Arabic Speaking). Tissue Antigens, 76, 177-193. http://dx.doi.org/10.1111/j.1399-0039.2010.01498.x
- Dunn, R.R., Davies, T.J., Harris, N.C. and Gavin, M.C. (2010) Global Drivers of Human Pathogen Richness and Prevalence. Proceedings of the Royal Society: Biological Sciences, 277, 2587-2595. http://dx.doi.org/10.1098/rspb.2010.0340
- Isabey, E.P., Pham, H.M., Peterson, T.A., Brunham, R.C., Luo, M. and Plummer, F.A. (2011) Identification of a Novel HLA-A Allele, A*29:28, in an East African Population. Tissue Antigens, 78, 451-452. http://dx.doi.org/10.1111/j.1399-0039.2011.01741.x
- Luo, M., Blanchard, J., Maclean, I. and Brunham, R. (1999) Identification of a Novel HLA-DQA1 Allele (DQA1*0106) by Sequence-Based DQA1 Typing. Tissue Antigens, 53, 595-596. http://dx.doi.org/10.1034/j.1399-0039.1999.530613.x
- Luo, M., Blanchard, J., Maclean, I. and Brunham, R. (1999) Identification of a Novel DQB1 Allele DBQ1*0616. Tissue Antigens, 53, 381-382. http://dx.doi.org/10.1034/j.1399-0039.1999.530410.x
- Luo, M., Blanchard, J., Maclean, I. and Brunham, R. (2001) Identification of a Novel DRB1 Allele, DRB1*1112, by Sequence-Based DRB Typing. Tissue Antigens, 57, 85-86. http://dx.doi.org/10.1034/j.1399-0039.2001.057001085.x
- Luo, M., Cohen, C.R., Narayansingh, M.J., et al. (2004) Identification of a Novel HLA-DQA1 Null Allele, DQA1*0403N, from an East African Woman. Tissue Antigens, 63, 609-611. http://dx.doi.org/10.1111/j.0001-2815.2004.00231.x
- Luo, M., Mao, X. and Plummer, F.A. (2005) Identification of Four Novel HLA-B Alleles, B*1590, B*1591, B*2726, and B*4705, from an East African Population by High-Resolution Sequence-Based Typing. Tissue Antigens, 65, 187-191. http://dx.doi.org/10.1111/j.1399-0039.2005.00338.x
- Peterson, T.A., Luo, M., Mao, X., Brunham, R.C. and Plummer, F.A. (2008) Identification of a Novel DPA1 Allele, DPA1*010602, in an East African Population. Human Immunology, 69, 885-886. http://dx.doi.org/10.1016/j.humimm.2008.09.001
- Turk, W.J., Mao, X.J., Bielawny, T., Brunham, R., Luo, M. and Plummer, F.A. (2008) Identification of Novel Human Leukocyte Antigen G Alleles in an East African Population by High-Resolution Sequence-Based Typing. Human Immunology, 69, 426-429. http://dx.doi.org/10.1016/j.humimm.2008.05.007
- Ejsmond, M.J., Babik, W. and Radwan, J. (2010) MHC Allele Frequency Distributions under Parasite-Driven Selection: A Simulation Model. BMC Evolutionary Biology, 10, 332. http://dx.doi.org/10.1186/1471-2148-10-332
NOTES

*Corresponding author.