Open Journal of Preventive Medicine
Vol.3 No.5(2013), Article ID:35846,13 pages DOI:10.4236/ojpm.2013.35052
Measuring the effect of opportunity cost of time on participation in sports and exercise*
![]()
Health Economics Research Group (HERG), Brunel University, Uxbridge, Middlesex, UK; #Corresponding author: Nana.Anokye@brunel.ac.uk, Subhash.Pokhrel@brunel.ac.uk, Julia.Fox-Rushby@brunel.ac.uk
Copyright © 2013 Nana Kwame Anokye et al. This is an open access article distributed under the Creative Commons Attribution License, which permits unrestricted use, distribution, and reproduction in any medium, provided the original work is properly cited.
Received 29 May 2013; revised 30 June 2013; accepted 17 July 2013
Keywords: Physical Activity; Sports and Exercise; Opportunity Cost of Time; Index
ABSTRACT
Background: There is limited research on the association between opportunity cost of time and sports and exercise due to lack of data on opportunity cost of time. Using a sample of 14142 adults from Health Survey for England (2006), we develop and test a composite index of opportunity cost of time (to address the current issues with data constraint on opportunity cost of time) in order to explore the relationship between opportunity cost of time and sports participation. Methods: Probit regression models are fitted adjusting for a range of covariates. Opportunity cost of time is measured with two proxy measures: a) composite index (consisting of various indicators of wage earnings) constructed using principal component analysis; and b) education and employment, approach in the literature. We estimate the relative impact of the composite index compared with current proxy measures, on prediction of sports participation. Findings: Findings suggest that higher opportunity cost of time is associated with increased likelihood of sports participation, regardless of the time intensity of activity or the measure of opportunity cost of time used. The relative impacts of the two proxy measures are comparable. Sports and exercise was found to be positively correlated with income. Another important positive correlate of sports and exercise is participation in voluntary activity. The research and policy implications of our findings are discussed.
1. INTRODUCTION
Economic theory suggests that the demand for sports and exercise is a function of money prices (e.g. membership fees, entrance fees) and time price (e.g. opportunity cost of time, travel time), among other factors. Understanding this relationship could inform policies aimed at encouraging levels and participation in sports and exercise and contribute to broader public health debates [1,2]. In the English context where physical inactivity related costs are estimated at £8.2 billion annually [3], and only 1 in 4 people meet the recommended level of physical activity [4], the information as to how prices can affect levels of participation in physical activity is of relevance to decision makers in search of policies to incentivise physical activity in the general population [5]. In this paper, we focus on the specification of opportunity cost of time because there is insufficient evidence on its effect on sports participation [6,7].
The opportunity cost of time is defined as the shadow price of leisure that is specified, in practice, as wage earnings [8-12]. This assumes that an individual in the labour market faces a flexible number of working hours and that labour time can be substituted for leisure at the margin, where the labour market is assumed to be in equilibrium. In making decisions about how to allocate time to leisure activities such as sports and exercise, individuals are therefore faced with trade-offs involving their alternative use of time/labour. People are assumed to balance the ratio of marginal utilities and opportunity costs of time associated with the competing arguments in deciding whether or not to participate in sports and exercise.
The few attempts to assess the influence of opportunity cost of time on sports and exercise have yielded mixed findings. Brown and Roberts [6] analysed frequency of participation in sports and exercise and found a mixed impact for opportunity cost of time among men but a positive effect for women. Humphreys and Ruseski [2] found a positive effect for participation (or not) in sports whilst Humphreys and Ruseski [13,14] found mixed effects. Mixed effects were also observed for the relationship between opportunity cost of time and time spent on sports and exercise (differing by sports), given participation [2,13,14]. The overall mix in findings about opportunity cost of time are not surprising because the effect of opportunity cost of time on sports and exercise could be interpreted from the interaction of income and substitution effects. The income effect corresponds to a positive effect of opportunity cost of time such that if sports and exercise is a normal good, then increases in wage earnings (higher opportunity cost of time) would reflect positively on participation levels in sports and exercise. On the other hand, increases in wage earnings could make non-labour uses of time non-profitable, thereby increasing the tendency to substitute time spent on non-labour for labour market—substitution effect. Other reasons such as differences in sample and various specifications of sports and exercise used by the studies could also explain the mixed findings.
Apart from the scarcity of evidence, it is difficult to relate the current evidence on opportunity cost of time to policy formulation in England because the evidence is based on North American [2,13,14] and Australia populations [6]. The lack of evidence in England could be attributed to lack of data [15] as the national surveys with extensive measures on sports and exercise i.e. Health Survey for England, and Active People Survey [16] do not collect data on the opportunity cost of time. These surveys collect information on total income (including both wage and non wage earnings), which is limiting because it includes income from sources such as benefits in addition to labour income.
Such data constraints have confronted other researchers and prompted North American studies [13,14] to use proxies (i.e. education attainment and employment status) to measure opportunity cost of time. Education and employment were chosen as proxies because high educational attainment reflects high wage earnings [17], whereas being employed indicates the receipt of wage earnings. A similar approach is followed in this study, with a nationwide representative dataset with no direct measures for opportunity cost of time. Using proxies might produce errors in analysis due to imperfect specification of the opportunity cost of time. However, weak proxies are still able to identify departures from a null hypothesis [18].
Whilst proxies help to indicate the opportunity cost of time, a number of concerns exist around the current proxies in the literature. First, they may not provide an adequate assessment of the concept’s (i.e. opportunity cost of time) effect as some proxies may have direct and indirect influences on the dependent variable—sports and exercise [19]. For example, while educational attainment may be a proxy for opportunity cost of time, it may also reflect permanent preference for sports and exercise because of increased years of sports participation in school [20]. Kolenikov and Angeles [21] therefore argue for the need to include as many proxies as data would allow, accounting for the potential measurement errors. Second, entering proxies as separate variables in a regression model may lead to redundancy in the proxies [22] and reduction in degrees of freedom. A standard approach to resolving these issues is the aggregation of the proxies to create a uni-dimensional measure (a composite index) [23]. This approach has been used extensively in healthcare and education literature, e.g. to create wealth and socio-economic status (SES) indices to study the effect of SES on health care utilisation [24-27] and educational enrolments [19,28,29]. Whilst this method may lack clear definition on the number of variables to include in the index, it offers a pragmatic and robust approach to dealing with data unavailability [24,30]. Our study demonstrates the usefulness of this pragmatic method in addressing data constraints in the literature on opportunity cost of time and sports literature.
An important gap in the literature on opportunity cost of time is the paucity of evidence on how the relationship between opportunity cost of time and sports participation differs across different types of sports. Different types of sports have varying time requirements and hence different time costs [14,31]. Therefore, the impact of opportunity cost of time on participation could differ across type of sports as, for example, individuals with high opportunity cost of time may tend to participate in sports with lower time requirements [31]. This is important because it could allow policy to target specific sports.
The primary aim of this paper is to develop and test a composite index of opportunity cost of time (to address the current issues with data constraint on opportunity cost of time) in order to explore the relationship between opportunity cost of time and sports participation. This builds on previous work around proxy measures, and estimate the relative impact of the composite index compared with current proxy measures, on prediction of sports participation. The secondary aim is to determine how the association between opportunity cost of time and participation differ by time intensity of sports activities.
2. METHODS
2.1. Data
Data from the 2006 Health Survey for England (HSE), a routine cross sectional survey of a nationally representative sample of persons living in private households in England, was used. The sample included 14,142 adults (aged 16 or more) from interviews were undertaken between January 2006 and May 2007. The main topics were: cardiovascular disease and risk factors, levels of physical activity, general health, smoking, fruit and vegetable consumption, smoking and alcohol intake.
2.2. Methods of Analysis
2.2.1. Missing Observations
Chi square and Fischer’s exact tests were used to examine the mechanisms under which the missingness occurred (i.e. missing completely at random or not) [32]. If the pattern of missingness did not occur completely at random, a regression based imputation method was used to replace missing values of continuous variables and a dummy variable specifying item-non response added. For the categorical variables, item non-response was included in the omitted category and a dummy variable for item non-response was created [33].
2.2.2. Regression Models
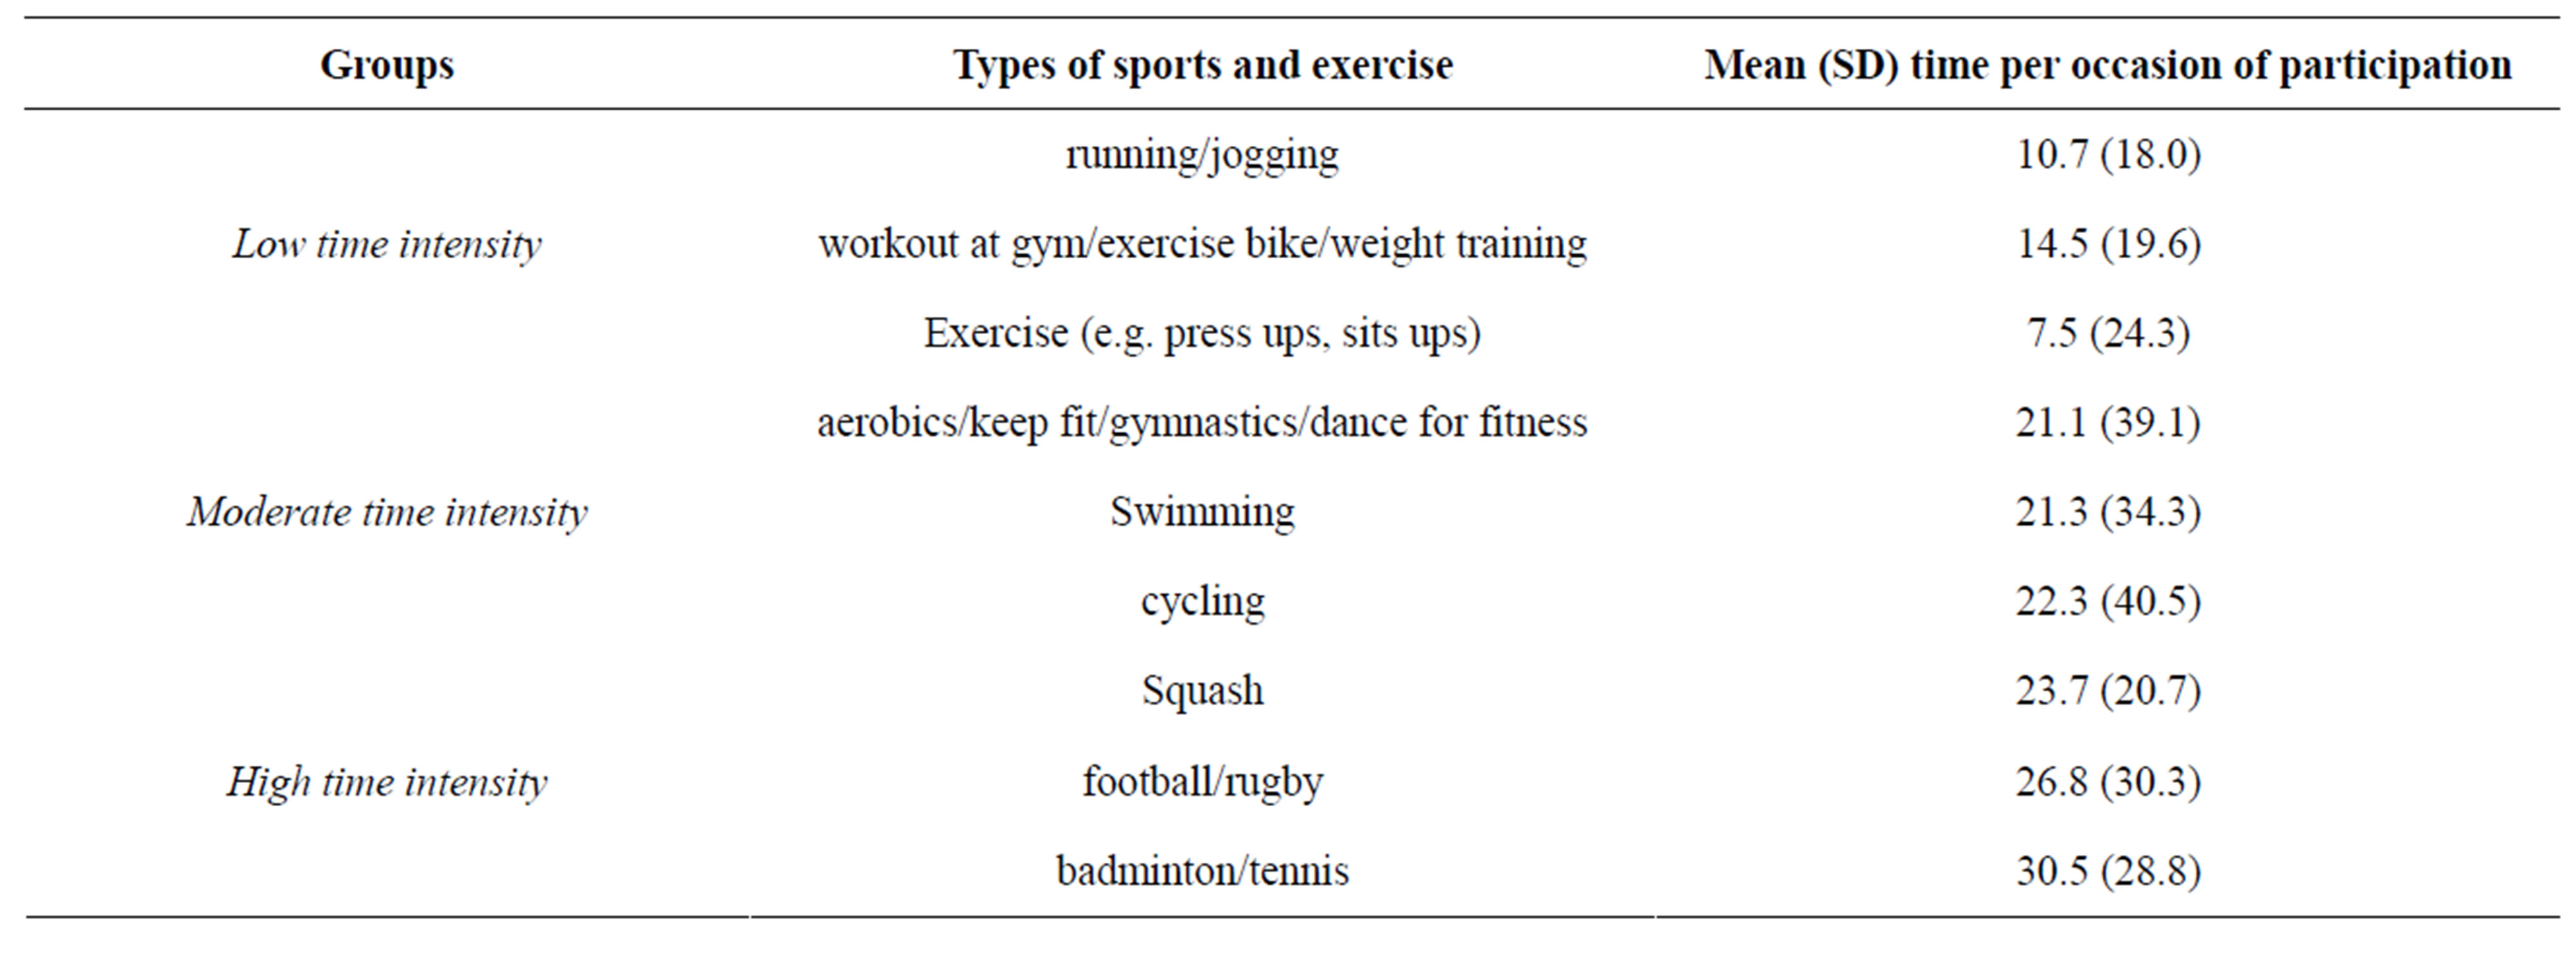
Probit regression models were fitted, respectively, for four dependent variables that indicated participation (or not) in: 1) any sports and exercise activity (swimming, cycling, workout at gym/exercise bike/weight training, aerobics/keep fit/gymnastics/dancing, running/jogging, football/rugby, badminton/tennis, squash, and press/sits ups); 2) low time intensity (press/sits ups, running/ jogging, workout at gym/exercise bike/weight training); 3) moderate time intensity (aerobics/keep fit/gymnastics/ dancing, swimming, cycling) and; 4) high time intensity activities (squash, football/rugby, badminton/tennis). To allow activity specific analysis, the average time spent on each occasion of participation in each of the different sports and exercise activities was calculated and used as the basis to categorise the activities into the 3 groups reflecting the magnitude of their time requirement (31). Three activities each were allocated to a group to afford sufficient observations for analysis (see Appendix).
Each dependent variable was estimated with separate models for: 1) current proxy measures for opportunity cost of time (i.e. educational attainment and employment status), approach in the literature; 2) composite index for opportunity cost of time. For clarity of presentation, the latter measure is henceforth referred to as “composite index”, and the former “proxies”. All models included covariates (i.e. economic, socio-demographic, health, and other variables) that in previous research had been shown to correlate with sports and exercise. Table 1 shows these variables and their distributions based on means (standard deviation) and proportions.
The models were estimated with sampling weights calculated as the inverse of the probability of being a respondent in a household multiplied by the household weight which accounts for non-responding households [34]. Marginal effects (ME), estimated at sample mean values of independent variables, were computed for each variable. The threshold for statistical significance was set at ≤10% and analyses were undertaken using Stata version 10.
2.3. Construction of Composite Index for Opportunity Cost of Time
Various methods are available to create composite indices e.g. correspondence analysis, simple summation, factor analysis and principal component analysis [23,30, 35]. A principal component analysis (PCA) was selected because it: provides more accurate weights and minimises the variance from observations compared with simple summation [23]; is applicable to both categorical and continuous data, unlike correspondence analysis that can only be used for categorical data (30); and is similar to factor analysis as both express variables as a set of indices, and lead to similar highly-correlated results [36]. In practice PCA is the most common approach used to aggregate data from a number of variables [19,24-29].
We used the polychoric PCA estimation technique as it produces more robust estimates than the regular PCA [21]. In practice, the principal component analysis derives uncorrelated indices or components from a set of correlated variables (i.e. proxies of opportunity cost of time in this context). Each of the indices or components represents a linear weighted aggregation of the set of variables.
Mathematically, the derived indices or principal components say from Ia - If, can be specified as:
where Xjth = the original variables (or proxies), zjth = the weight for the variables (or proxies).
The components or indices are presented in decreasing order of importance, which is measured by the variance explained by the components or index from the given data. The first component or index, which is often used to measure the intended concept, explains the largest variation followed by the successive components in decreasing order [29,30].
A first step in constructing the proxy index for opportunity cost of time, involves the selection of variables that may be proxy indicators for opportunity cost of time. Previous construction of composite indices has tended to select variables on “adhoc basis” [18]. In this paper, the following variables were selected to construct the composite index because they have been widely found in previous research (comparable to the UK context) to be correlates of wage earnings and were available in the HSE 2006. These were: membership of trade or workers union [37-40], employee in big firms (500 or more employees) [40,41], having a highly skilled occupation [38,40,42], educational attainment [17], and employment status [38,39,43,44]. Data limitations precluded the selection of variables including “years of work experience”; and “parental socio economic status” [45]. The second half of Table 2 shows the selected variables and their distributions based on proportions. Previous construction of composite indices has tended to select variables on “adhoc basis” [18].
The composite index was assessed using Bartlett’s test for sphericity, and the Kaiser-Meyer-Olkin Measure of Sampling Adequacy to check whether the variables used to construct the index had the requisite intercorrelation [46]. Both statistical tests should show an acceptable strength of correlation among the selected variables (i.e. statistical significant (at 5%) result for Bartlett test of sphericity and a value of not less than 0.50 for the Kaiser-Mayer-Olkin measure of sampling adequacy) for PCA to be considered valid [46].
To compare the composite index with proxies, their relative impact on the predictive ability of models and whether the direction of correlation between covariates and dependent variable(s) in models (containing either measure) related to a priori expectations (set out in Table 2) were assessed. The expected signs were selected based on a comparison of methods (e.g. specification of the dependent variable and the covariate; the origin and characteristics of the sample) used by the studies to ours.
3. RESULTS
Table 2 shows the summary statistics for the variables included. The sample was predominately White (89.1%) with the remaining 11% constituting Asians, Chinese, Mixed race, and Blacks, and had a mean age of 49.3 (SD: 18.6) years. Of the sample, 55.3% were female. Most were married and living with their partners (54.5%), and reported good health status (73.1%). Few (21.3%) were defined as obese or smokers (21.9%), though the majority were “drinkers” (79.9%). 44.2% had participated in any sports and exercise activity within the last four weeks. Of those, about 22% participated in low and moderate time intensity activities and less than 9% were engaged in high time intensity activities.
The dependent variables had 10 missing observations each (same people) and were dropped from analysis. All explanatory variables (except region of residence, age, gender, urban residence, number of children in household, number of adults in household, and seasonal effect) had missing observations. Income had the highest number of missing observations (n = 2792) while “marital status” and “health status” had the lowest (n = 3). The proportion of sports and exercise participants who had missing values for independent variables were statistically significantly different from “non-participants”, (except “marital status”, “working hours”, “drinking status”, “smoking status” and “access to vehicle”) and therefore the missing observations of all explanatory variables were replaced.
The strength of correlation among the variables selected for construction of the composite index showed an appropriate intercorrelation and hence the composite index consists of all those variables. A score of 0.60 was found for the Kaiser-Meyer-Olkin Measure of Sampling Adequacy while Bartlett test of sphericity was highly statistically significant (p < 0.001). The first principal component explained 39% of the total data and is thus selected as the composite index. Education provided more information on the composite index with an estimated coefficient of 0.78 followed by union membership (0.48) while skilled occupation was the least (0.26).
Regression Models
The opportunity cost of time as captured by the proxies, was positively associated with the participation in sports and exercise. People with high opportunity cost of time were 7% more likely to participate in any sports and exercise (Table 3). Table 4 shows that the association was also positive and significant in moderate (6%) and low time activities (3%). In high time intensity activities, the correlation was mixed, as proxy 1 (degree holders) indicated that people with high opportunity cost of time were 1% more likely to participate in sports and exercise, while proxy 2 (employed) suggested that these individuals were 1% less likely to participate in sports and exercise (Table 4).
The composite index measure of opportunity cost of time also showed a positive correlation (3%) with participation in any sports and exercise (Table 3). However, Table 4 shows that by type of activity, a positive relationship was found only for low and moderate time intensity activities and that the impacts were slightly lower (1% and 2%) respectively.
Other factors that were statistically significantly correlated with the increased likelihood to participate in sports and exercise (irrespective of type) included high income earners (ME = 0.012 to 0.089), “drinkers” (ME = 0.088), favourable health status (ME = 0.039 to 0.224), and voluntary activity (ME = 0.033 to 0.035). Conversely, residents in North East/West, Yorkshire, and London were less likely to participate (ME = −0.068 to −0.098). Being older (ME = −0.002 to −0.008), female (ME = −0.44 to −0.089), married (ME = −0.036 to −0.038), Asian (ME = −0.078 to −0.126), smoker (ME = −0.048 to −0.077), obese (ME = −0.016 to −0.052), or a fulltime

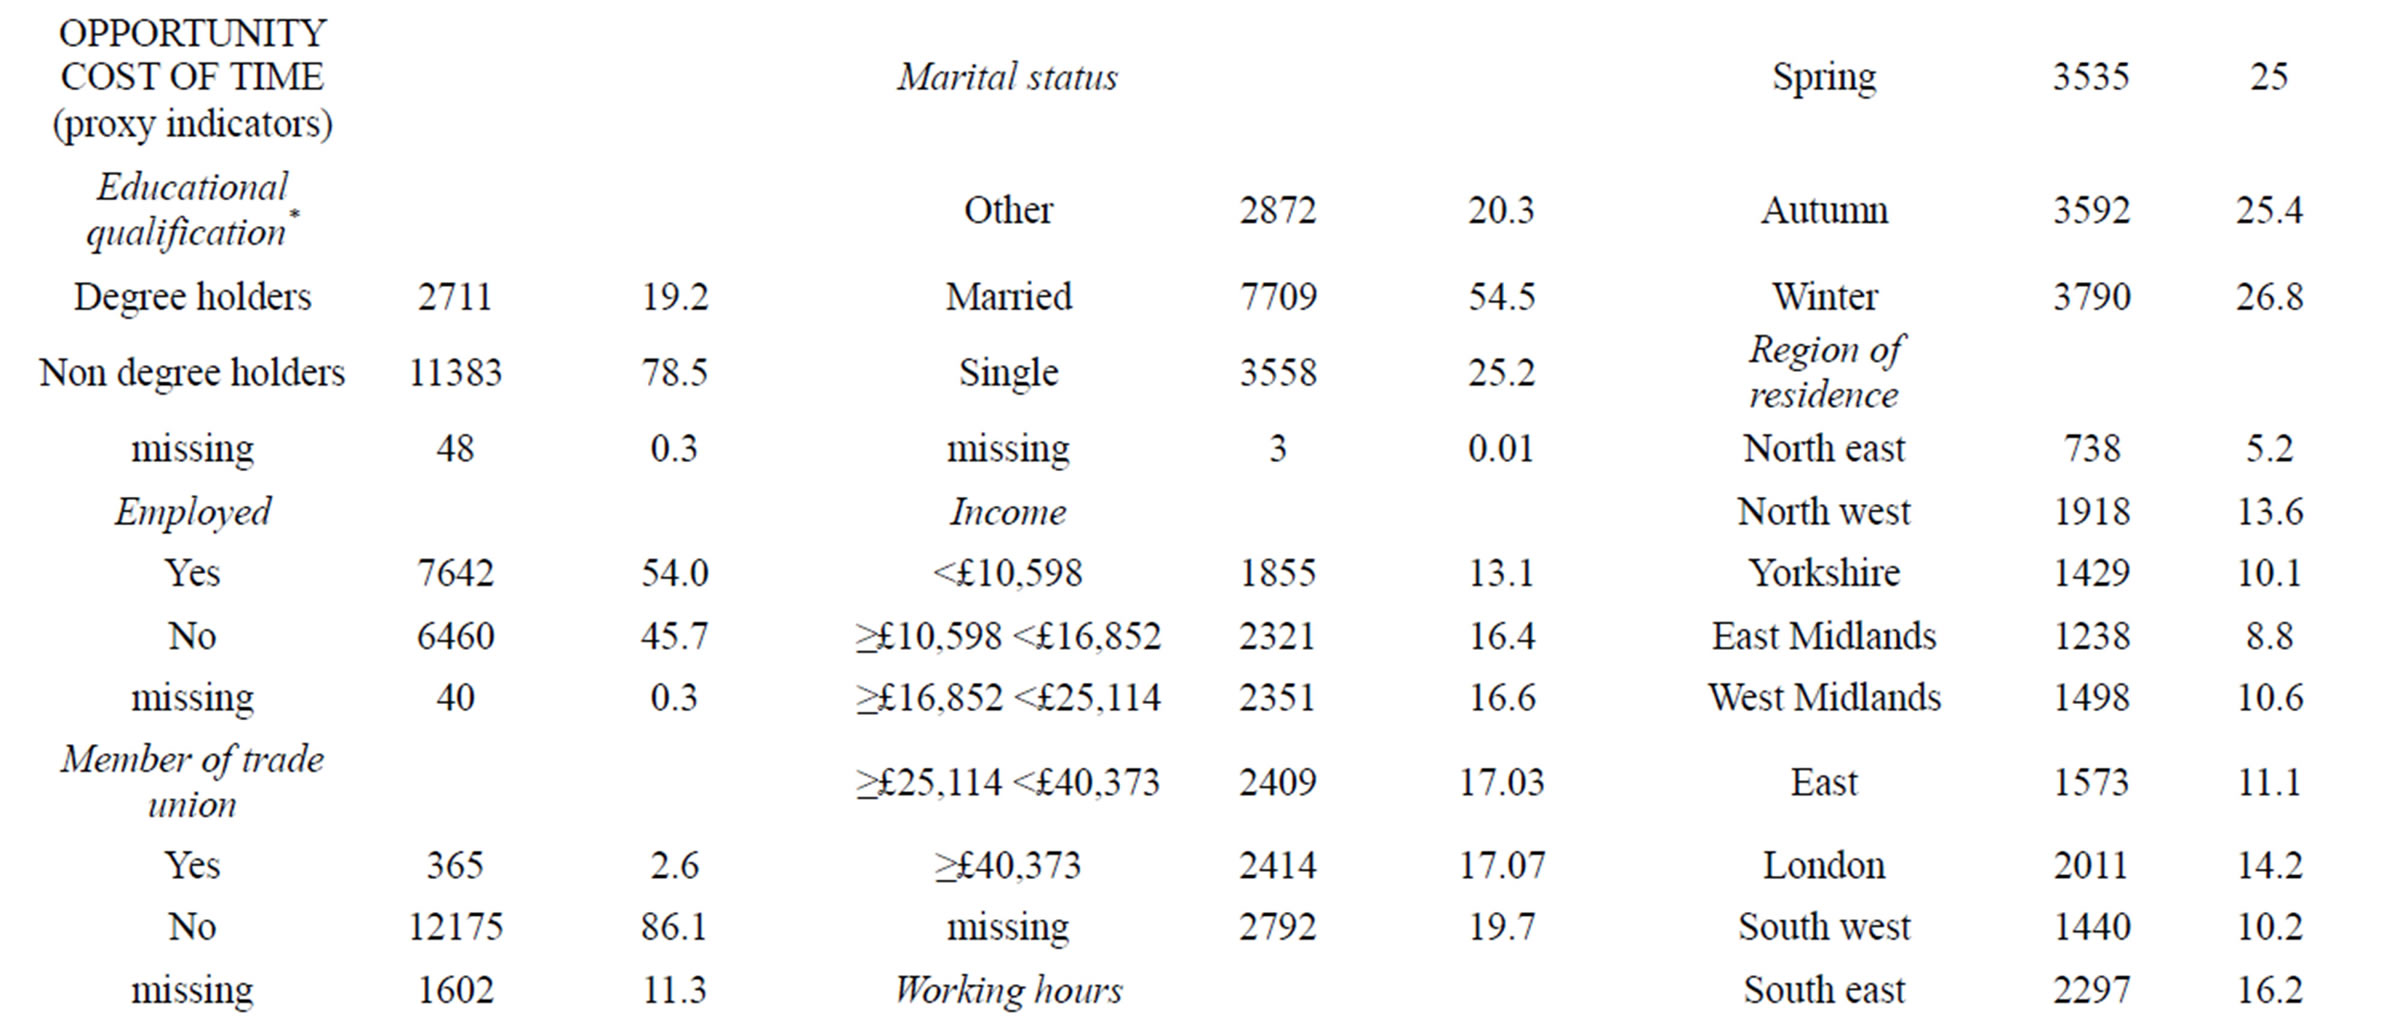
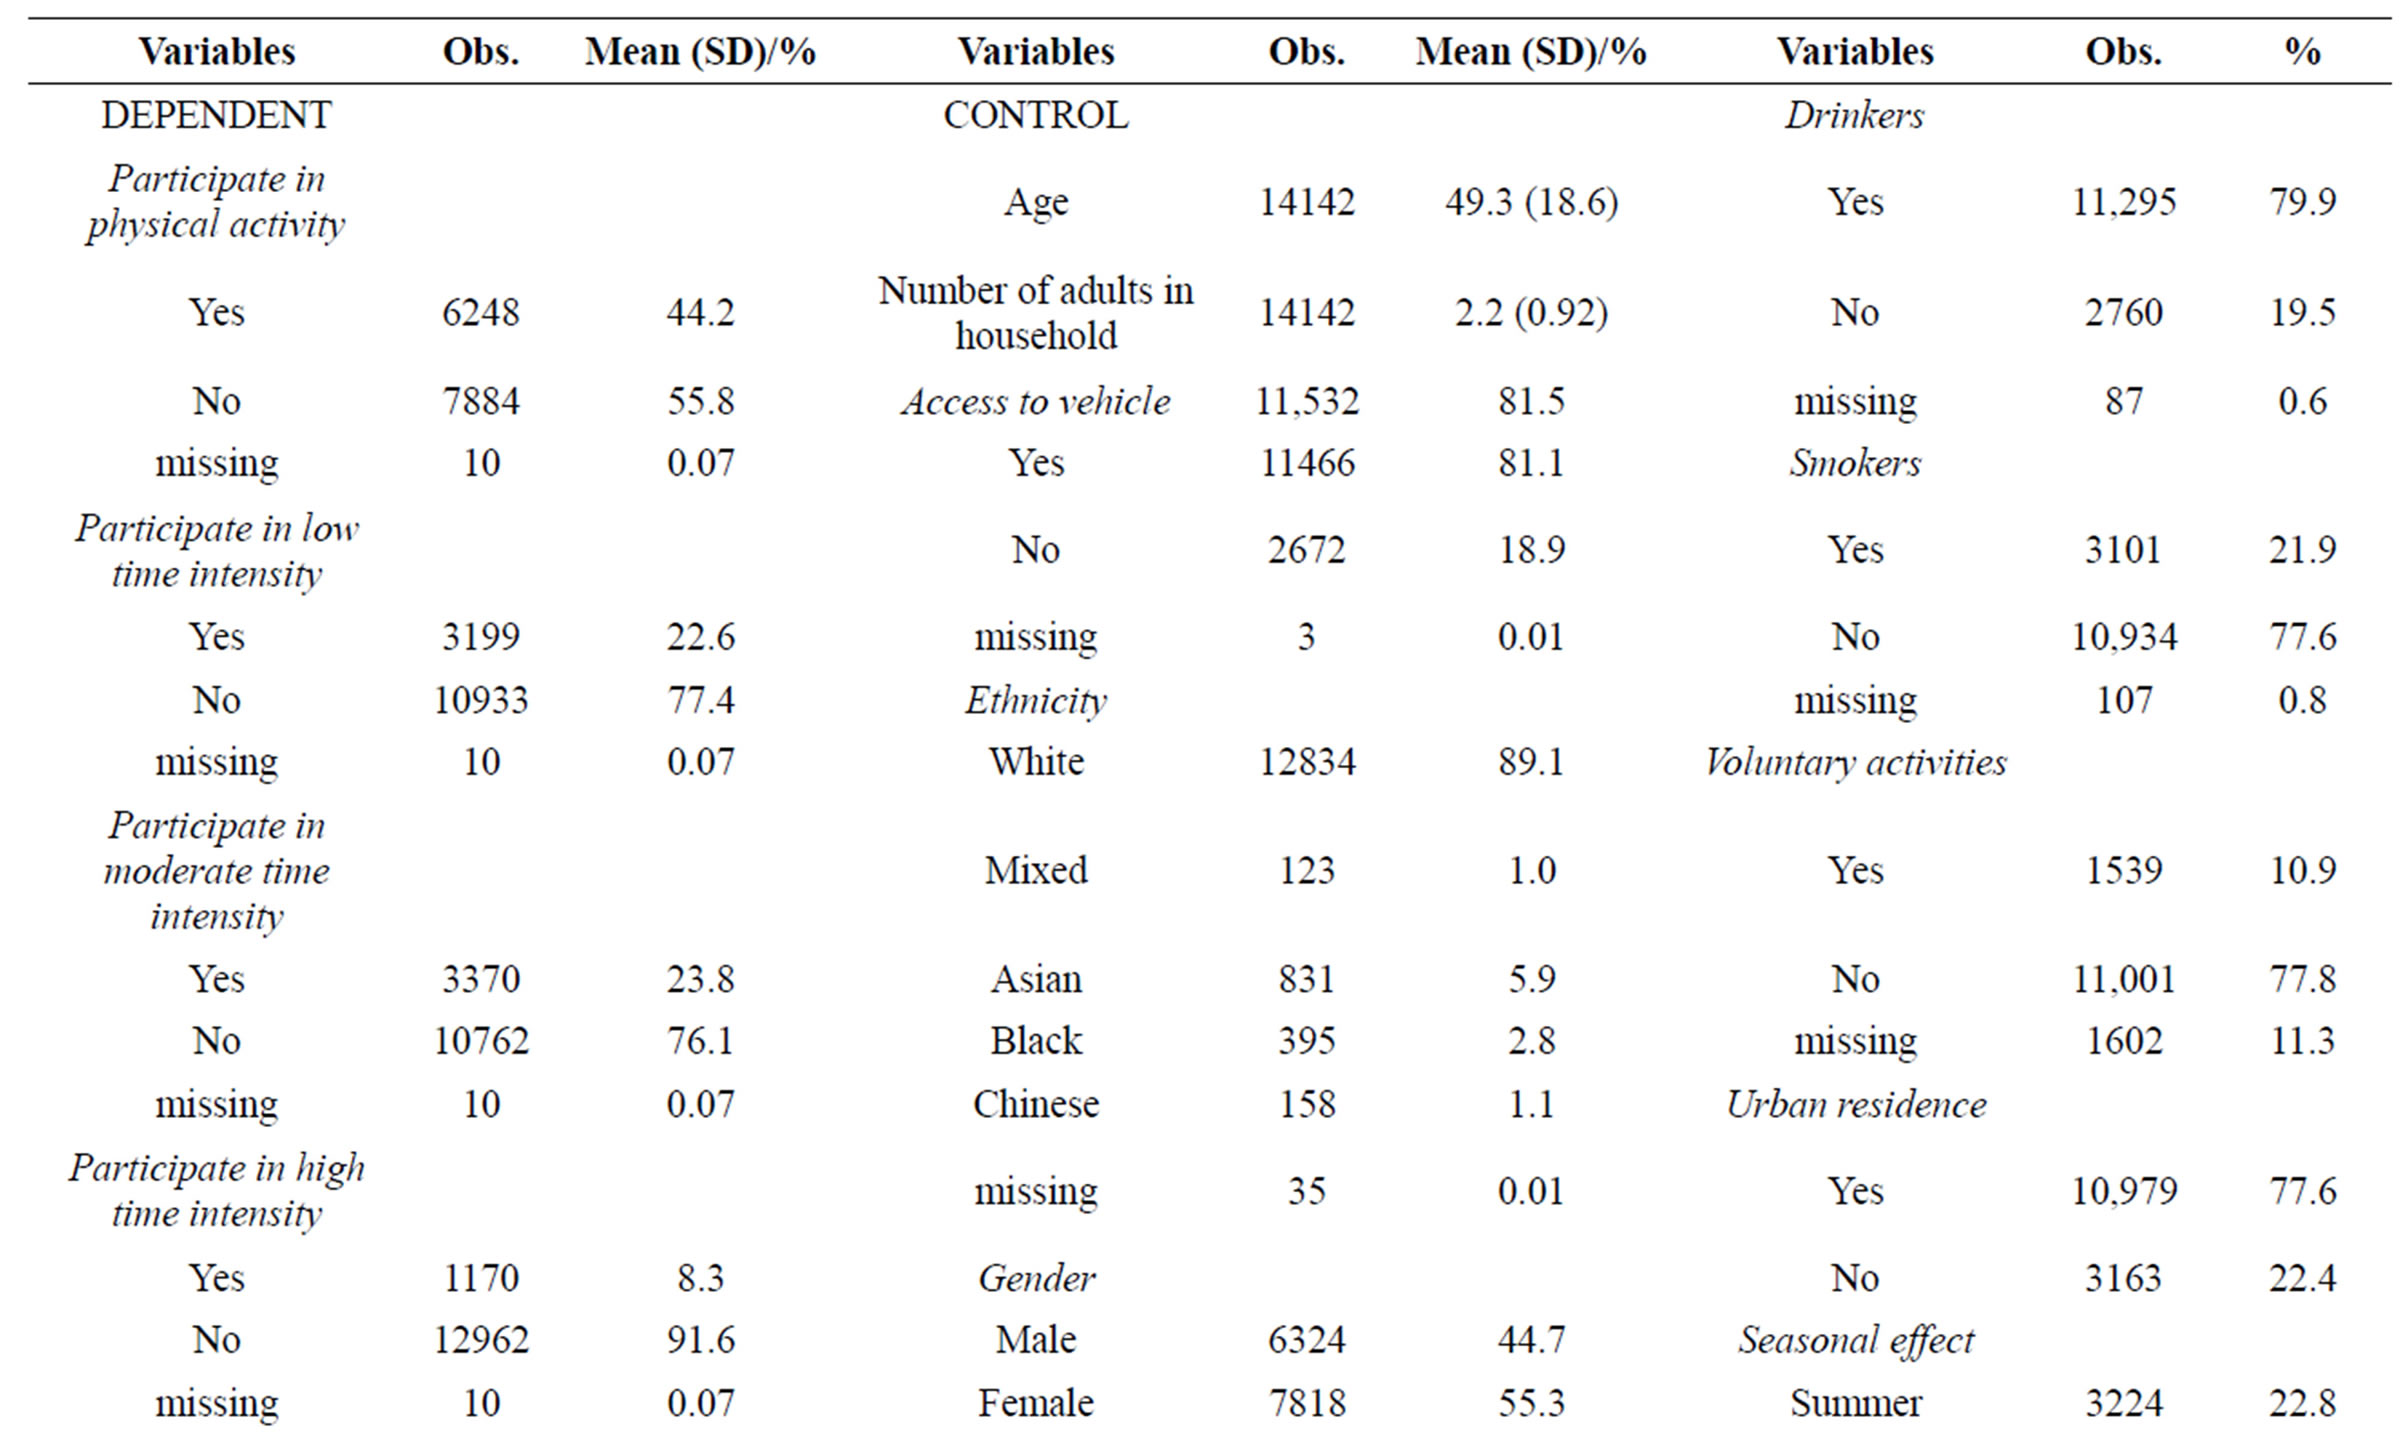
Table 1. Descriptive statistics of variables (adjusted for missing observations).
*This specification was used because it provided the best fit for the regression models.
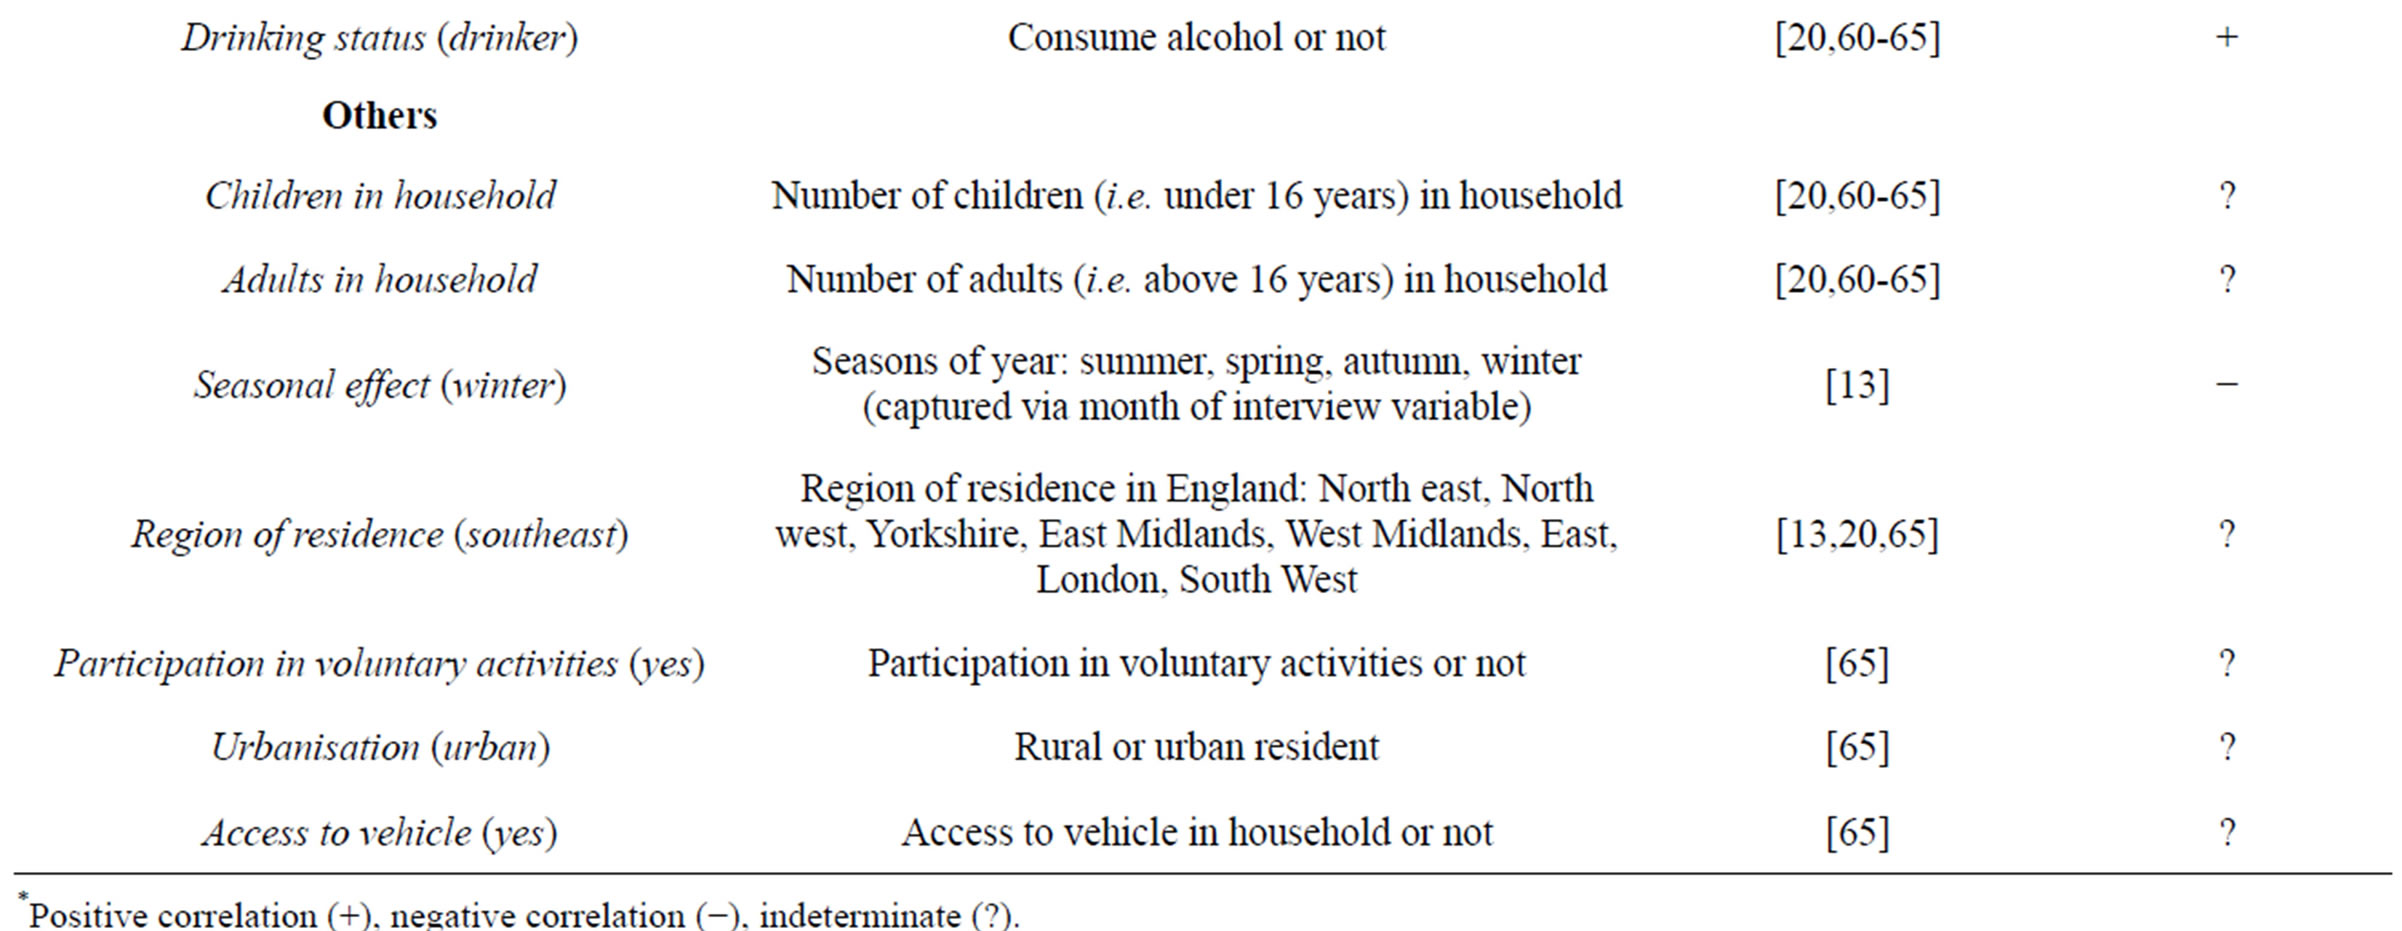
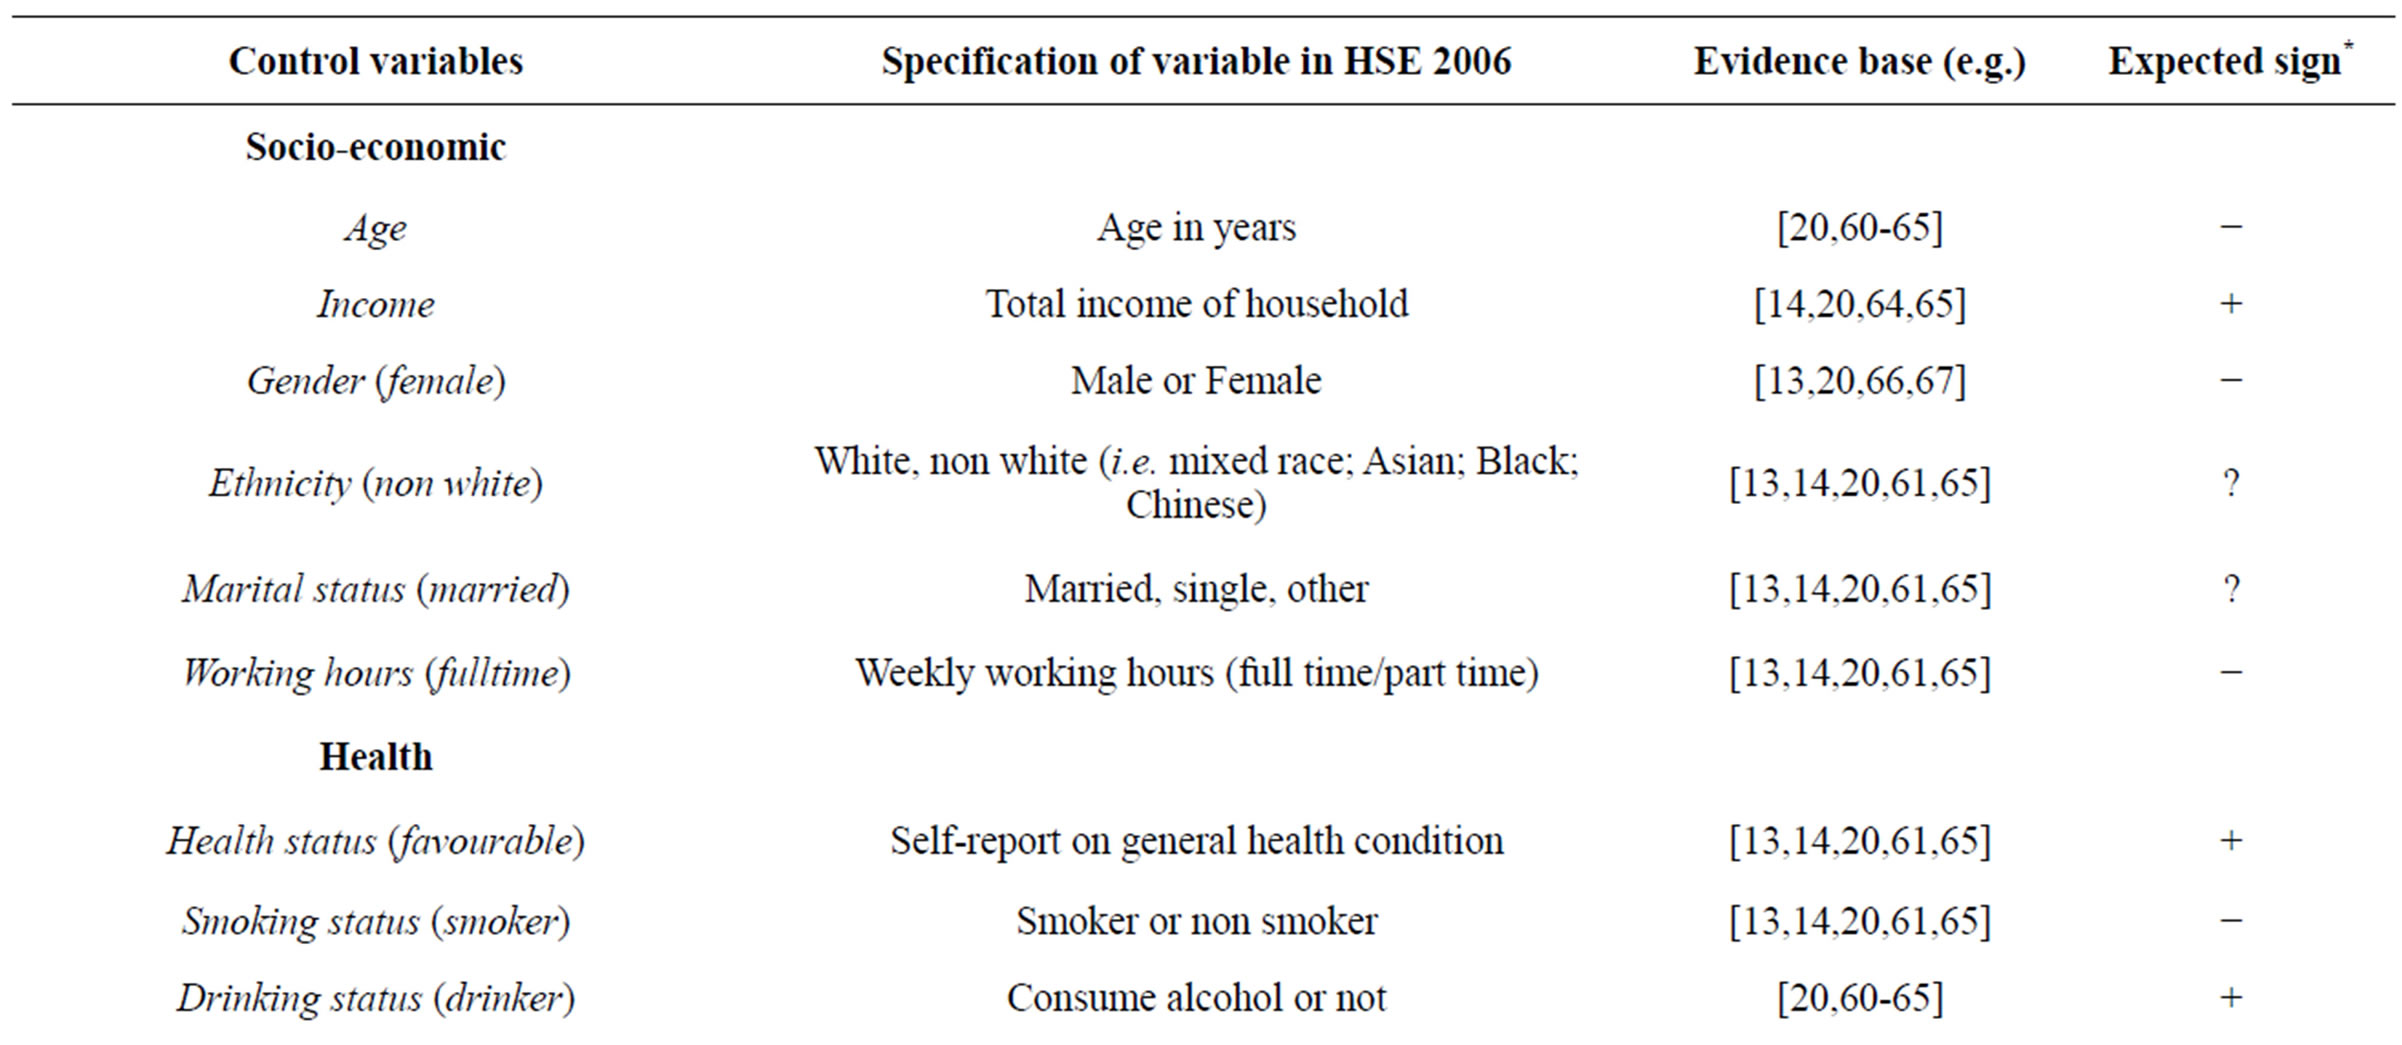
Table 2. A priori expectations about control variables.
*Positive correlation (+), negative correlation (−), indeterminate (?).
worker (ME = −0.015 to −0.035) were all associated with lower participation (p < 0.01). These results were consistent across models with either measure of opportunity cost of time.
There were, however, some differences across activity specific models. For example, Blacks or females were more likely to participate (ME = 0.177; 0.094 respectively) in low time intensity activity but less likely to participate (ME = −0.417; −0.211 respectively) in moderate time intensity activity. Having more adults in the household was also negatively associated with participation in moderate time intensity activity (ME = −0.052) although positively correlated with high time intensity activity (ME = −0.050). Other results include being married or exercising in autumn that were correlated with lower participation (ME = −0.114; −0.091 respectively) in low time intensity activity but associated with higher participation (ME = 0.417; 0.253 respectively) in moderate time intensity activity.
In terms of explaining participation in any sports and exercise, the model with composite index had a prediction rate of 73.96% while the model with proxies had 73.94%. These findings were consistent across activity specific models. Tables 3-5 show that all sets of models met a priori expectations.
4. DISCUSSION
Opportunity cost of time was found to be positively associated with sports and exercise, regardless of the time intensity of activity or the measure of opportunity cost of time used (composite index and the proxies). The magnitude of impact was not large suggesting that the increase in wage earnings may not be directly transferable to active leisure purposes. This may explain why sports and exercise, although a normal good, is not highly sensitive to changes in income. The positive correlation between opportunity cost of time and sports and exercise could be due to the dominant income effect and the offsetting effect of perceived benefits. An exploration of the offsetting effect of perceived benefits using data
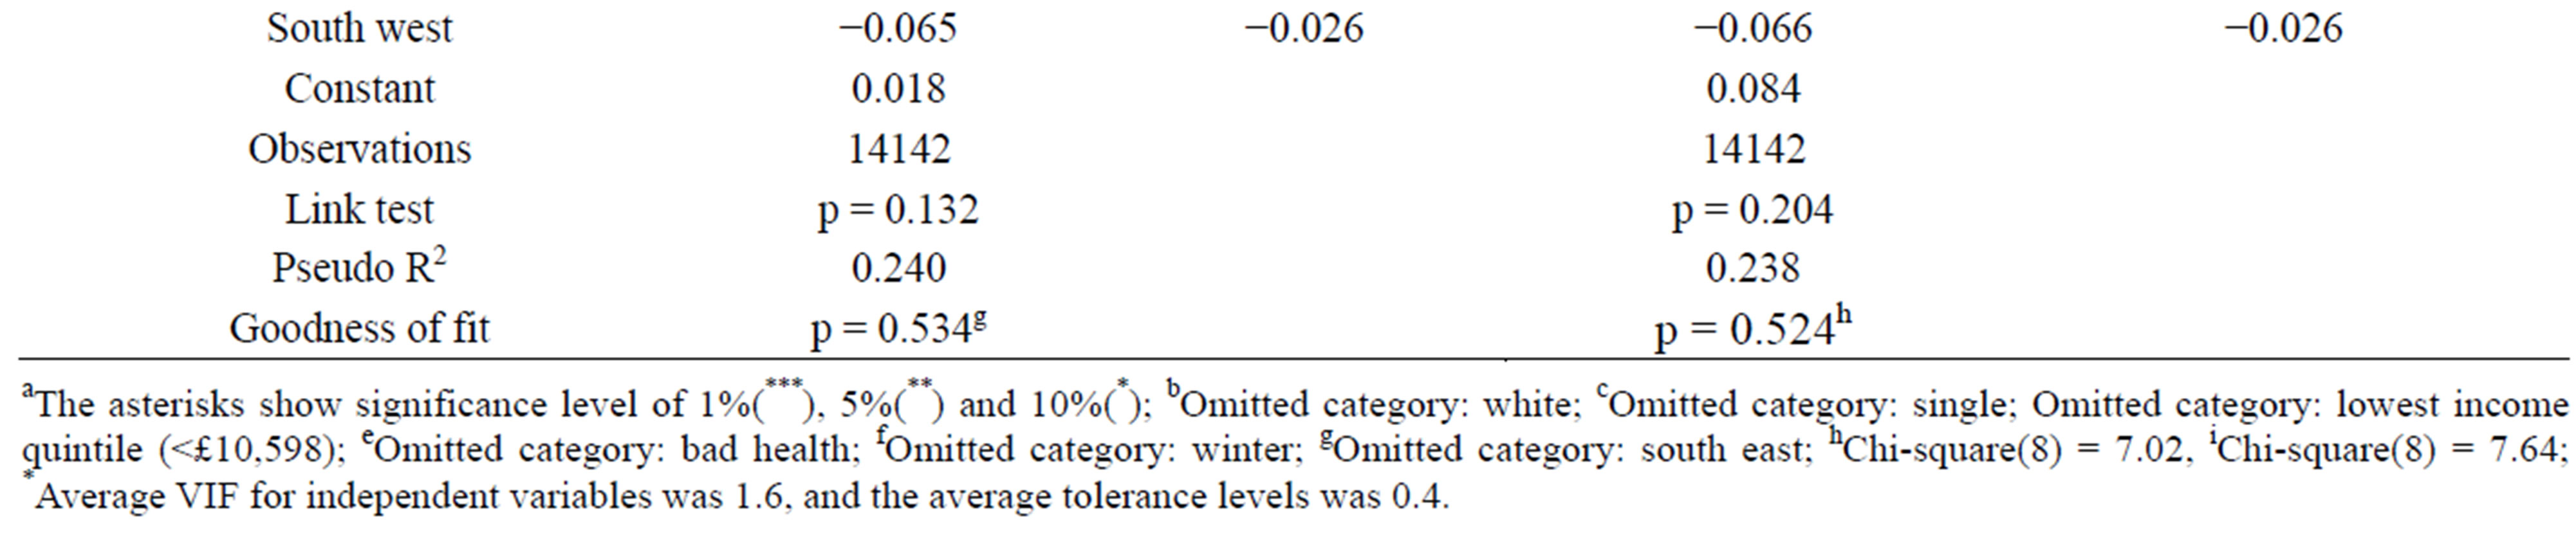
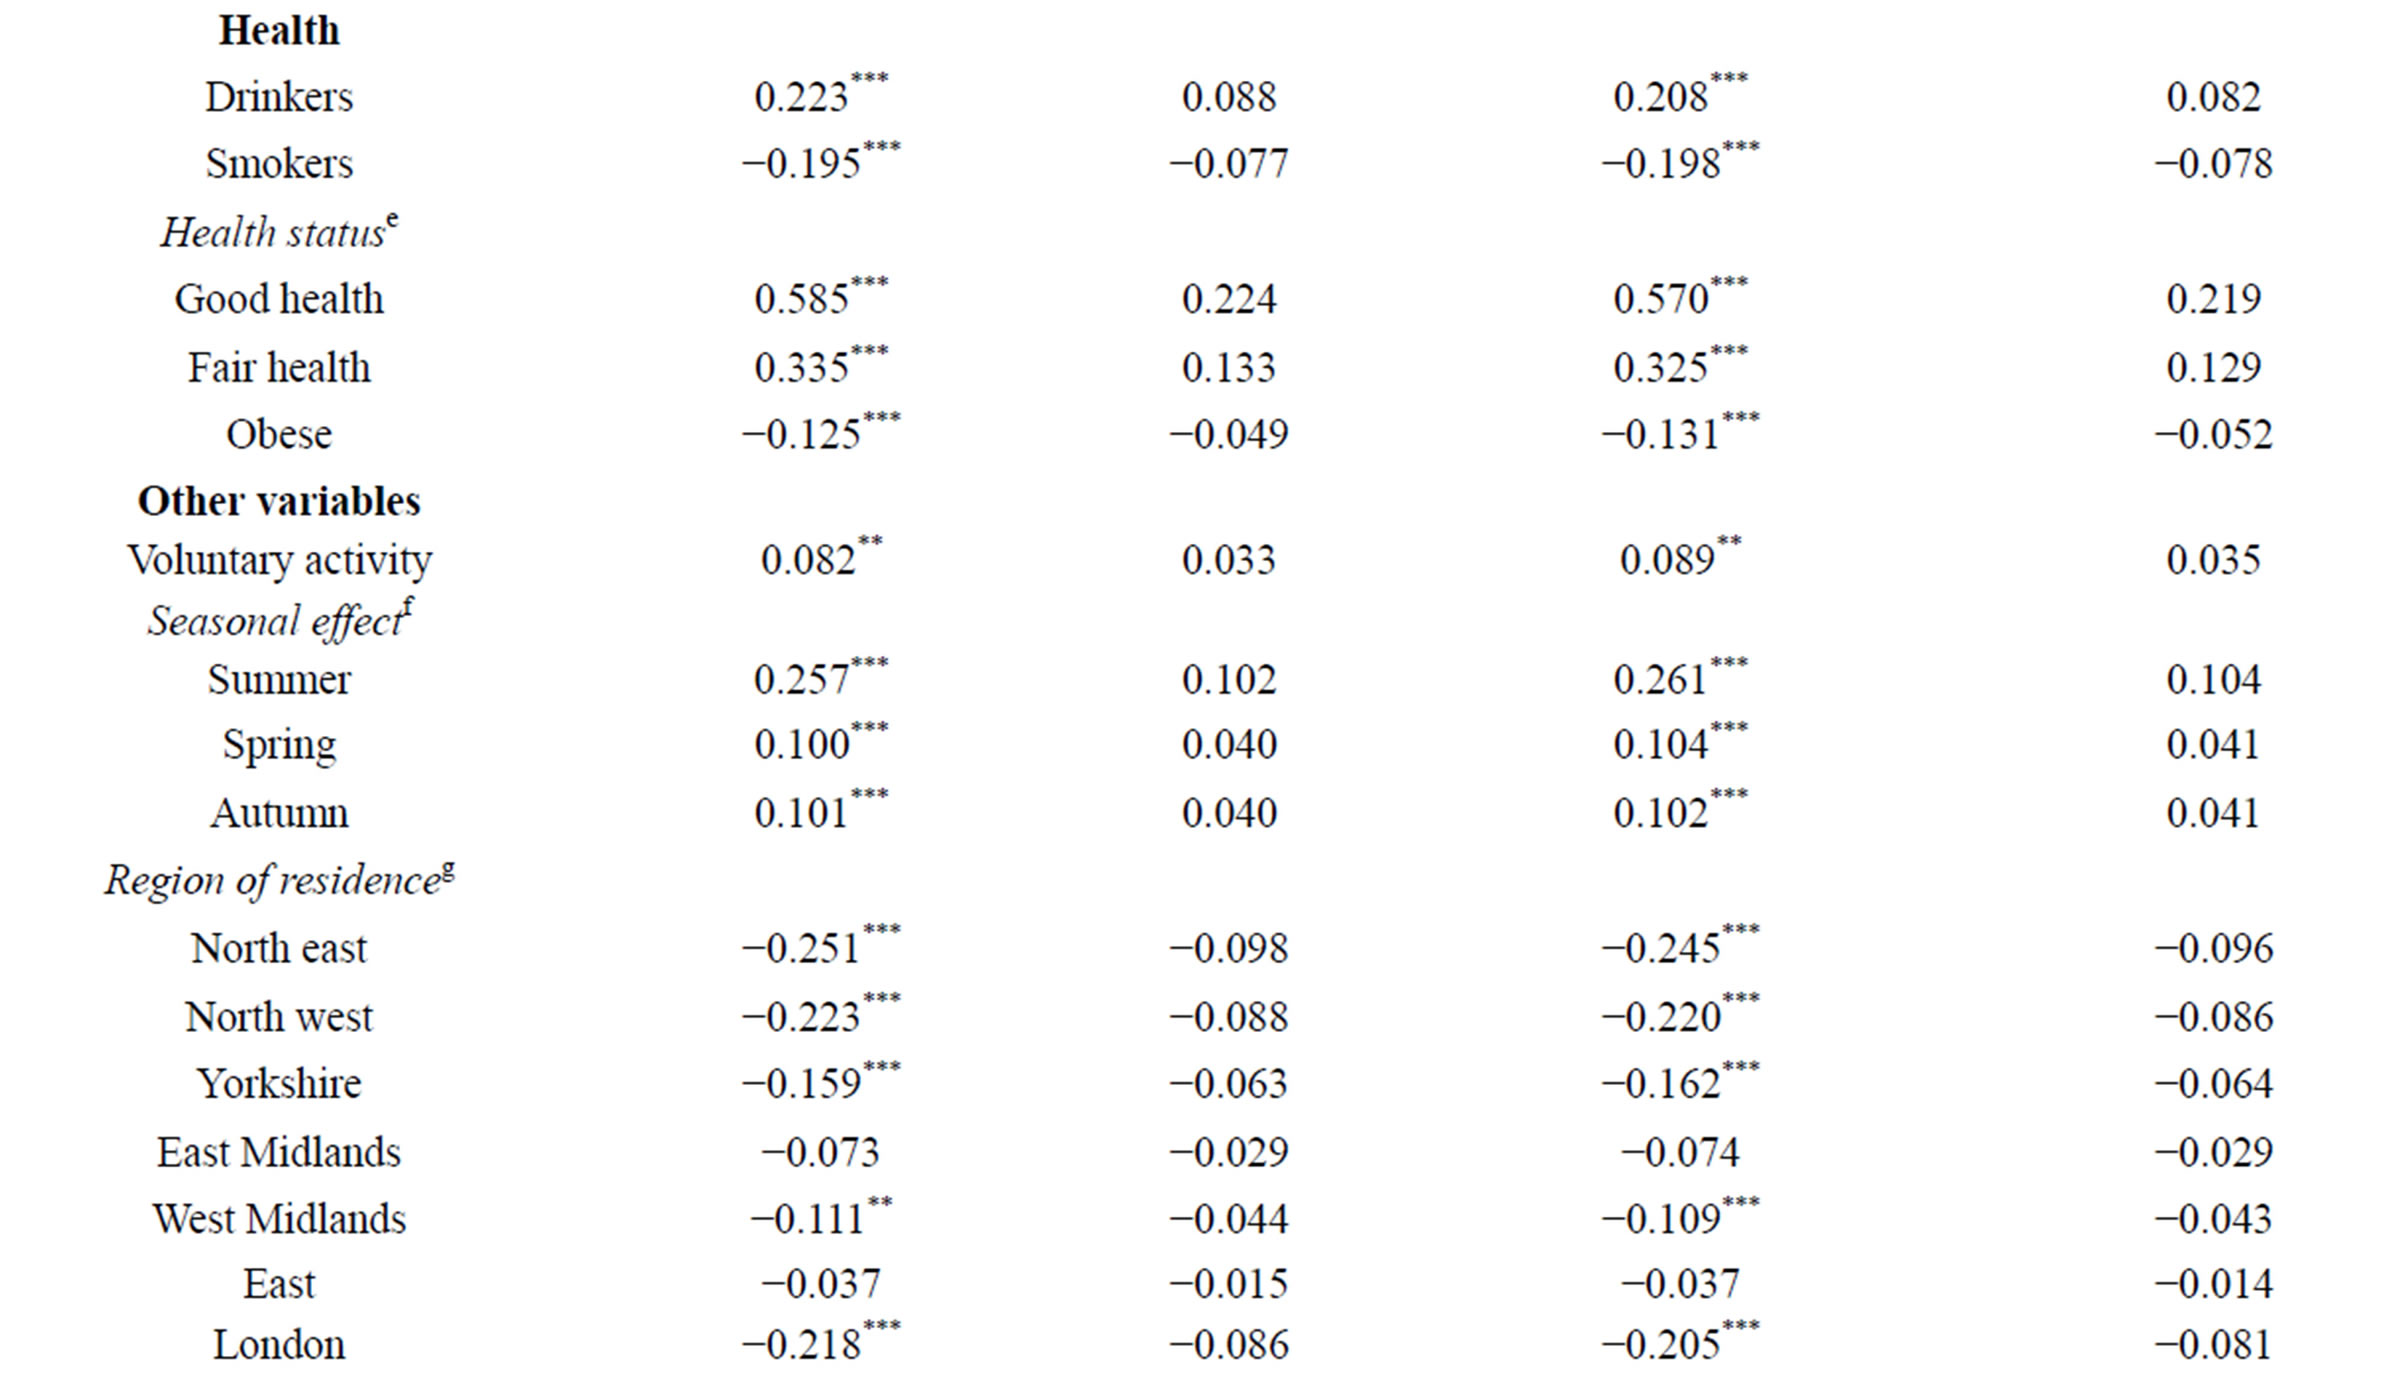
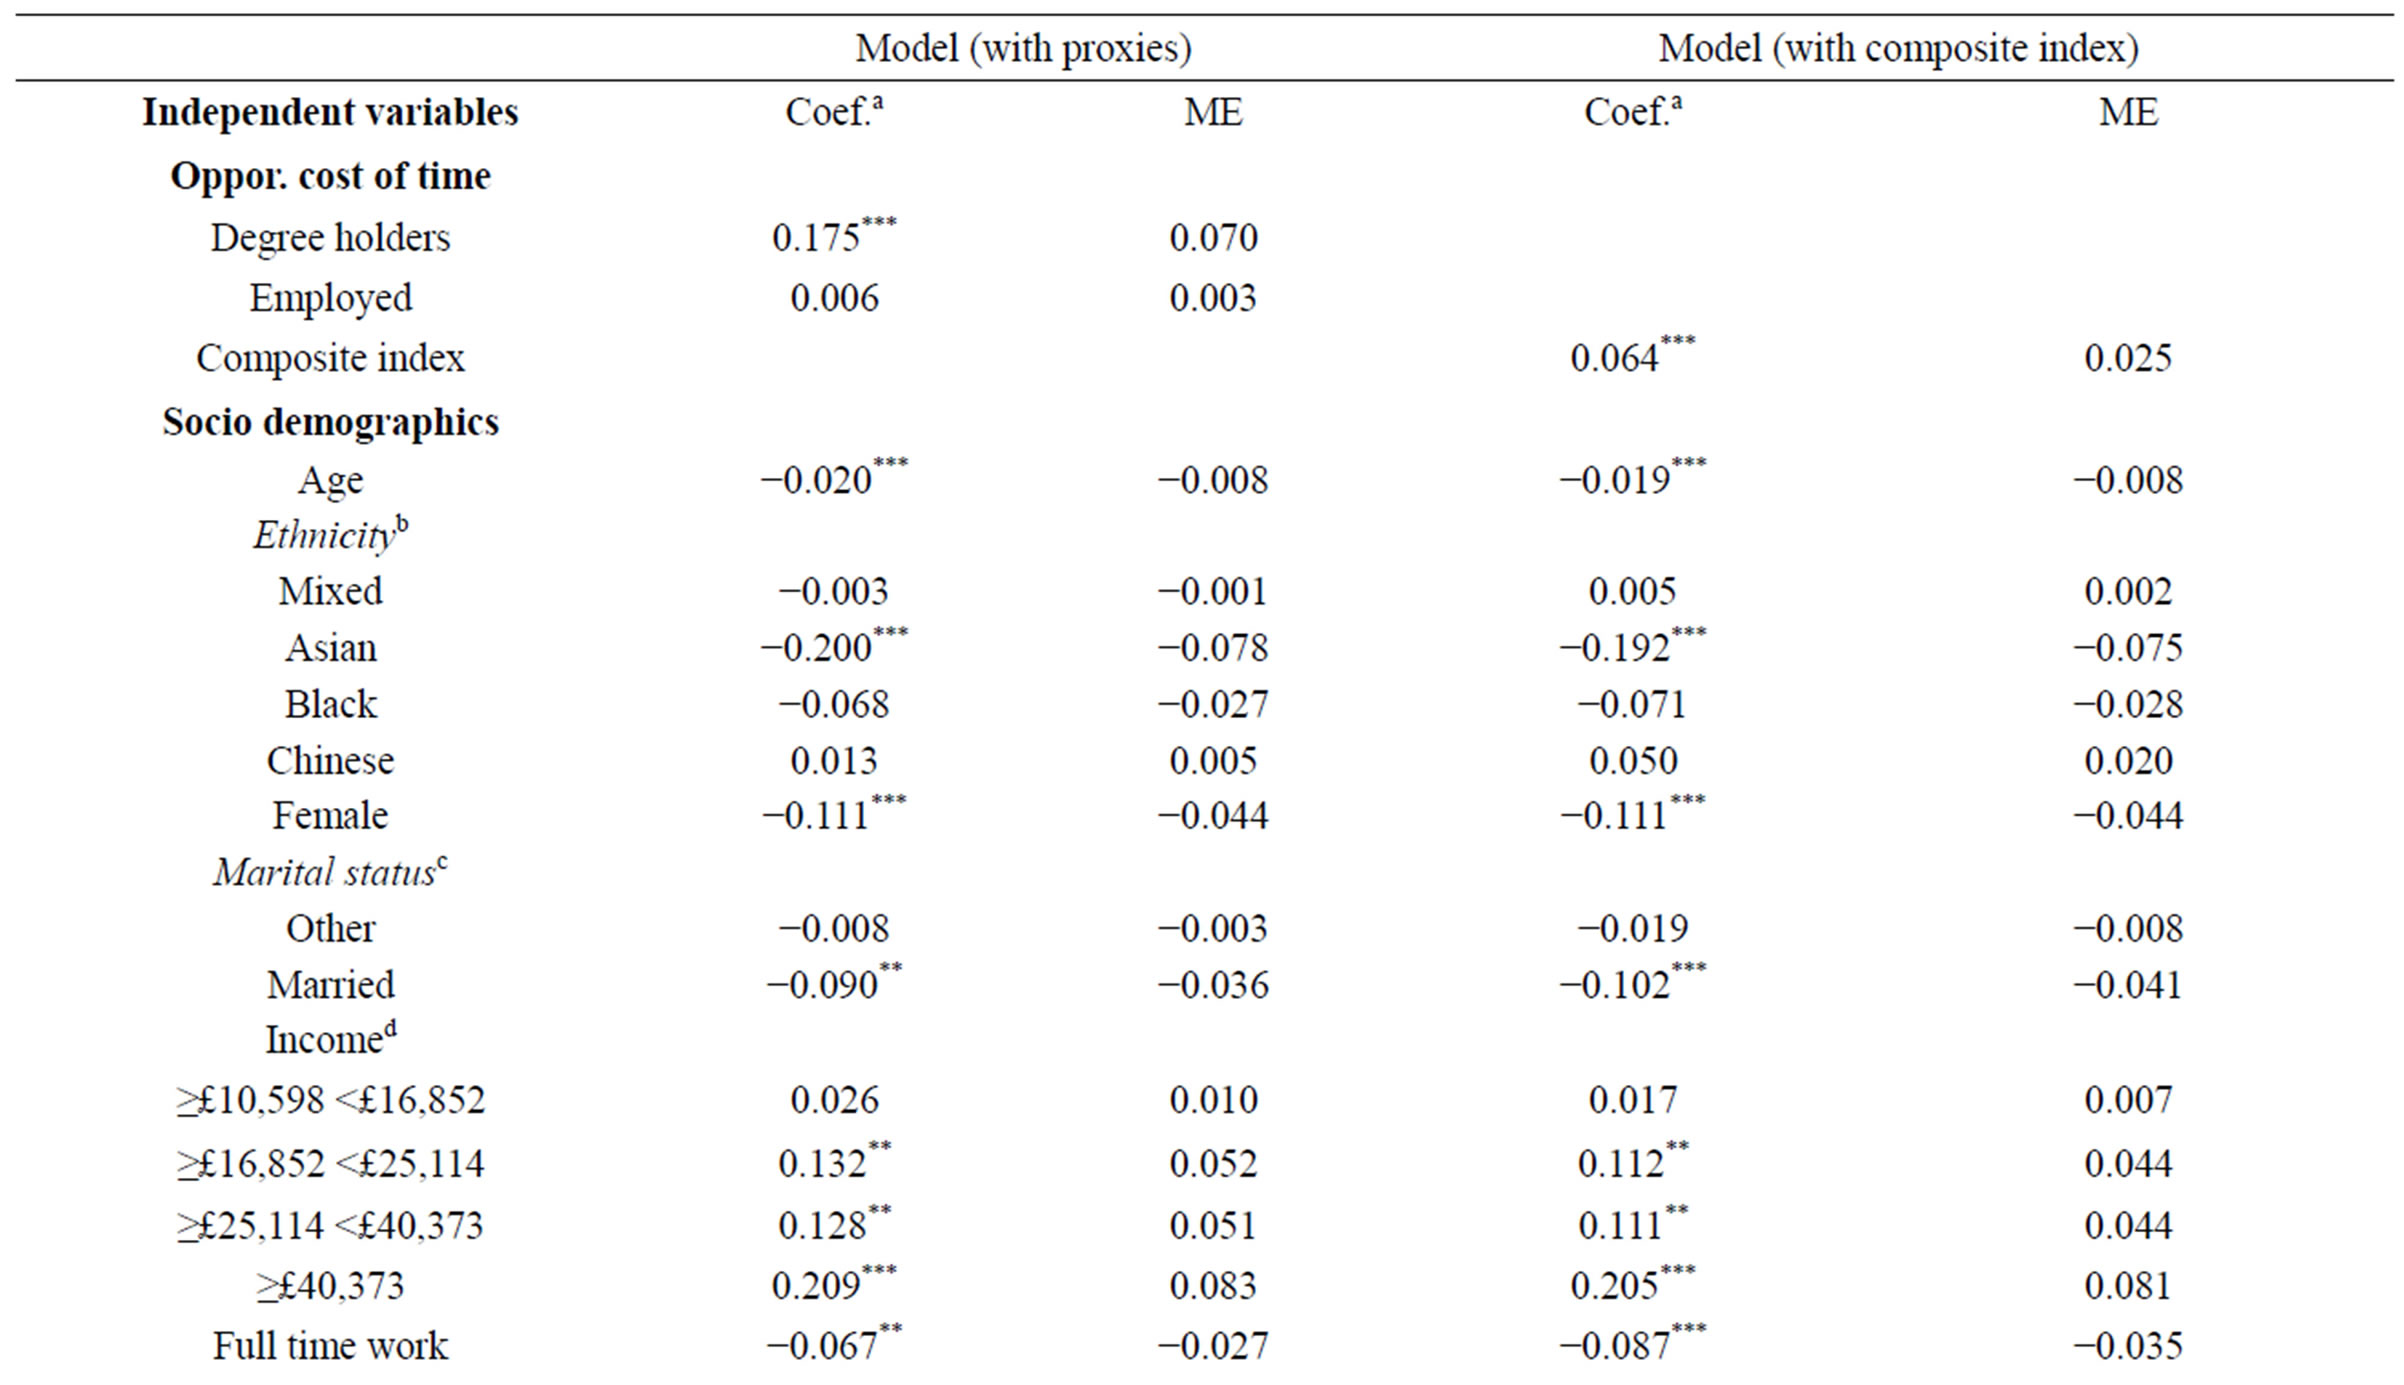
Table 3. Estimation results (reduced models) for participation in any sports and exercise activity.
aThe asterisks show significance level of 1%(***), 5%(**) and 10%(*); bOmitted category: white; cOmitted category: single; Omitted category: lowest income quintile (<£10,598); eOmitted category: bad health; fOmitted category: winter; gOmitted category: south east; hChi-square(8) = 7.02, iChi-square(8) = 7.64; *Average VIF for independent variables was 1.6, and the average tolerance levels was 0.4.

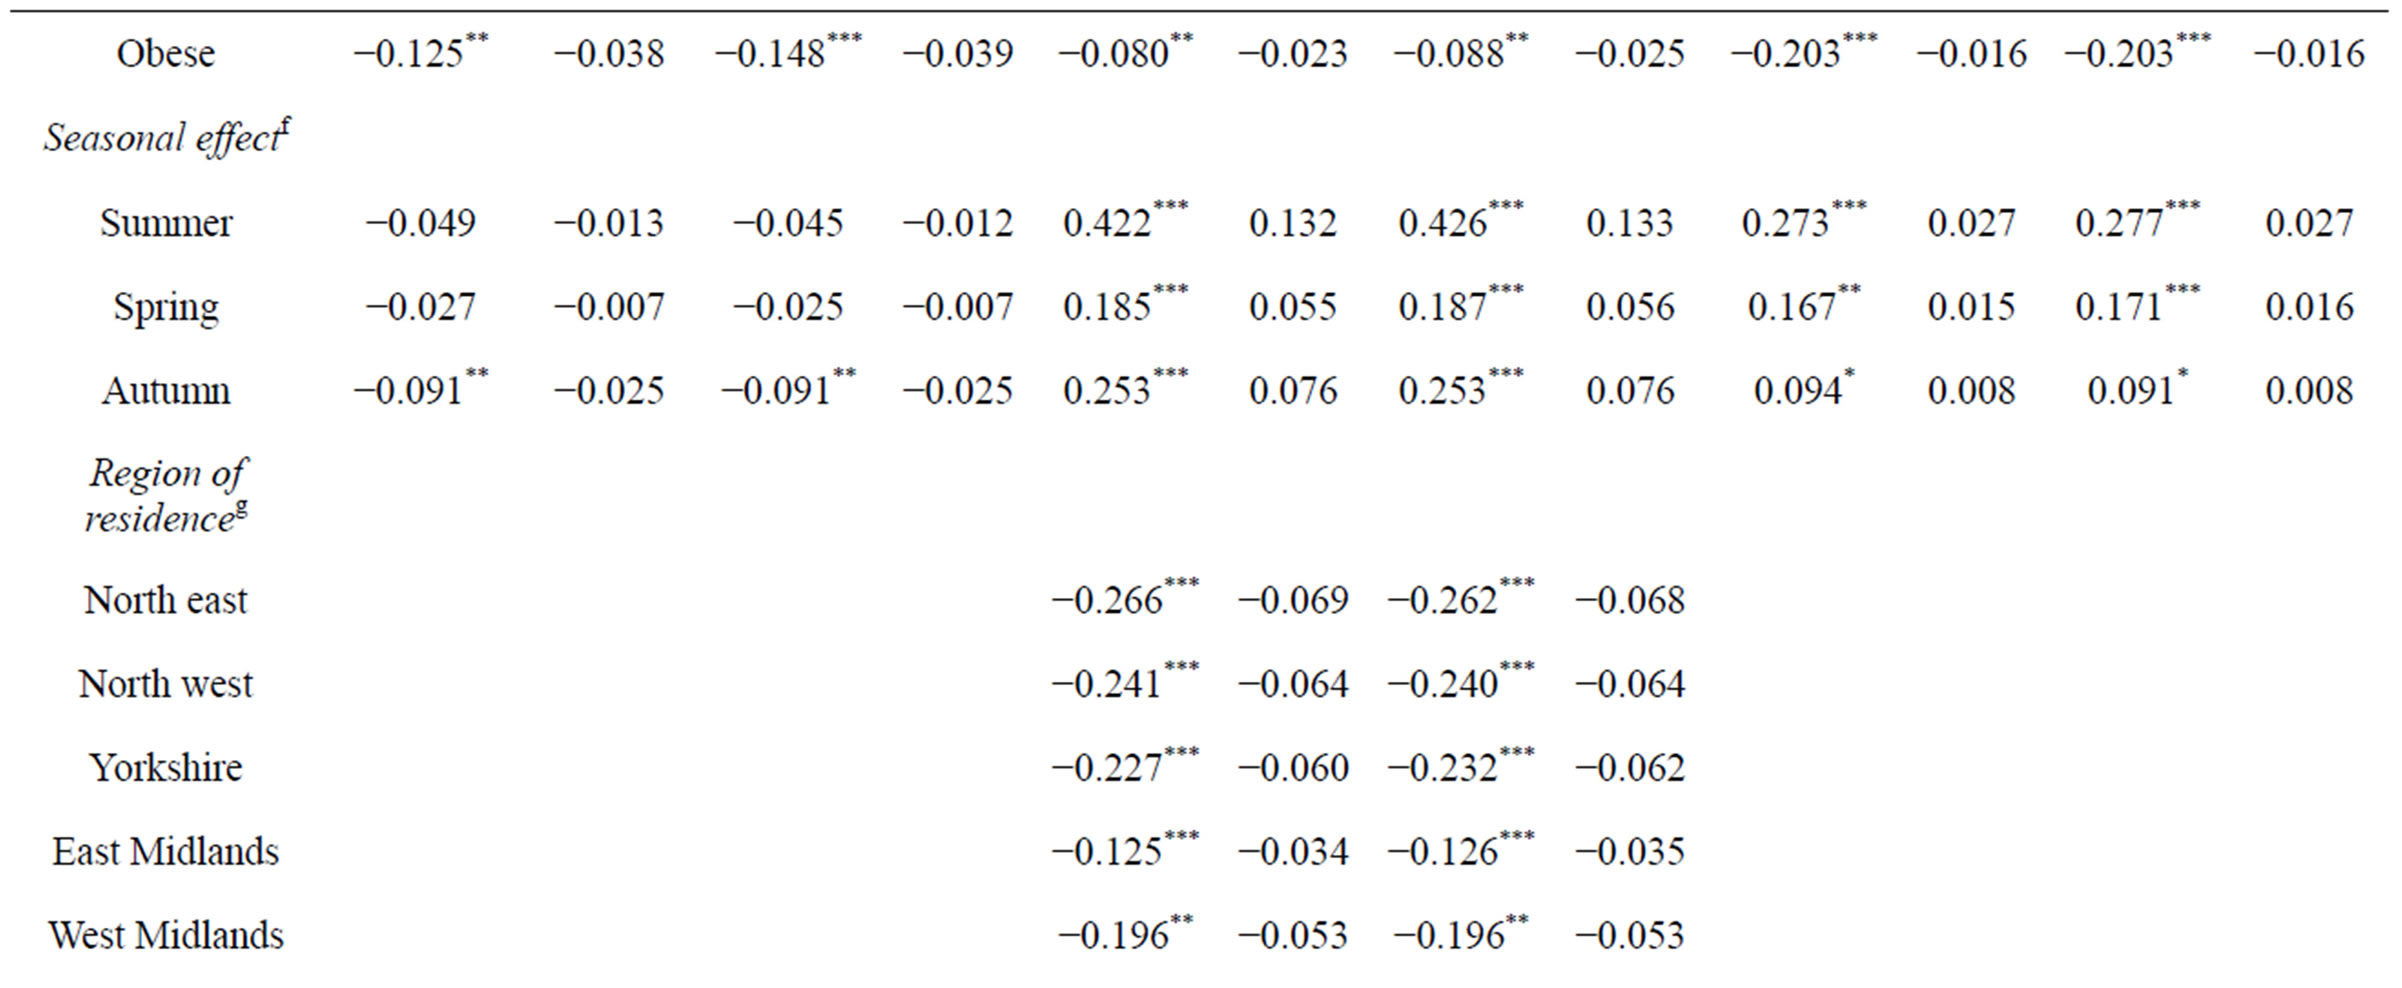
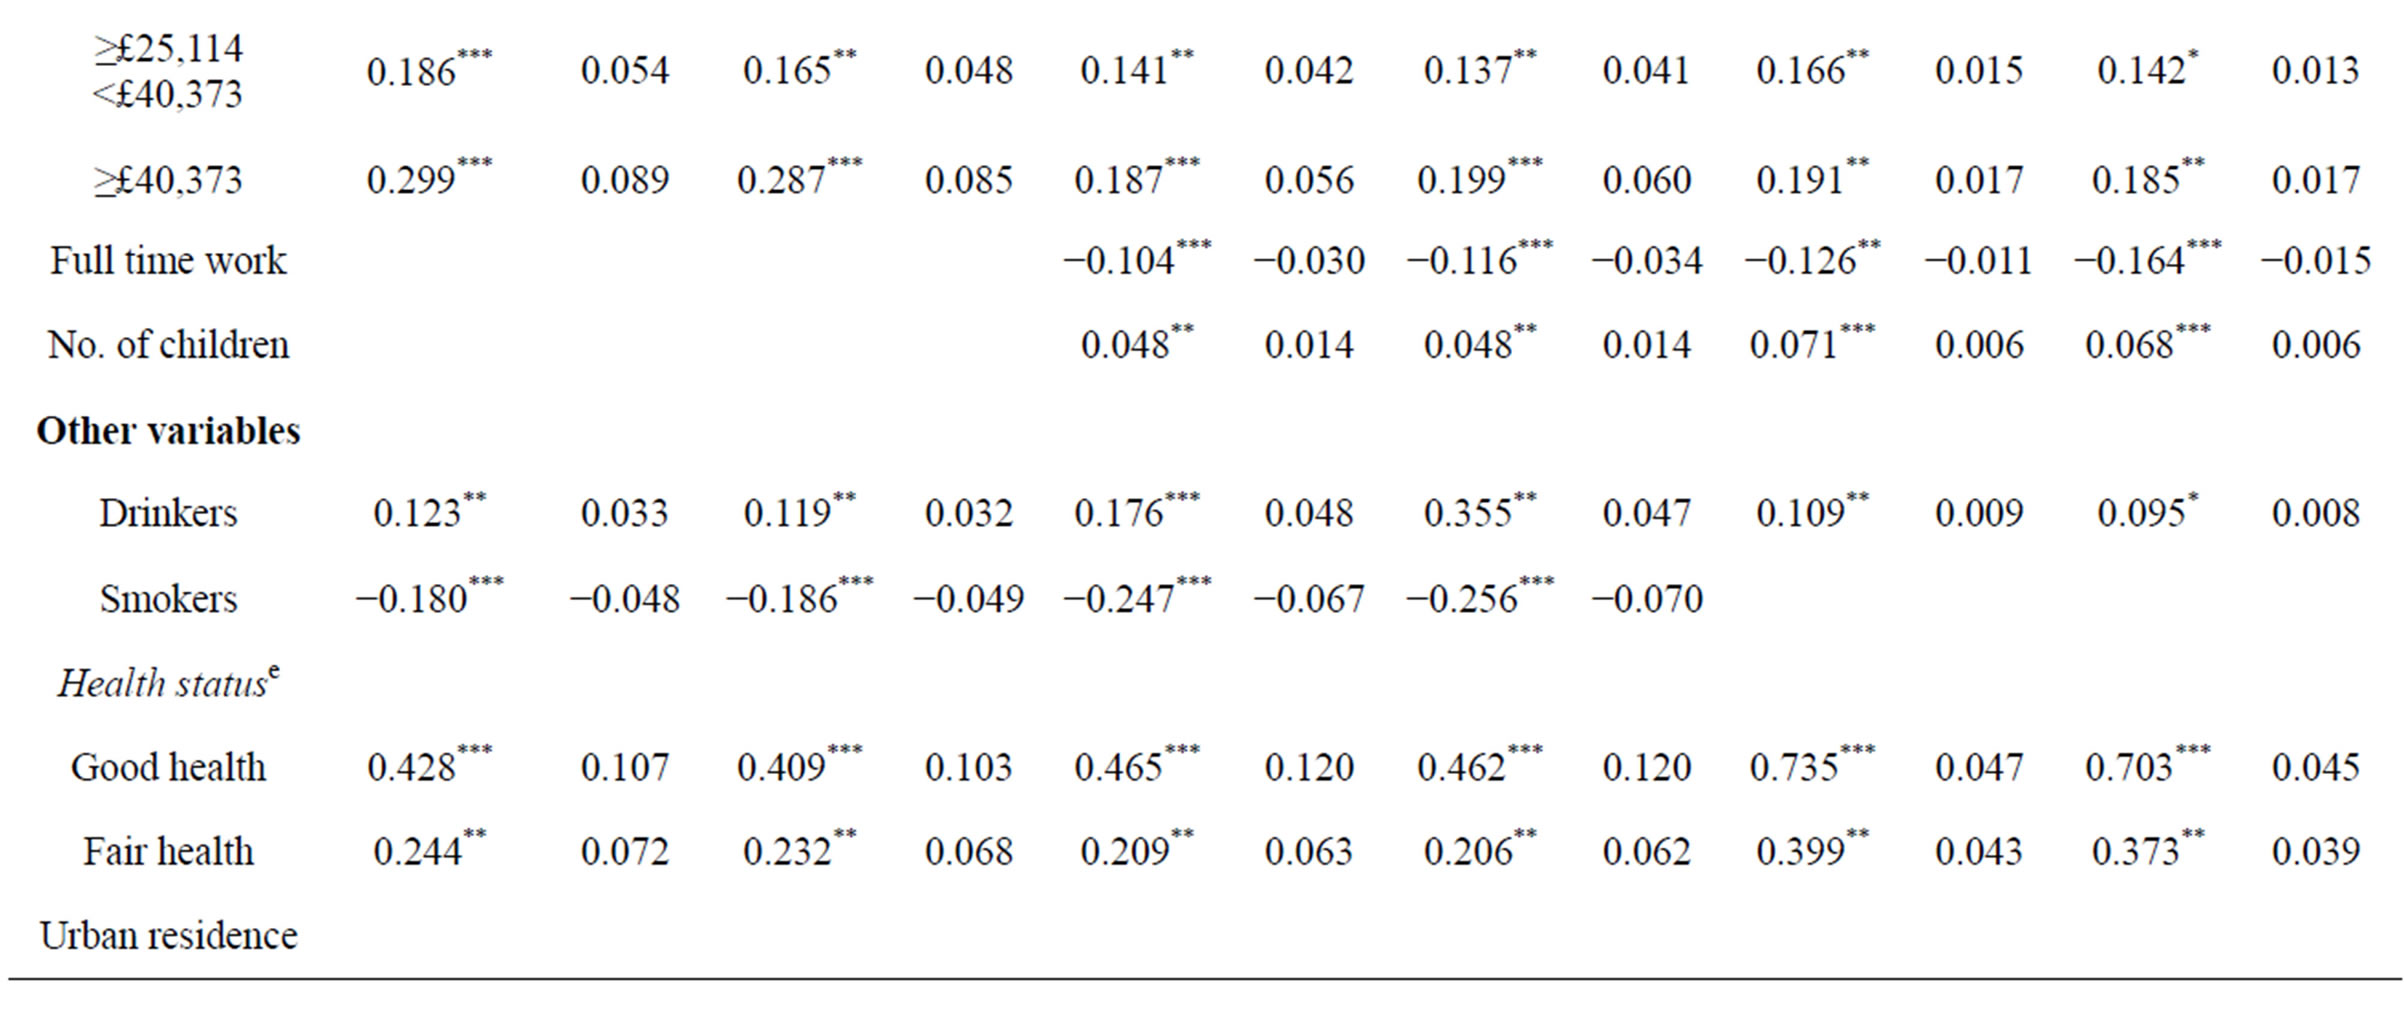
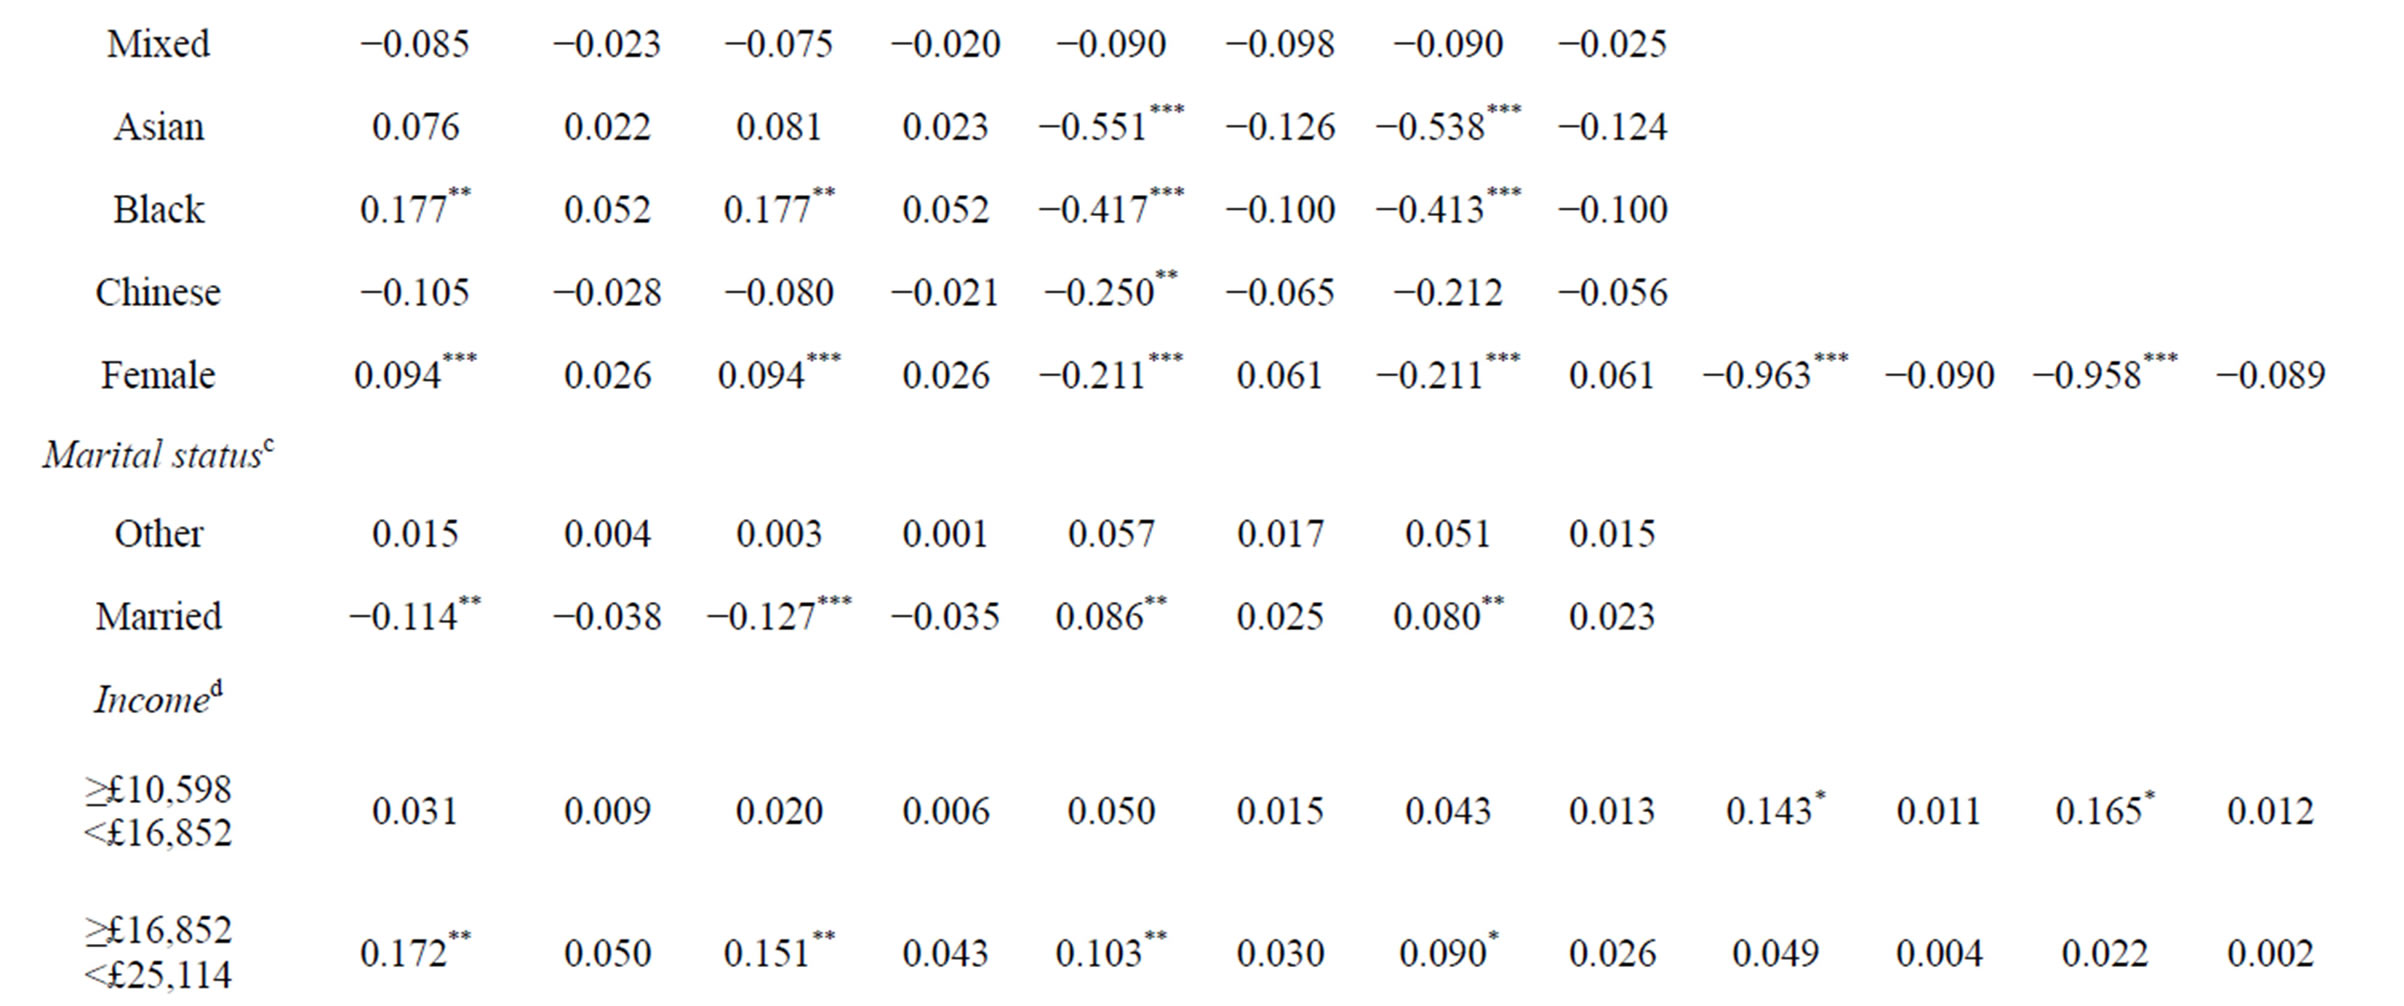
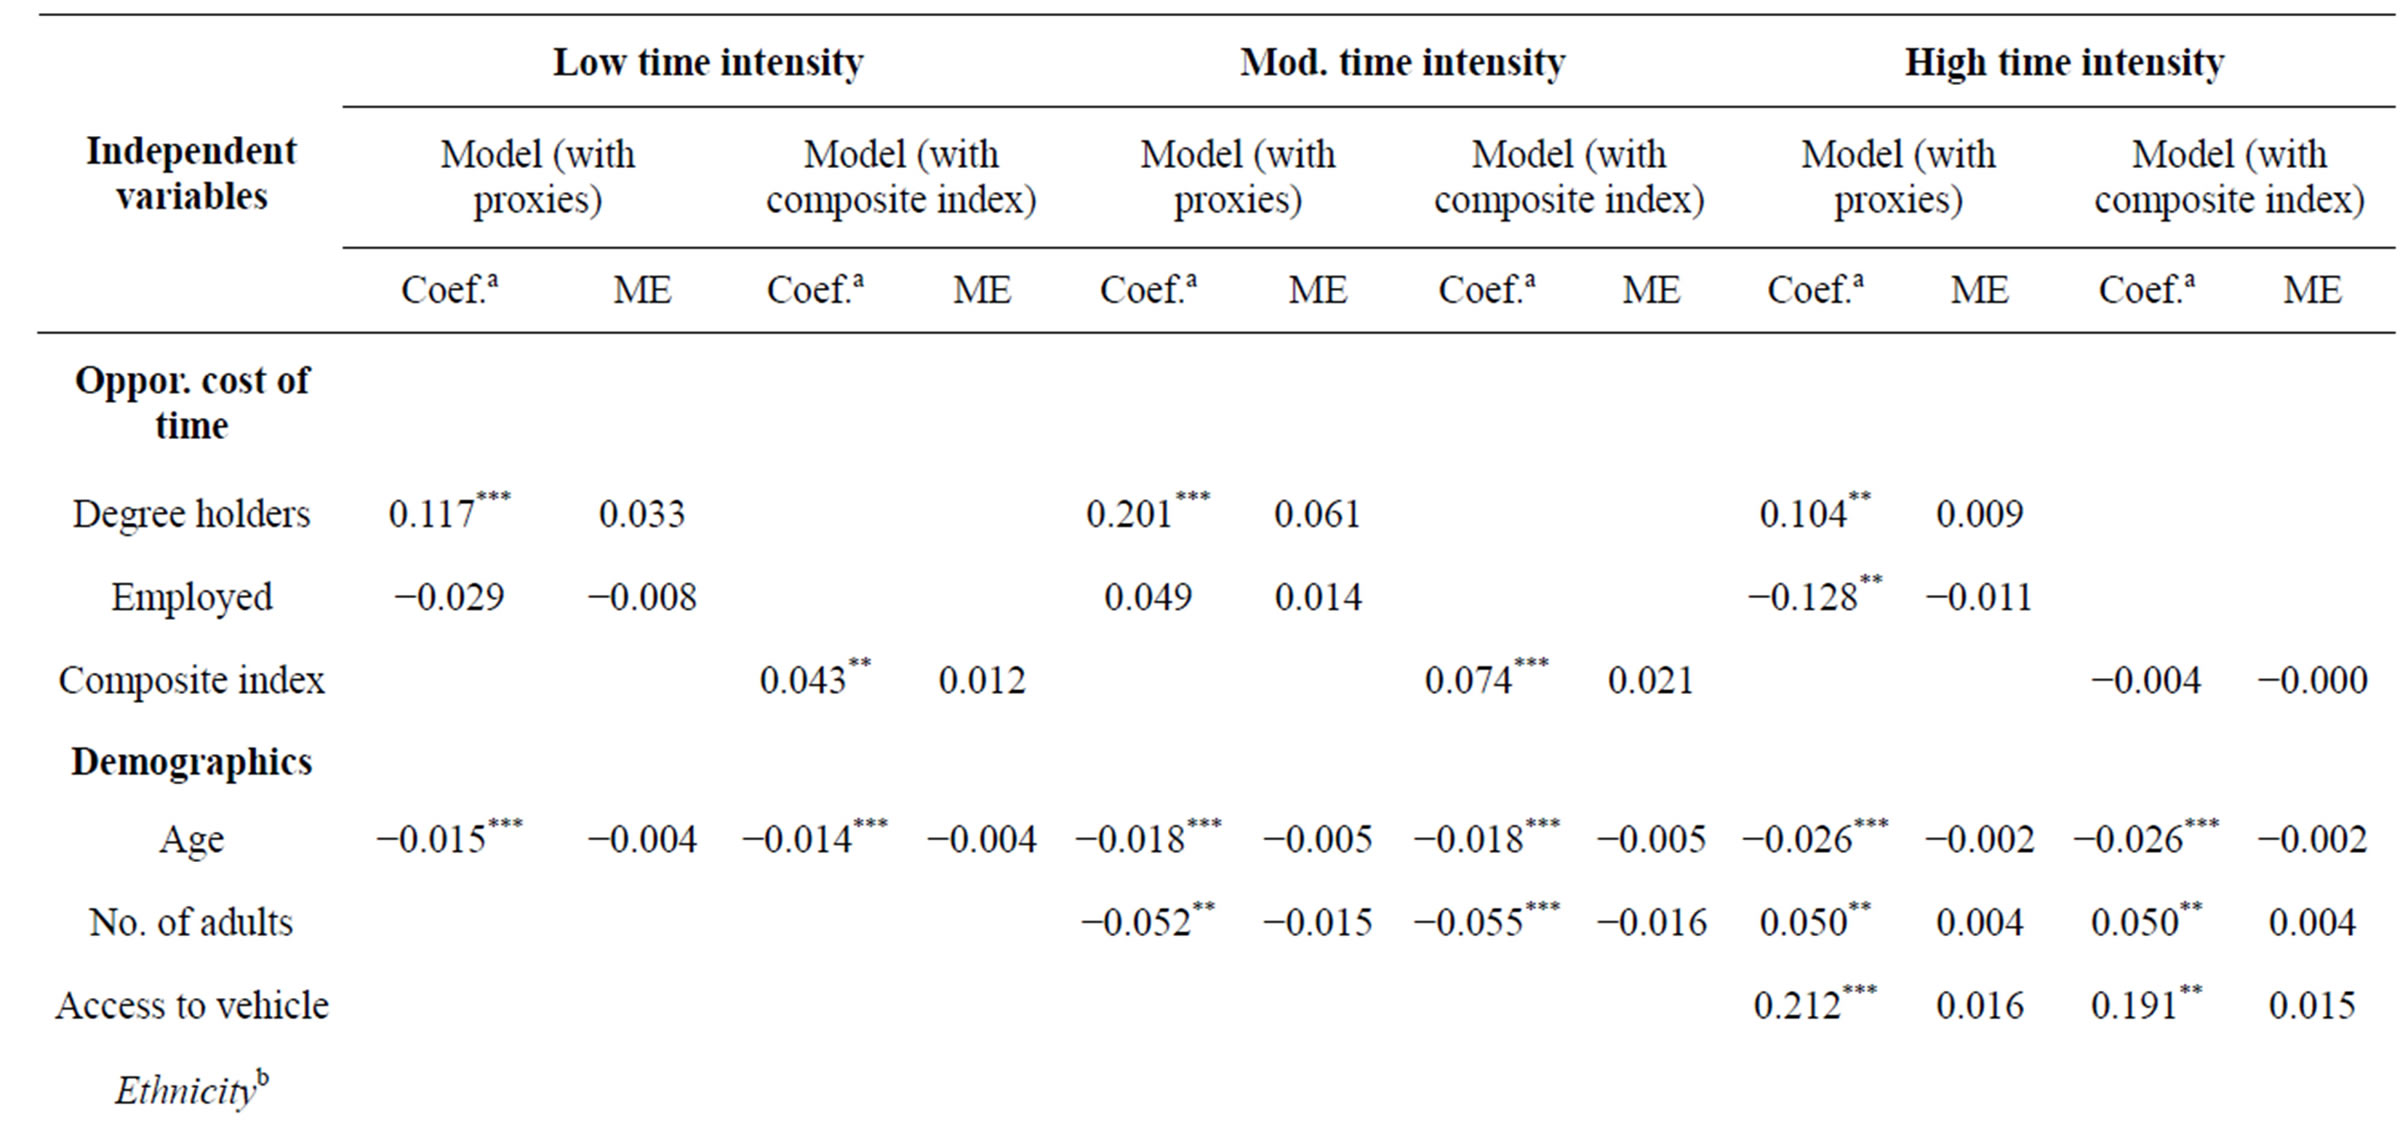
Table 4. Estimation results (reduced model) for participation in different types of sports and exercise activities.
aThe estimated parameters and asterisks show significance level of 1%(***), 5%(**) and 10%(*); bOmitted category: white; c Omitted category: single; dOmitted category: lowest income quintile (<£10,598); eOmitted category: bad health; fOmitted category: winter; gOmitted category: south east; hChi-square(8) = 7.37; iChi-square(8) = 6.07; jChi-square(8) = 6.62; kChi-square(8) = 5.36; lChi-square(8) = 8.13; mChi-square(8) = 7.42; *Average VIF for independent variables was 1.7, and the average tolerance levels was 0.3.
from Health Education Authority National Survey of Activity and Health (HEANSAH) 1991, showed that people with high opportunity cost of time (e.g. degree holders) have significantly (p < 0.001) greater perceived benefits from exercise and therefore be more likely to participate in exercise [7]. However, being potential indicators of economic status the proxies may have also captured opportunities for uptake such as increased access to exercise facilities. Although this may be true, its confounding effect may be minimal in this research context as Macintyre [47] observed that access to sports facilities in the UK is not determined by economic status.
It is worth considering why the correlation between sports and exercise, and number of socio-demographic factors differed across activity specific models. For example, having more adults in the household was negatively associated with moderate time intensity activity but positively correlated with high time intensity activity. High time intensity activities mainly comprised team sports and are therefore likely to be more attractive to households with more adults compared with moderate time intensity activities that were largely individual sports. Having several adults in the household might correspond to improved opportunities for joint participation in recreational activities [48].
The findings on opportunity cost of time could, however, be challenged because the proxy measures may not have been effective indicators of opportunity cost of time. Specifically, education may not indicate high earnings as increased supply of skilled labour due to increased access to higher education (not matched by demand for such labour) have led to graduates tending to occupy relatively low-skilled positions resulting in pay penalty of up to 33% [49]. Nonetheless, the positive relationship between earnings and education is well supported by empirical evidence that is consistent across countries [50,51]. Furthermore, a number of factors provide validity to both types of proxy measure of opportunity cost of time presented in this study. First, the findings on the association between opportunity cost of time and sports and exercise behaviour are congruent with that in the literature [2,13]. Second, in the case of the control variables, a priori expectations were all met in models containing either proxy measure. Third, the model diagnostics suggested all models had good specification and fit.
The question of which type of proxy measure is superior is more difficult to answer conclusively. It is difficult to discriminate between them as all models containing either measure showed good specification and fit and satisfied a priori expectation. However, the properties of the composite index could be argued to be superior due to a number of reasons. First, the high time intensity activity model with proxies showed education to be positively associated with participation while a negative correlation was suggested by employment. The use of the composite index, however, clarified the direction of the correlation, revealing it to be negative but insignificant, and thereby easing interpretation. Secondly, a better specification of opportunity cost of time could be argued because the composite index captures more relevant indicators of opportunity cost of time, as demonstrated by the high intercorrelation among those factors. Related to this, the model with composite index showed a better predication rate (though only very slight: 0.02%) than that of the proxies. On the other hand, if we consider other goodness-of-fit measures such as pseudo R2 as a criterion then the proxies appear to better. It is therefore reasonable to argue that the choice of superior proxy measure should be context driven. For example, if we are trying to get a univariate measure for opportunity cost of time, then the composite index may be the better measure.
There are a number of broad set of limitations relating to this study. First, specifying opportunity cost of time in terms of wage earnings warrants concern because the cost of time spent on leisure cannot be equated to the benefit foregone in labour time-wages since: 1) people may value leisure more than labour time and; 2) the leisure/labour trade-off breaks down in the context of fixed working hours, as substitution of labour time for leisure do not suffice [31,52]. Palmquist et al. [53] has also argued that time may not be indivisible and that it is impractical to treat it as blocks that can be easily traded off. These concerns have culminated in alternative approaches to measure the opportunity cost of time. Coffey [52], for example, used survey questionnaires to measure an unemployed individual’s value of leisure—reservation wage [52]. Other variants cover conducting a survey where respondents are asked directly for their opportunity cost of time [54] or their willingness to work additional hours, or/and their willingness to work or not [55]. However, the accuracy of these approaches has been questioned due to their sensitivity to self-reporting [56]. For example, Dawes [45] argues that the self reported wage rate of an individual who has been unemployed for a long time is likely to be based on subsistence demands rather than the wage that their labour market value. Hence wage earnings remain the standard indicator of opportunity cost of time in both the economics literature in general [8-12] and the demand for physical activity literature in particular [2,6,13,14,31]. Another limitation is that sports and exercise was measured via questionnaire (i.e. self reports). Despite appropriate validity and reliability tests, the use of self reports to measure sports and exercise may be fraught with overestimation [57]. However, alternative approaches such as the use of objective measurements like accelerometers were not attainable within the logistical constraints of this study. Thus the application of the findings in this study ought to be treated with caution.
The findings on opportunity cost of time here provide an implication for policies to improve sports and exercise participation in England. The dominance of the income effect over substitution effect suggests that the introduction of economic incentives could improve participation levels of sports and exercise. Alternatively, given the potential offsetting effect of perceived benefits on the relationship between opportunity cost of time and sports and exercise, a policy recommendation could be to increase awareness about benefits from exercise via, for example, GP advice schemes. Such interventions have been shown to be cost-effective [58,59]. Yet, as the proxies may not be good measures of opportunity cost of time further research is needed to provide robust evidence on the relationship between opportunity cost of time and sports and exercise and inform policy.
5. ACKNOWLEDGEMENTS
The Health Economics Research Group at Brunel University received funding from the Department of Health’s Policy Research Programme for this research. The views expressed in this publication are those of the authors and not necessarily those of the Department of Health. We thank Professor Martin Buxton, Professor Paul Trueman and members of the Health Economics Research Group for valuable inputs to earlier drafts of the manuscript.
REFERENCES
- Cawley, J. (2004) An economic framework for understanding physical activity and eating behaviours. American Journal of Preventive Medicine, 27, 117-125. doi:10.1016/j.amepre.2004.06.012
- Humphreys, B.R. and Ruseski, J.E. (2010) The economic choice of participation and time spent in physical activity and sport in Canada. Working Paper No. 2010-14.
- Department for Culture, Media and Sport/Strategy Unit (2002) Game plan: A strategy for delivering government’s sport and physical activity objectives. DCMS, London.
- National Health Service (2009) Statistics on obesity, physical activity and diet. NHS, London.
- Department of Health (2009) Annual report of the Chief Medical Officer 2010. Report No. 301493. DH, London.
- Brown, H. and Roberts, J. (2011) Exercising choice: The economic determinants of physical activity behaviour. Social Science and Medicine, 73, 383-390. doi:10.1016/j.socscimed.2011.06.001
- Anokye, N.K. (2010) An exploration of demand for physical activity. Brunel University, London.
- Cesario, F. and Knetsch, J.L. (1976) A recreation site demand and benefit estimation model. Regional Studies, 10, 97-104. doi:10.1080/09595237600185101
- Hellerstein, D. and Mendelsohn, R. (1993) A theoretical foundation for count data models. American Journal of Agricultural Economics, 75, 604-611. doi:10.2307/1243567
- Ekelund, R.B., Jr. and Ritenour, S. (1999) An exploration of the Beckerian theory of time costs: symphony concert demand. American Journal of Economics Sociology, 58, 887-899.
- Parsons, G.R. (2003) The travel cost method. In: Champ, P.A., Boyle, K.J. and Brown, T.C., Eds., A Primer on Nonmarket Valuation, Kluwer Academic Publishing, London, 269-329. doi:10.1007/978-94-007-0826-6_9
- Hagerty, D. and Moeltner, K. (2005) Specification of driving costs in models of recreation demand. Land Economics, 81, 127-143.
- Humphreys, B.R. and Ruseski, J.E. (2006) Economic determinants of participation in physical activity and sport. IASE Working Paper No. 06-13.
- Humphreys, B.R. and Ruseski, J.E. (2007) Participation in physical activity and government spending on parks and recreation. Contemporary Economic Policy, 25, 538- 552.
- Gratton, C. and Taylor, P. (2000) Economics of sport and recreation. 2nd Edition, Spon Press, London.
- National Obesity Observatory (2009) Physical activity surveillance in England: What is measured and where are the gaps? NHS, London.
- Mincer, J.A. (1974) Schooling, experience and earnings. National Bureau of Economics Research.
- Montgomery, M.R., Gragnolati, K., Burke, A. and Paredes, E. (2000) Measuring living standards with proxy variables. Demography, 37, 155-174. doi:10.2307/2648118
- Filmer, D. and Pritchett, L.H. (2001) Estimating wealth effects without expenditure data or tears: An application to educational enrolments in states of India. Demography, 38, 115-132.
- Farrell, L. and Shields, M.A. (2002) Investigating the economic and demographic determinants of sporting participation in England. Journal of the Royal Statistical Society: Series A (Statistics in Society), 165, 335-348. doi:10.1111/1467-985X.00626
- Kolenikov, S. and Angeles, G. (2004) The use of discrete data in PCA: Theory, simulations, and applications to socioeconomic indices.
- Giri, N.C. (2004) Multivariate statistical analysis. Marcel Dekker Inc., New York.
- Moser, C. and Felton, A. (2007) The construction of an asset index measuring asset accumulation in Ecuador. CPRC Working Paper 87.
- O’Donnell, O., van Doorslaer, E., Wagstaff, A. and Lindelow, M. (2008) Analyzing health equity using household survey data: A guide to techniques and their implementation. WBI Learning Resources Series, World Bank, Washington, D.C.
- Lindelow, M. (2006) Sometimes more equal than others: How health inequalities depend on the choice of welfare indicator. Health Economics, 15, 263-279.
- Schellenberg, J.A., Victora, C.G., Mushi, A., de Savigny, D., Schellenberg, D., Mshinda, H., et al. (2003) Inequities among the very poor: Health care for children in rural southern Tanzania. Lancet, 361, 561-566.
- Gwatkin, D.R., Rustein, S., Johnson, K., Rani, M. and Wagstaff, A. (2000) Socio-economic differences in health, nutrition, and population in Yemen. HNP/Poverty Thematic Group of The World Bank, Washington, D.C.
- Filmer, D. and Pritchett, L. (1999) The effect of household wealth on educational attainment: Evidence from 35 Countries. Population and Development Review, 25, 85- 120.
- McKenzie, D.J. (2003) Measure inequality with asset indicators. BREAD Working Paper No. 042, Harvard University, Cambridge.
- Vyas, S. and Kumaranayake, L. (2006) Constructing socioeconomic status indices: How to use principal components analysis. Health Policy Planning, 21, 459-468. doi:10.1093/heapol/czl029
- Taks, M., Renson, R. and Vanreusel, B. (1994) Of sport, time and money: An economic approach to sport participation. International Review for the Sociology of Sport, 29, 381-395.
- Briggs, A., Clark, T., Wolstenholme, J. and Clarke, P. (2003) Missing... presumed at random: Cost-analysis of incomplete data. Health Economics, 12, 377-392. doi:10.1002/hec.766
- Morris, S., Sutton, M. and Gravelle, H. (2005) Inequity and inequality in the use of health care in England: An empirical investigation. Social Science and Medicine, 60, 1251-1266. doi:10.1016/j.socscimed.2004.07.016
- Craig, R., Mindell, J. and Hirani, V. (2009) Health Survey for England 2008. Volume 1: Physical activity and fitness. The Health and Social Care Information Centre. NHS, London.
- Rabe-Hesketh, S. and Everittt, B. (2004) A handbook of statistical analyses using Stata. 3rd Edition, CRC Press LLC, Florida.
- Sahn, D. and Stifel, D. (2003) Exploring alternative measures of welfare in the absence of expenditure data. Review of Income and Wealth, 49, 463-489. doi:10.1111/j.0034-6586.2003.00100.x
- Maxwell, N.L. (2008) Wage differentials, skills, and institutions in low-skill jobs. Industrial and Labour Relations Review, 61, 394-409.
- Verner, D. (2005) Wage determination in Northeast Brazil. Policy Research Working Paper Series 3548, The World Bank.
- Lee, B. and Lee, M.J. (2006) Quantile regression analysis of wage determinants. Journal of the Korean Economy, 7, 1-31.
- Contoyannis, P. and Rice, N. (2001) The impact of health on wages: Evidence from the British household panel survey. Empirical Economics, 26, 599-622. doi:10.1007/s001810000073
- Heyman, F. (2007) Firm size or firm age? The effect on wages using matched employer-employee data. Labour, 21, 237-263. doi:10.1111/j.1467-9914.2007.00377.x
- Dickey, H. (2007) Regional earnings inequality in Great Britain: Evidence from quantile regressions. Journal of Regional Science, 47, 775-806. doi:10.1111/j.1467-9787.2007.00528.x
- Co, C.Y., Gang, I.N. and Yun, M. (2005) Self-employment and wage earnings in Hungary. Review of Development Economics, 9, 150-165. doi:10.1111/j.1467-9361.2005.00269.x
- Barros, C.P. and Alves, F.M.P. (2003) Human capital theory and social capital theory on sports management. IAER, 9, 218-226.
- Dawes, L. (1993) Long-term unemployment and labour market flexibility. Centre for Labour Market Studies, University of Leicester, Leicester.
- Azevedo, J.P. (2006) FACTORTEST: Stata module to perform tests for appropriateness of factor analysis. S436001. Boston College Department of Economics, Chestnut Hill.
- Macintyre, S., Macdonald, L. and Ellaway, A. (2008) Do poorer people have poorer access to local resources and facilities? The distribution of local resources by area deprivation in Glasgow, Scotland. Social Science and Medicine, 67, 900-914. doi:10.1016/j.socscimed.2008.05.029
- Bhat, C.R. (2005) A multiple discrete-continuous extreme value model: Formulation and application to discretionary time-use decisions. Transportation Research Part B: Methodological, 39, 679-707. doi:10.1016/j.trb.2004.08.003
- Chevalier, A. (2000) Graduate over-education in the UK. Centre for the Economics of Education, London School of Economics and Political Science.
- Brunello, G. and Comi, S. (2004) Education and earnings growth: Evidence from 11 European countries. Economics of Education Review, 23, 75-83. doi:10.1016/S0272-7757(03)00048-7
- Walker, I. and Zhu, Y. (2003) Education, earnings and productivity. Labour Market Trends, 111, 145-152.
- Coffey, R.M. (1983) The effect of time price on the demand for medical-care services. Journal Human Resources, 18, 407-424. doi:10.2307/145209
- Palmquist, K.B., Phaneuf, D.J. and Smith, V.K. (2009) Short run constraints and the increasing marginal value of time in recreation. National Bureau of Economics Research Working Paper 14986.
- Casey, J.F. and Vukina, L.E.D.T. (1995) The economic value of hiking: Further considerations of opportunity cost of time in recreational demand models. Journal of Agricultural and Applied Economics, 27, 658-668.
- Feather, P. and Shaw, W.D. (1999) Estimating the cost of leisure time for recreation demand models. Journal of Environmental Economics and Management, 38, 46-65. doi:10.1006/jeem.1999.1076
- Mohanty, M.S. (2005) An alternative method of estimating the worker’s reservation wage. International Economic Journal, 19, 501-522.
- Gillison, F.B., Standage, M. and Skevington, S.M. (2006) Relationships among adolescents’ weight perceptions, exercise goals, exercise motivation, quality of life and leisure-time exercise behaviour: A self-determination theory approach. Health Education Research, 21, 836-847. doi:10.1093/her/cyl139
- National Institute for Health and Clinical Excellence (2006) Modelling the cost effectiveness of physical activity interventions. NICE, London.
- National Institute for Health and Clinical Excellence (2006) Rapid review of the economic evidence of physical activity interventions. NICE, London.
- Mullineaux, D.R., Barnes, C.A. and Barnes, E.F. (2001) Factors affecting the likelihood to engage in adequate physical activity to promote health. Journal of Sports Science, 19, 279-288. doi:10.1080/026404101750158376
- Wu, B. and Porell, F. (2000) Job characteristics and leisure physical activity. Journal of Aging and Health, 12, 538-559. doi:10.1177/089826430001200405
- Zunft, H.J., Friebe, D., Seppelt, B., Widhalm, K., Remaut de Winter, A.M., Vaz de Almeida, M.D., et al. (1999) Perceived benefits and barriers to physical activity in a nationally representative sample in the European Union. Public Health Nutrition, 2, 153-160. doi:10.1017/S1368980099000208
- Payne, N., Jones, F. and Harris, P. (2002) The impact of working life on health behaviour: The effect of job strain on the cognitive predictors of exercise. Journal of Occupational Health Psychology, 7, 342-353.
- [65] Downward, P. (2004) On leisure demand: A post-Keynesian critique of neoclassical theory. Journal of Post Keynesian Economics, 26, 371-394.
- Downward, P. (2007) Exploring the economic choice to participate in sport: Results from the 2002 general household survey. International Review of Applied Economics, 21, 633-653.
- Lera-López, F. and Rapún-Gárate, M. (2005) Sports participation versus consumer expenditure on sport: Different determinants and strategies in sports management. European Sport Management Quarterly, 5, 167-186.
- Lera-López, F. and Rapún-Gárate, M. (2007) The demand for sport: Sport consumption and participation models. Journal of Sport Management, 21, 103-122.
APPENDIX. GROUPS OF DIFFERENT SPORTS ACTIVITIES
NOTES
*All authors declare that they have no competing interests.