Open Journal of Physical Chemistry
Vol. 2 No. 4 (2012) , Article ID: 24743 , 9 pages DOI:10.4236/ojpc.2012.24029
Steady-State and Time-Resolved Fluorescence Studies of Anthrylacrylic Ester
1Department of Studies in Physics, Karnatak University, Dharwad, India
2Organic Division II, Indian Institute of Chemical Technology, Hyderabad, India
3Radiation and Photochemistry Division, Bhabha Atomic Research Centre (BARC), Mumbai, India
Email: *naik_36@rediffmail.com
Received July 26, 2012; revised August 25, 2012; accepted September 27, 2012
Keywords: Solvent Effect; Concentration Effect; Isomers
ABSTRACT
The photophysical properties of Anthrylacrylic ester were investigated in various solvents using steady-state and timeresolved fluorescence techniques. The dual fluorescence was observed in various solvents of different polarity functions. The emission bands observed are around 400 nm (band I) and 480 nm (band II) for 350 nm and 390 nm excitation at low concentrations (10–5 mol·dm–3) but at higher concentrations (10–3 mol·dm–3) only the emission (band II) at 480 nm alone was observed. The emission band observed around 400 nm shifts from 390 nm to 420 nm (shift 30 nm) when the excitation wavelength was varied from 300 nm to 380 nm and the emission band at 480 nm shifts from 430 nm to 510 nm (shift 80 nm) for the change of excitation wavelength from 380 nm to 400 nm. However, both emissions were observed for 380 nm excitation at lower concentrations. Solvatochromic shifts of electronic absorption and fluorescence emissions (band I & II) as a function of polarity functions were analyzed and the changes in dipole moment of the molecule was estimated (Δμ = 3.36 D & 5.98 D). Fluorescence decays monitored over each emission maxima showed bi-exponential behavior, and yielded two lifetime components respectively in the range 0.97 - 7.1 ns (at λem = 400 nm) and 0.34 - 7.23 ns (at λem = 480 nm). Based on the steady-state and time-resolved emission measurements emission band I (400 nm) and emission band II (480 nm) are respectively assigned as due to locally excited state (Trans-forms) and due to isomers (Cis-form).
1. Introduction
Photophysical processes involved in the excited state, Intra/Inter-Molecular Charge (ICT) transfer reaction is an interesting area for many researchers in the field of chemical physics and physical chemistry. For the last few decades both experimental and theoretical studies started from the dual fluorescence of the 4-N, N-dimethyl amino benzonitrile (DMABN) and ascribed to Intramolecular Charge Transfer (ICT) process [1]. Later on several researchers designed new molecules and studied the possibility of photoinduced ICT reactions [2-10]. Subit kumar Saha et al. have reported excited state isomerizations, effect of viscosity and temperature dependent torsional relaxation on TICT fluorescence of trans-2[4-(dimethylamino) styryl] benzothiazole [2]. Amrita Chakraborty et al. have reported photophysical properties of Trans-3- (4-monomethylamino-phenyl)-acrylonitrile and discussed about the Twisted Intramolecular Charge Transfer (TICT), process [3]. Rupashree Balia Singh and others have reported spectroscopic and theoretical evidence for the photoinduced twisted intramolecular charge transfer state formation in N, N-dimethylaminonaphthyl-(acrylo)- nitrile and compared experimental results with the different theoretical models [4]. The three different theoretical models used to explain the observed anomlous emission of the molecules are the Twisted Intramolecular Charge Transfer (TICT), Planarized Intramolecular Charge Transfer (PICT) and hybridized intramolecular charge transfer process [5-10]. V. Raj Gopal et al. have reported results on wavelength dependent Trans to Cis and quantum chain isomerizations of Anthrylethylene derivatives [11]. But they studied wavelength dependent Trans to Cis photostationary composition by preferential light absorption and excitation of the Trans-isomer at longer wavelength only. This is only a qualitative description of the Trans-Cis photoisomerization of the Anthrylethylene derivatives but it is necessary to study the kinetics of photoisomerization and formation of photostationary state in terms of time-resolved fluorescence studies.
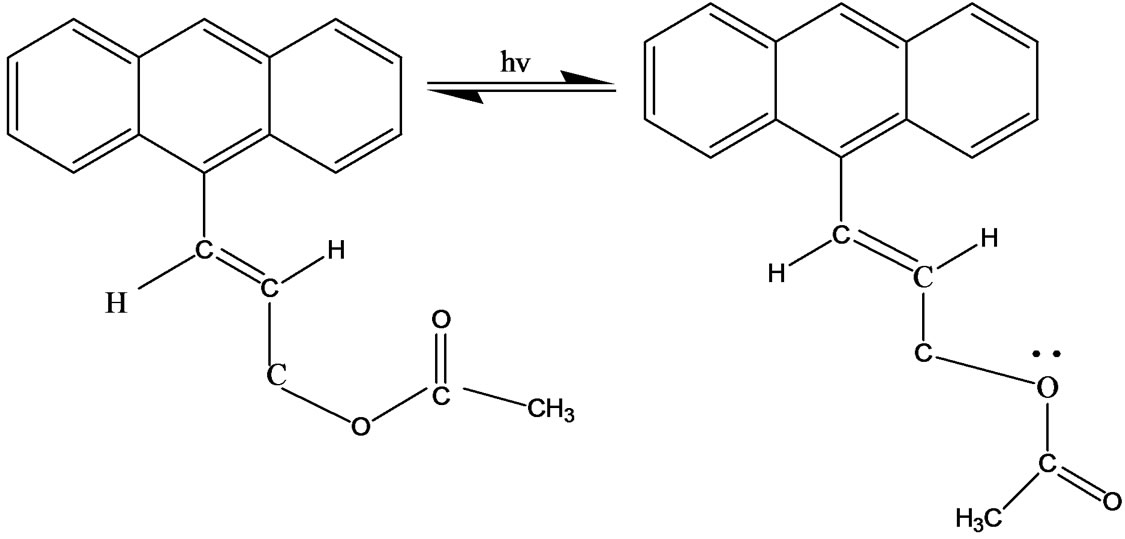
In the present work, ground and excited state properties of Anthrylacrylic ester were investigated to explore its photophysical properties in various conditions using steady-state absorption and time-resolved fluorescence measurements. The ground and excited state geometric isomers (i.e., structural change of Trans to Cis forms) of this molecule is shown in Figure 1. Orientation of the ester group with respect to double bond is different, it can be S-Cis or it can be S-Trans. Cis-Trans isomers are due to rotation around double bond. The energy difference between Cis and Trans-isomers is much higher at room temperature and only the more stable Trans isomers predominate. If dynamic equilibrium between Trans and Cisisomers is of prime importance in describing the photophysical behaviour of Anthrylacrylic ester, this should be reflected in the decay parameters. Such studies were not reported in previous work and we have thus performed the experiments in various solvents to confirm the kinetic behaviour of Anthrylacrylic ester in various conditions. Fluorescence decays monitored over each emission maxima showed bi-exponential behavior, and yielded two lifetime components and are in favor of the existence of different isomers having two excited electronic sates. Bi-exponential behavior might also be interpreted in terms of aggregates, S2 emission twisted intramolecular charge transfer states or even the presence of an impurity but the detailed study on this molecule as a function of concentration and excitation energy supports the conversion of Trans into Cis form of the molecule. Anthrylacrylic ester exhibits dual emissions as a function of concentration and excitation energy. The high-energy emission is assigned due to locally excited state or Franck-Condon state (Transisomer) and the lower energy emission due to charge transfer state/Cis-isomer.
2. Experimental
Anthrylacrylic ester was obtained from Indian Institute of Chemical Technology, (IICT) Hyderabad [11], and was used without further purification. All solvents were of spectroscopic grade (Fluka) and were used as received. The purity of the solvents was checked before use by HPLC-MS method [12]. The absorption spectra in various solutions at 1 × 10⁻⁵ mol·dm–3 were recorded using Hitachi Model U-3010/U-3310 spectrophotometer and fluorescence measurements were recorded using Hitachi model F-7000 fluorescence spectrophotometer. Timeresolved fluorescence measurements were carried out using a picosecond operated time-correlated single photon counting unit, which is described elsewhere [13]. In the present work, 373 nm (Nano LED, 1.2 ns, 1 MHz) was used as the excitation light source and a TBX4 de tection module (IBH) coupled with a special Hamamatsu PMT was used for fluorescence detection. For the present set up, the instrument response was ~1.2 ns (~240 ps) at
 (a)
(a)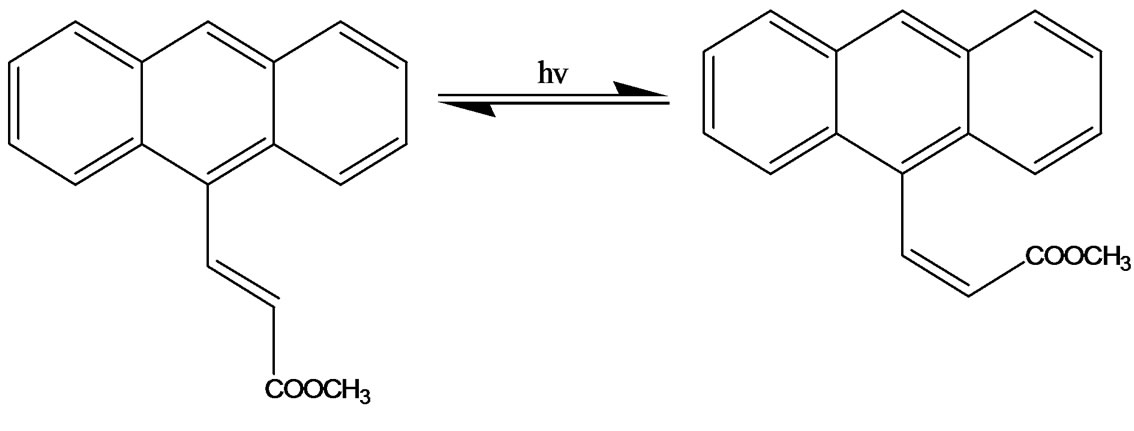 (b)
(b)
Figure 1. (a) Ground state conformers at room temperature (at very low energy) [Orientation of the carbonyl group with respect to double bond is different, it can be S-Cis or it can be S-Trans]; (b) Excited state geometric isomers (CisTrans isomers are due to rotation around double bond. This energy difference is much higher at room temperature only the more stable Trans isomers predominates).
Full Width at Half Maxima (FWHM). Fluorescence decays were recorded with a vertically polarized excitation beam and fluorescence was collected at magic angle 54.7˚ and was analyzed by a deconvolution method at room temperature.
3. Results and Discussion
3.1. Steady State Absorption and Fluorescence Excitation Studies
Figure 2 shows the electronic absorption spectrum of Anthrylacrylic ester in various solvents of different polarity functions at low concentration (1 × 10⁻⁵ mol·dm–3). The peak positions of the absorption spectrum in all solvents are around 384 - 386 nm and not much change in the absorption spectrum were observed by change of solvent polarity. However in case of methanol and toluene solutions the absorption maxima are located around 382 nm and 388 nm. But no change in absorption band is observed except little broadening of the spectra as a function of concentration (1 × 10⁻⁵ to 1 × 10⁻³ mol·dm–3) (not shown in Figure 2) in all solvents used.
The fluorescence excitation maxima for emissions 400 nm and 480 nm recorded at low concentration (at 1 × 10⁻⁵ mol·dm–3) in almost all solvents located respectively in the regions 345 nm and 385 nm indicates the existence of two independent absorbing species (Figure 3). Comparison of steady-state absorption with the fluorescence
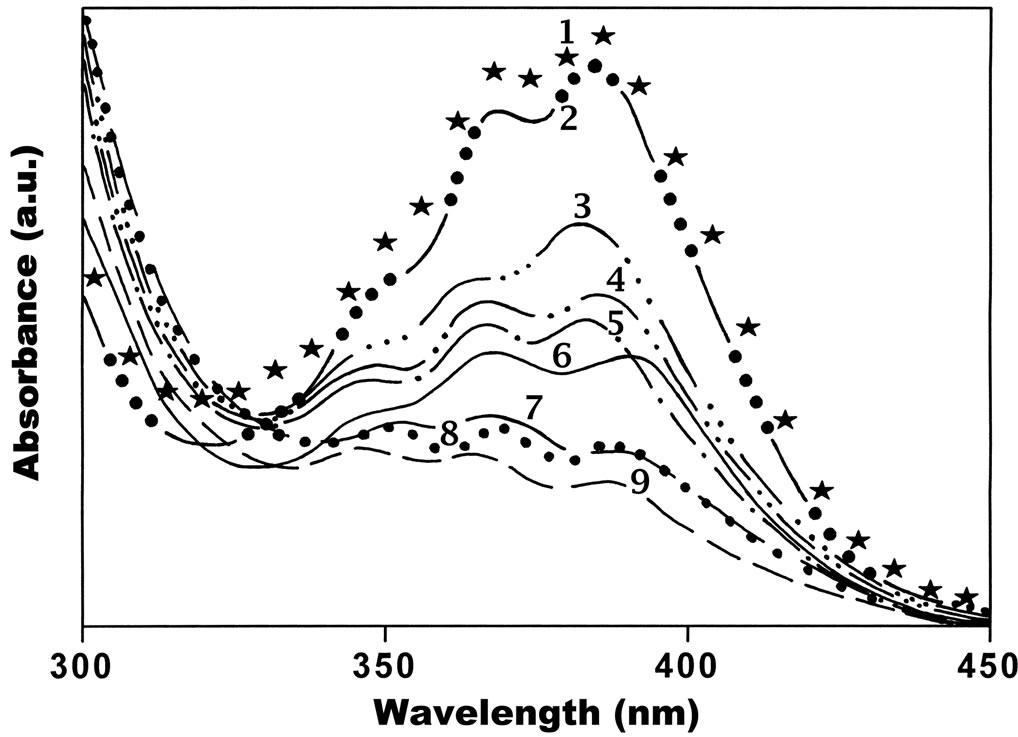
Figure 2. Absorption spectra of Anthrylacrylic ester at 1×10⁻⁵ mol·dm–3 in (1) Acetonitrile; (2) n. Propanol; (3) Butanol; (4) Tetrahydrofuran; (5) Methanol; (6) Toluene; (7) Dioxane; (8) Benzene; (9) Cyclohexane.
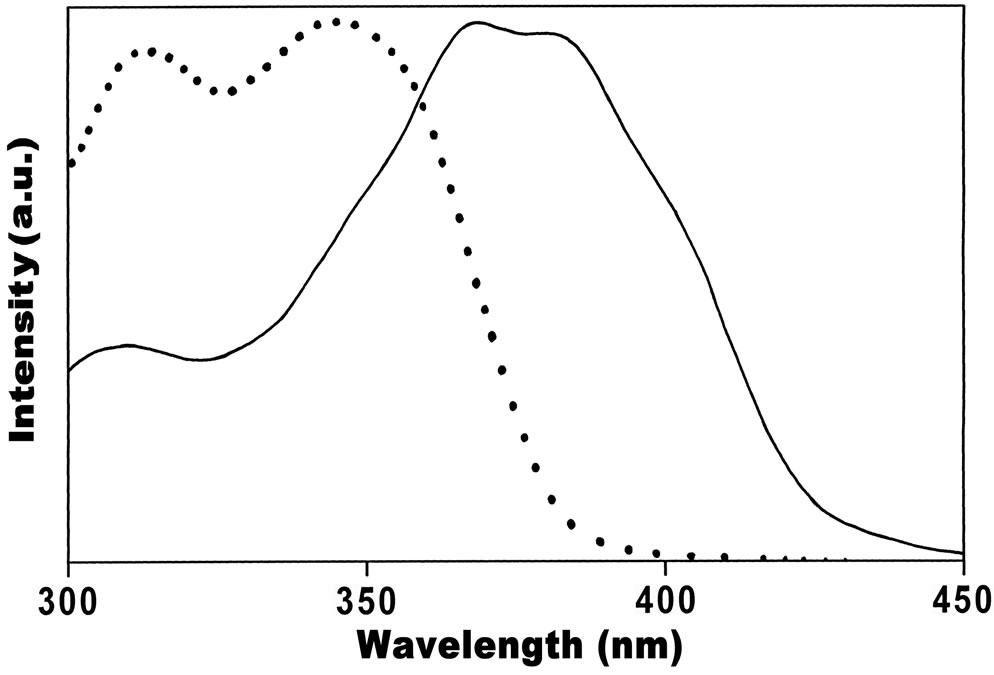
Figure 3. Excitation spectra of Anthrylacrylic ester in Cyclohexane at concentration 1×10⁻⁵ mol·dm–3 for lem 400 nm (● ● ● ● ●) and 480 nm (▬▬▬).
excitation (not shown) in all solvents as a function of concentration inferred the existence of different iso-mers/ conformers.
3.2. Fluorescence Emission Studies
The dual emission of the dye was observed at low concentration (1 × 10⁻⁵ mol·dm–3) in all solvents used. Thus in order to understand the existence of dual emissions of the dye in different solutions the effect of concentration and excitation wavelength has been investigated and the result shows concentration and excitation wavelength dependence. The dramatic change in fluorescence behavior was observed along with the increase in the Stoke’s shift as a function of polarity of the solvents. At low concentration (1 × 10⁻⁵ mol·dm–3) the dye exhibits two emission bands in all solvents with their peak positions ranging from 390 - 420 nm (I band) and 430 - 510 nm (II band) for lex 350 nm and 400 nm (Figures 4 and 5).
The intensity contribution of the emission band I and band II are respectively (94% - 92%) and (6% - 8 %). The peak positions of emission bands are solvent dependent and are red shifted with increasing polarity of the solvent, indicating the increased basicity of the solute in the excited state. The emission band II shifts more towards (red shift) higher wavelength region (436 - 500 nm) as compared to the emission band I (390 - 430 nm) due to the change of solvent from non-polar to polar and moreover, Anthrylacrylic ester is highly fluorescent in non-polar solvent as compared to polar solvent. Intensity of shorter wavelength emission band around 400 nm (I band) goes on decreases and merges with the second emission band around 480 nm (band II) in all solvents as the concentration of the dye is increased from 1 × 10⁻⁵ to 1 × 10⁻³ mol·dm–3. The emission maxima observed above 450 nm at higher concentrations (1 × 10⁻³ mol·dm–3) is assigned to the charge transfer state and the emission maxima observed around ~400 nm at lower concentrations (10–6 mol·dm–3) is assigned to the locally excited state or Franck Condon state. Concentration dependent fluorescence emission spectra of Anthrylacrylic ester in benzene solutions are shown in Figures 4 and 5 respectively for λex 350 nm and 390 nm.

Figure 4. Emission spectra of Anthrylacrylic ester in Benzene as a function of concentration 1×10⁻⁶ (- × - × -), 1×10⁻⁵ (- - -), 1×10⁻⁴ (● ● ● ● ●) and 1×10⁻³ (x x x x x) [mol·dm–3] for λex = 350 nm.

Figure 5. Emission spectra of Anthrylacrylic ester in Benzene as a function of concentration 1×10⁻⁶ (- × - × -), 1×10⁻⁵ (- - -), 1×10⁻⁴ (● ● ● ● ●) and 1×10⁻³ (x x x x x) (mol·dm–3) for λex = 400 nm.
With the increase of concentration from 1×10⁻⁵ to 1×10⁻³ mol·dm–3, there is a continuous shift of emission maxima towards higher wavelength region (red shift) both in polar and non-polar solvents (for both λex 350 nm and 390 nm) which reveals that the longer wavelength band is associated with isomers/charge transfer state. The emission spectra recorded as a function of excitation wavelength ranging from 300 nm to 370 nm in various concentrations shows that the peak position of the emission band I (390 - 420 nm) was slightly red shifted (Figure 6). However, fluorescence emission for excitation wavelength 390 nm and above the longer wavelength band II (430 - 510 nm) alone was observed. But at lower concentrations both the emissions (band I and band II) were observed for 380 nm excitation. This finding clearly indicates that two emissions are originated through different emitting species. At lower concentration (1 × 10⁻⁵ mol·dm–3) the fluorescence emission bands observed around 400 nm (I band) and 480 nm (II band) in nonpolar and polar solvents at excitation wavelength about 380 nm was assigned as Trans (52%) and Cis (48%) photoisomerization. However, at the excitation wavelength 390 nm and above leads to enhanced accumulation of Cis-isomer to over 94% from Trans isomer (6%) and hence our experimental results are in agreement with the earlier researchers [11]. Consequently at higher concentrations (1 × 10⁻³ mol·dm–3) the conversion of Trans to Cis photoisomerizations are respectively 6% and 94% (I band and II band). At lower concentrations the band at shorter wavelength region (band I) is found to be predominant over the band at higher wavelength region (band II). With increase of concentration there is a continuous shift of emission band II towards red region with increase in intensity (~94%) while there is a little shift of fluorescence emission band I towards the red region with suppressed intensity (~6%) reveals the charge transfer character of the state. This phenomenon has been observed in all polar and non-polar solvents. Thus, fluorescence characteristics of Anthrylacrylic ester studied as a function of concentration and excitation wavelength reveals the existence of two emitting species. In addition the experimental results may also be explained in terms of the possible resonance structure of the molecules as shown in Figures 1(a) and 1(b). Figure 1(a) shows the ground-state conformers; at room temperature the orienttation of the ester group with respect to double bond is different , it can be S-Cis or it can be S-Trans. Figure 1(b) shows excited state geometric isomers; Cis-Trans isomers are due to rotation around double bond.
It is evident from experimental observation that the energy difference between Cis-Trans isomers is much higher at room temperature therefore more stable Trans isomers predominates. However, at very low concentration and at excitation wavelength around 385 nm the
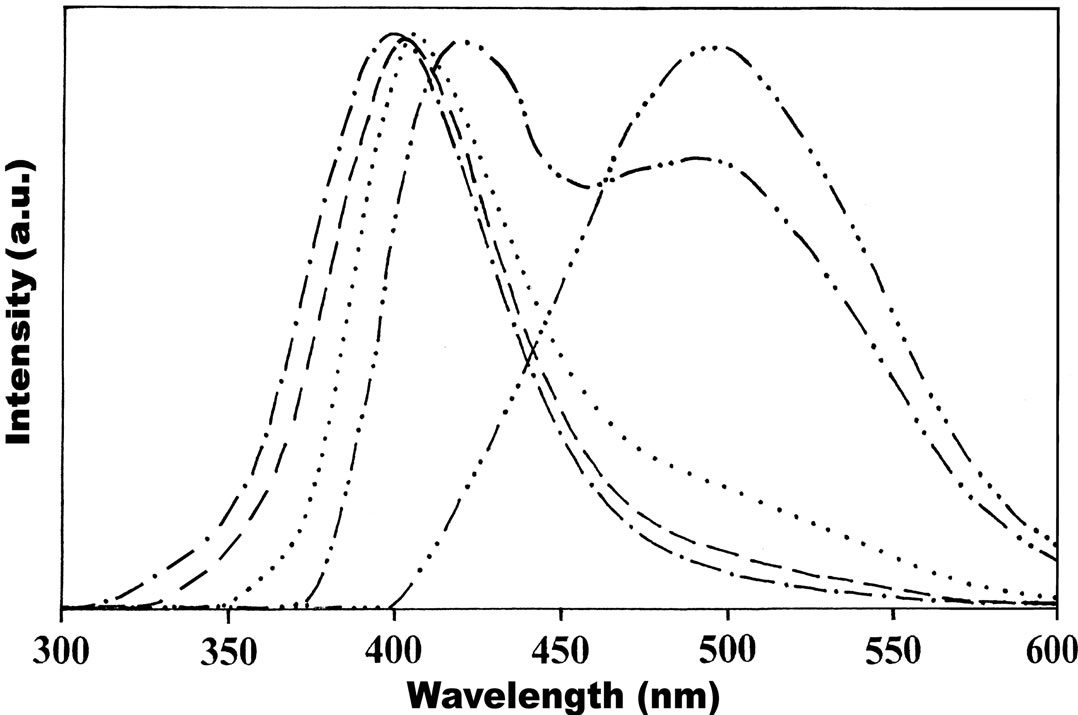
Figure 6. Emission spectra of Anthrylacrylic ester in Acetonitrile as a function of excitation wavelength at 1×10⁻⁵ mol·dm–3 (1) 320 nm (- × - × -); (2) 340 nm (- - -); (3) 360 nm (××××××); (4) 380 nm (- ×× - ×× -) and (5) 400 nm (- ××× -).
S-Cis form and S-Trans forms of the molecule are in equilibrium. Based on these observations, the fluorescence band observed at longer wavelength region (band II) is assigned to isomers/charge transfer state (in particular Cis-isomers). However, the possibility of the occurrence of fluorescence emission band towards longer wavelength side due to excimers/dimers, is less probable because in which case there should be a regular increase in intensity of higher wavelength emission band while the intensity of the lower wavelength emission band should decrease with increasing concentrations [12,14].
3.3. Solvatochromic Measurements
The electronic absorption and fluorescence emission characteristics of Anthrylacrylic ester in various solvents of different polarity functions were investigated in order to study the role of polarity in modifying both ground and excited states of the molecule and the changes in dipole moment of the molecule were estimated by using Lippert-Mataga’s relation [15-20].
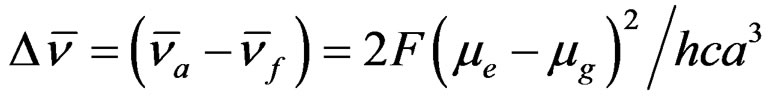 (1)
(1)
where  and
and are the absorption and fluorescence emission maxima wave numbers in cm–1, μg and μe are the ground and excited state dipole moments.,

where ε and n are respectively dielectric constant and refractive index of the solvents and were taken from literature [21]. The value of the solute cavity radius a, was calculated by using the Suppan relation [22].
 (2)
(2)
where δ is the density of solute molecule, M the molecular weight of the solute and N is the Avogadro’s number. Using Equation (2) the cavity radius a, estimated for Anthrylacrylic ester were found to be 3.71A0. The solute-solvent properties and solvent shift data are collected in Tables 1 and 2.
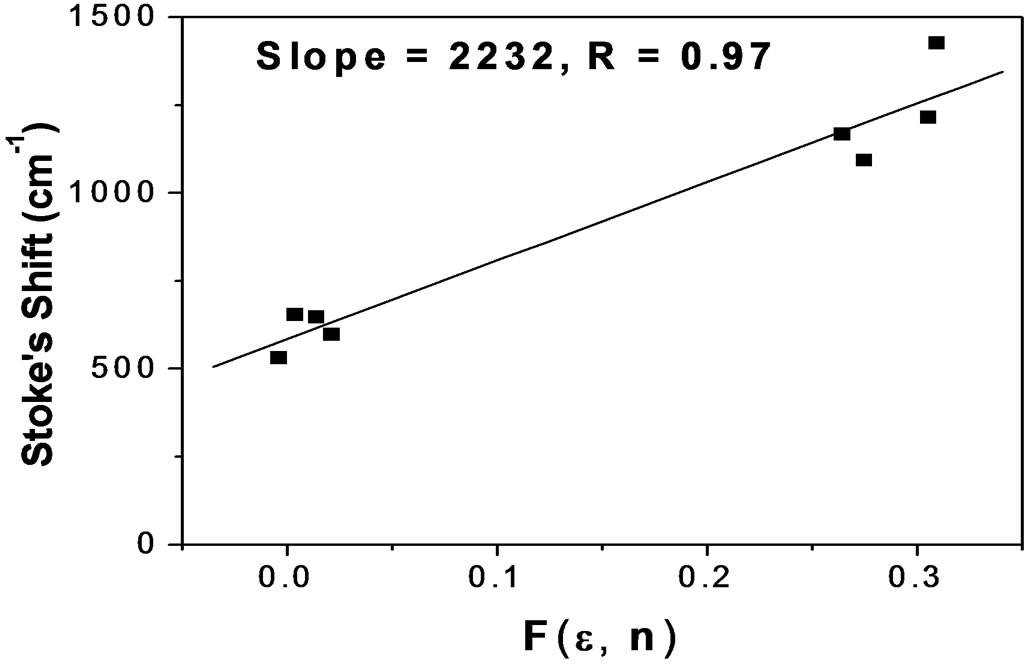
Figures 7(a) and 7(b) shows the plot of Stoke’s shift (in·cm–1) versus solvent polarity functions (F) with good correlation coefficients R = 0.97 and R = 0.96 for I and II emission bands (emissions bands I and II are due to S-Trans and S-Cis-isomers). Using the corresponding slopes the change in dipole moments for S-Trans and SCis-isomers were estimated to be  and
and  with errors 3% and 4%, respectively. These change in dipole moments for emission bands I and II are in favor of the existence of two isomers called S-Trans and S-Cis-isomers. The higher excited state dipole moments of S-Trans and S-Cis-isomers than that of the ground state dipole moment indicates that the excited state electronic charge distribution should be substantially different from that of the ground state charge distribution [23-25].
Dielectric constant and refractive index were taken from reference [21] and  values were taken from references [18] and [19].
For understanding polarization dependence/hydrogen bonding effect on spectral characteristic, the change in dipole moment was estimated by using  function, which is the empirical measure of solvent polarity and is based on the solvatochromic behaviour of a betaine dye as a probe solute. On this scale each solvent gives the quantitative expression for polarity. The correlation between the spectral shifts with
  has been developed by Ravi et al. [24] theoretically and accordingly the excited state dipole moment was estimated by using the following expression.

(3)
where,  is the microscopic solvent polarity function proposed by Reinhardt,
 and
and 
are respectively the change of dipole moment and Onsager cavity radius of a standard Betaine dye in the solvent and  and a are the corresponding quantities of the molecule of interest. The errors involved in the estimation of Onsager radius is reduced to some extent because of the ratio
  in Equation (2). Equation (2) illustrates that the Stoke’s shift changes linearly with the solvent polarity function
 . A plot of Stoke’s shift versus
  gives a straight line with correlation coefficient of 0.92 (Figure 8) and from the slope of this plot the change in dipole moment was estimated to be about
 . A good correlation coefficient and the higher value of change in dipole moment obtained in this case are in favour of Trans to Cis form of the molecule after excitation.
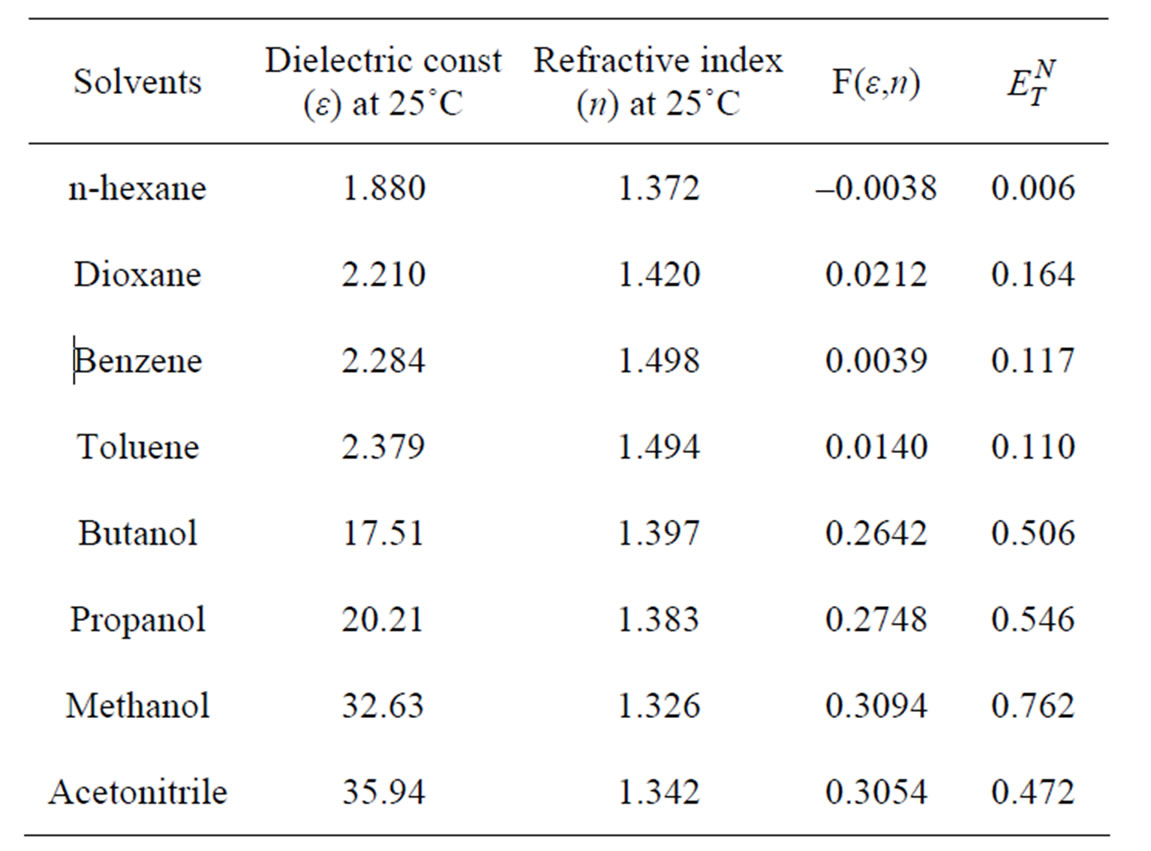
Table 1. Solvent properties and polarity functions of Anthrylacrylic ester.
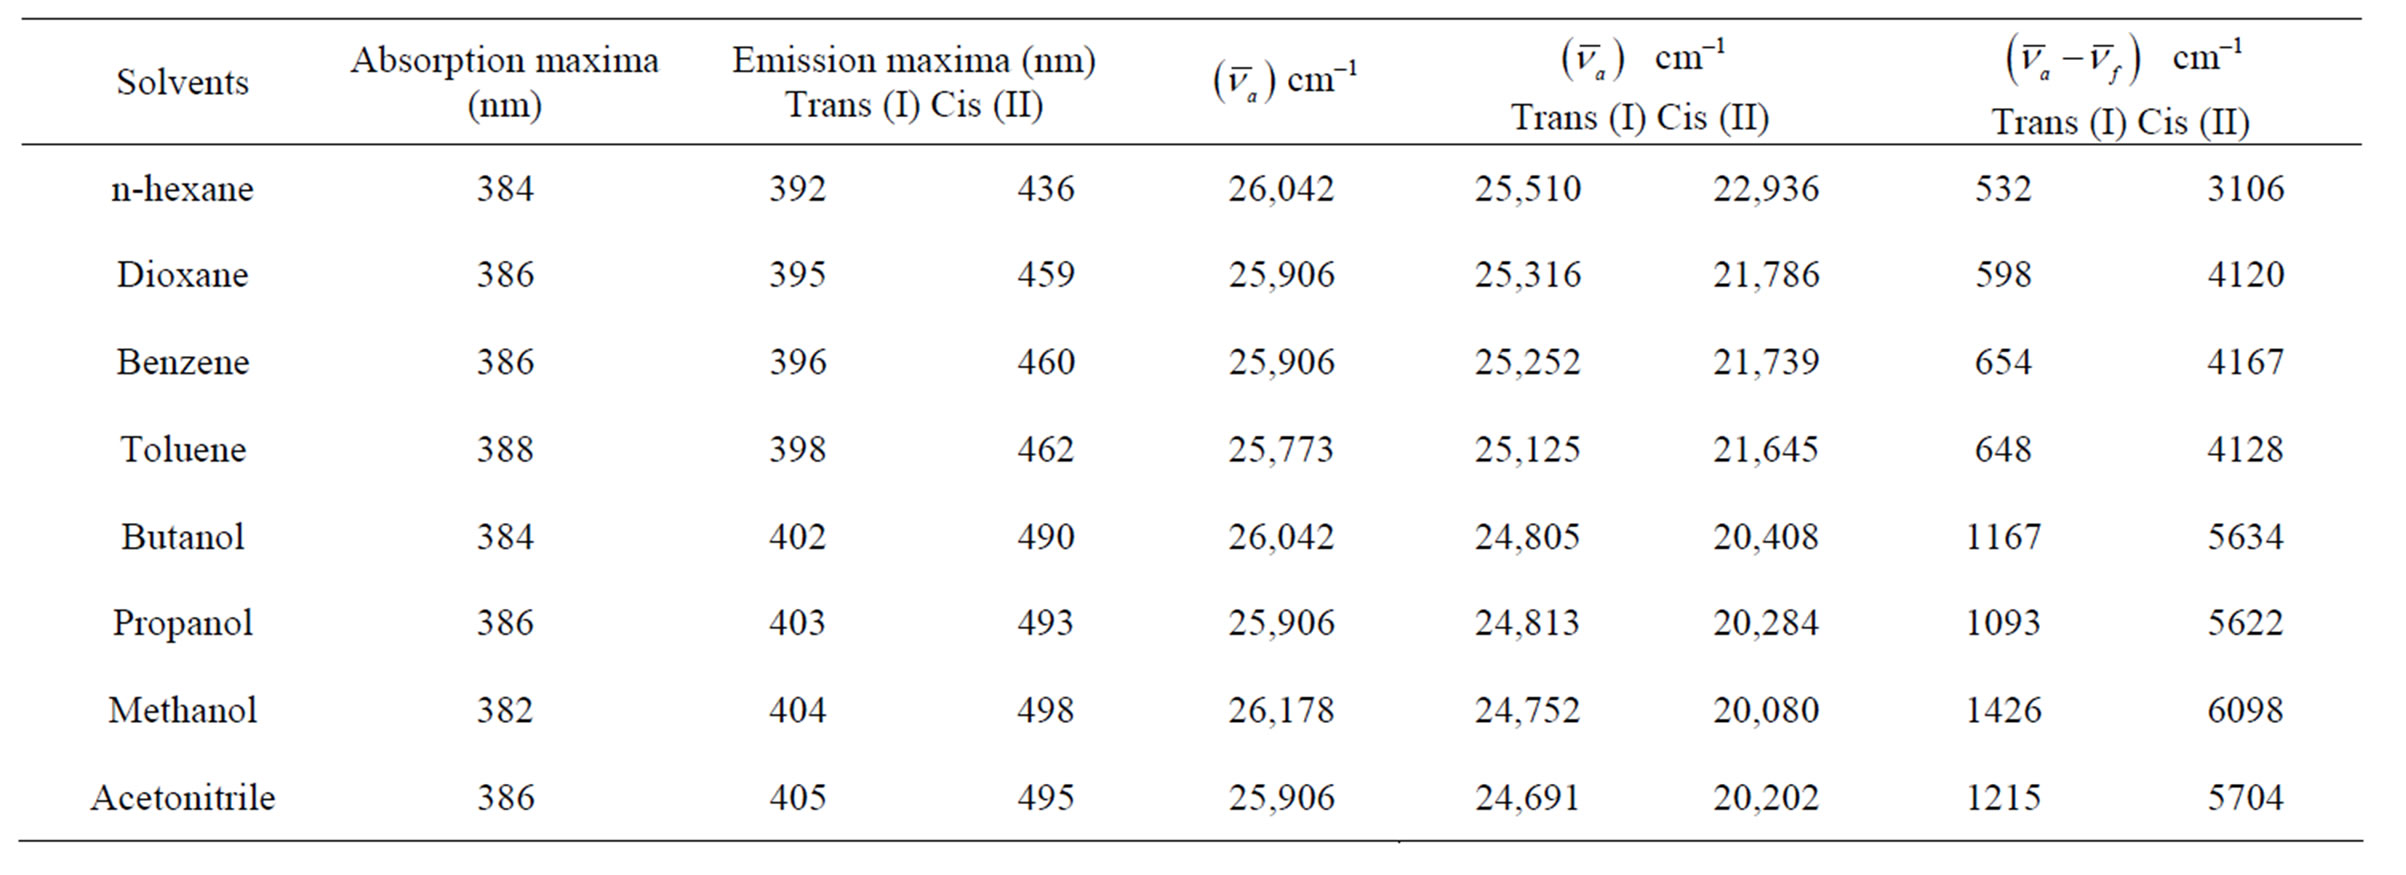
Table 2. Solvent shift data for Anthrylacrylic ester in various solvents at 1×10⁻⁵ mol·dm–3.
 (a)
(a)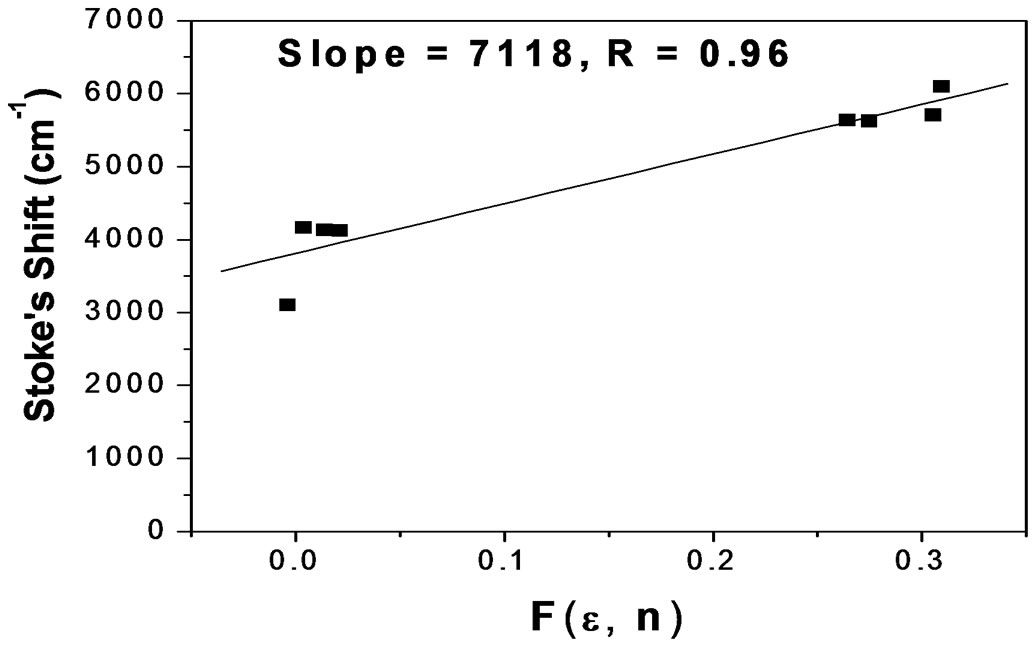 (b)
(b)
Figure 7. (a) Plot of Stoke’s shift versus F(e, n) according to Lippert-Mataga’s relation for λem = 400 nm (Trans-form); (b) Plot of Stoke’s shift versus F(e, n) according to Lippert-Mataga’s relation for λem = 480 nm (Cis-form).
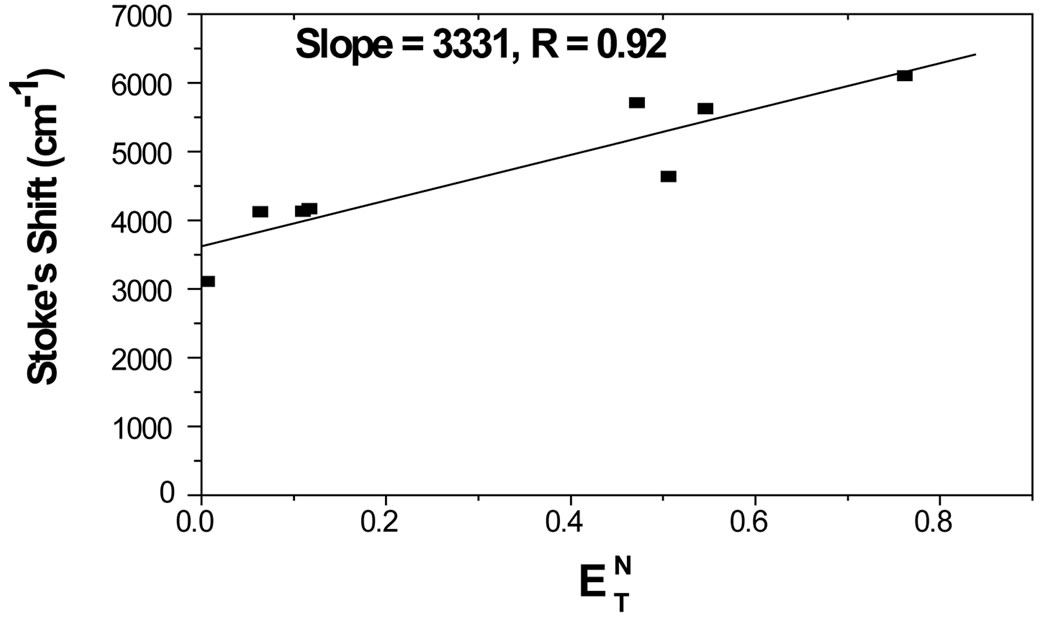
Figure 8. Plot of Stoke’s shift versus .
.
3.4. Fluorescence Decays
The fluorescence decays of Anthrylacrylic ester in various solvents (1×10⁻⁵ mol·dm–3) were recorded to understand the mechanism of isomerization and the possible involvement of charge transfer excited states. Fluorescence decay in various solvents for each emission was fitted to bi-exponential function [26].
 (4)
(4)
where t1, t2 are the lifetimes of the two decay components and a1, a2 are their respective amplitudes such that a 1+ a 2 = 1.
The fluorescence lifetimes estimated in different solvents are listed in Table 3. As can be seen from the Table 3, the decay parameters depend on the emission wavelength and nature of the solvent. From the Table 3 it is to be noted that lifetime (t1) and amplitudes (a1) of the first component in all solvents is less than the second component (t1 < t2) and (a1 < a2) for emission 400 nm. However the lifetime (t1) of the first component in all solvents is less than the second components (t1 < t2) with (a 1 > a 2) the amplitude of the first component greater than the second component i.e., the relative contribution is reversed for emission 480 nm indicating the conversion of Trans-isomer to Cis-isomers. However, the average lifetime lies between 1.64 ns to 2.76 ns except dioxane and benzene (7.06 ns & 5.30 ns) for lem 480 nm and 3.61 ns to 6.30 ns for lem 400 nm.
In other words the large difference between two decay components indicates the presence of two emitting species or a single species from two different excited states [27]. From the fluorescence decay measurements the fluorescence emission maxima at 400 nm was assigned to as normal species (Trans-isomer) and that of at 480 nm as due to the formation of isomers/CT states (Cisisomers). It is observed that at lower concentrations the band I of Anthrylacrylic ester due to the monomer
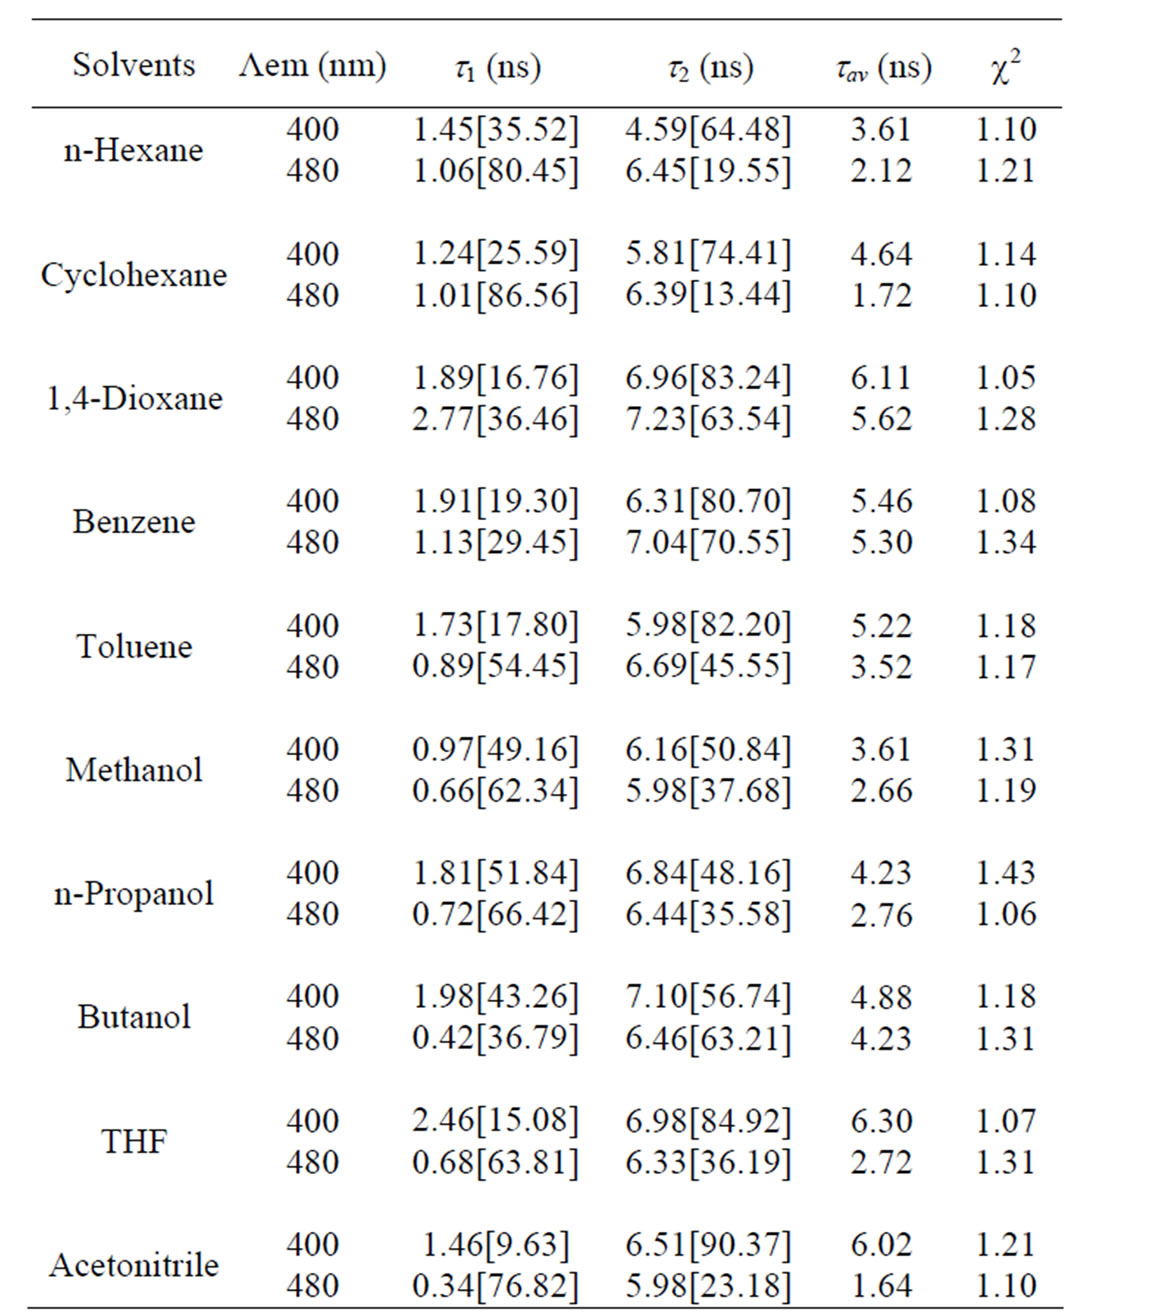
Table 3. Fluorescence lifetimes of Anthrylacrylic ester in various solvents at 1×10⁻⁵ mol·dm–3 (at lex = 373 nm at room temperature).
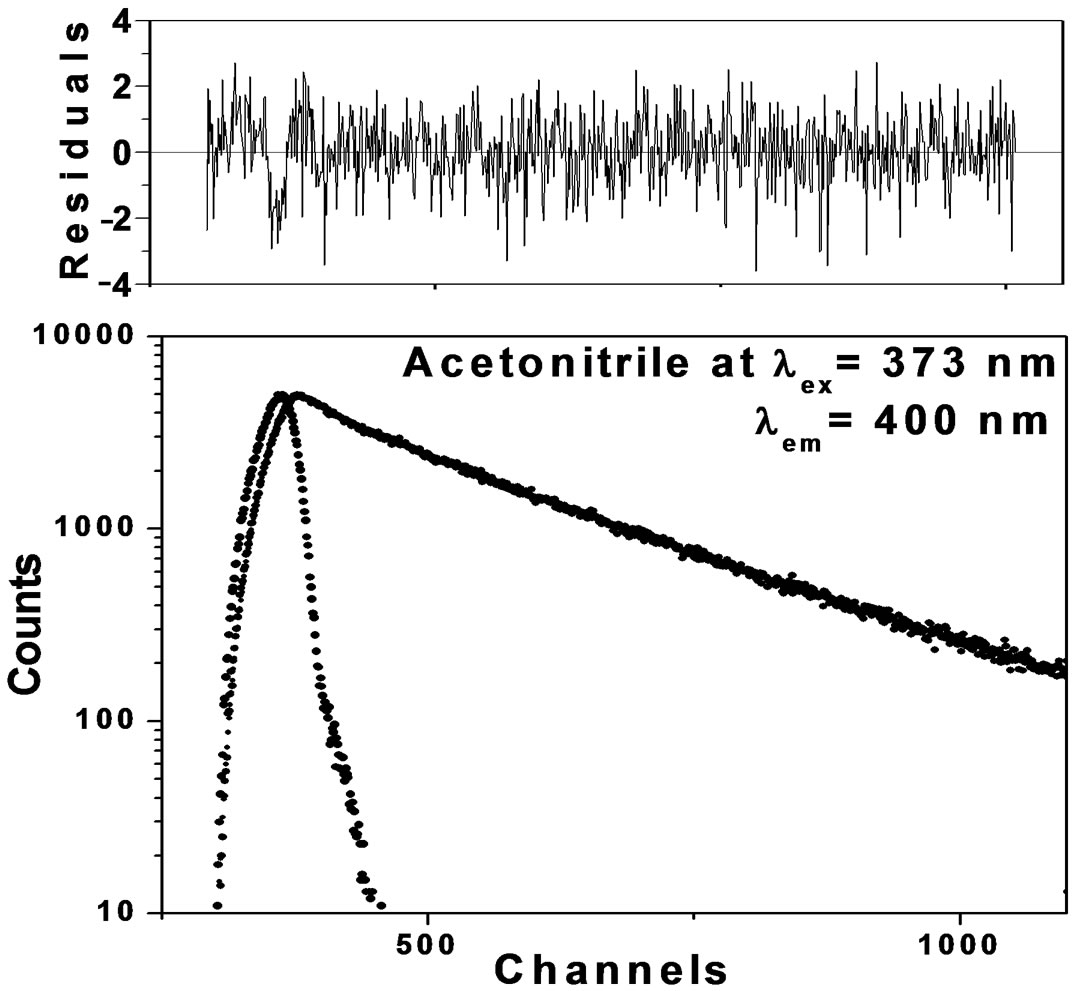
predominates over the fluorescence emission due to isomers/charge transfer states. In dilute solutions the average separation of solute molecules is too large to allow an appreciable proportion of the excited molecules to encounter a second solute molecule within the lifetime of the excited state. The formation of conformers/charge transfer state in dilute solutions is small however, as concentration increases; the average separation between solute molecules becomes too small to allow the interaction between solute/solvent molecules leading to the formation of charge transfer state. In order to study the existence of dynamic equilibrium between Trans and Cisisomers at low concentration and at excitation wavelength around 380 nm the fluorescence decays were measured at λex 373 nm as it is the best suited wavelength available for us at the time of experimental measurements. The fluorescence decay profiles are shown in Figure 9 in Acetonitrile solutions at λem 400 nm and 480 nm along with weighted residuals at λex 373 nm. Fluorescence decay profiles (Figures 9(a) and (b)) show the clear cut difference between Trans and Cis-isomers. In our opinion, the observation of bi-exponential fluorescence decay for Anthrylacrylic ester itself offers unique interpretation in terms of Cis and Trans-isomers.
4. Conclusions
The electronic absorption and fluorescence emission characteristics of Anthrylacrylic ester in various solvents of different polarity were investigated in order to study the role of polarity in modifying both ground and excited states of the molecule. It is observed that the excited state dipole moment of Anthrylacrylic ester is greater than its ground state dipole moment indicating the more polar character of the excited state.
The fluorescence emission exhibits two emission bands one at 400 nm (band I) and another at 480 nm (band II) for λex 350 nm and 390 nm at low concentration. The change of solvent, concentration and excitation wavelength induces dramatic changes in the photoproperties such as emission spectra and fluorescence lifetimes. In addition the estimated values of change in dipole moments for emission bands I and II are respectively  and
and  shows the wide separation between the existence of S-Trans and S-Cis-isomers of the molecule. Thus the existence of more than two species monomer (Trans) and charge transfer state isomers (Cis-isomers) are inferred from the concentration and excitation wavelength dependence of fluorescence emission. The ratio of formation of Trans to Cis-isomers is also concentration and excitation wavelength dependent.
Fluorescence decays monitored over each emission maxima showed bi-exponential behavior, and yielded two lifetime components and are in favor of the existence
 (a)
(a)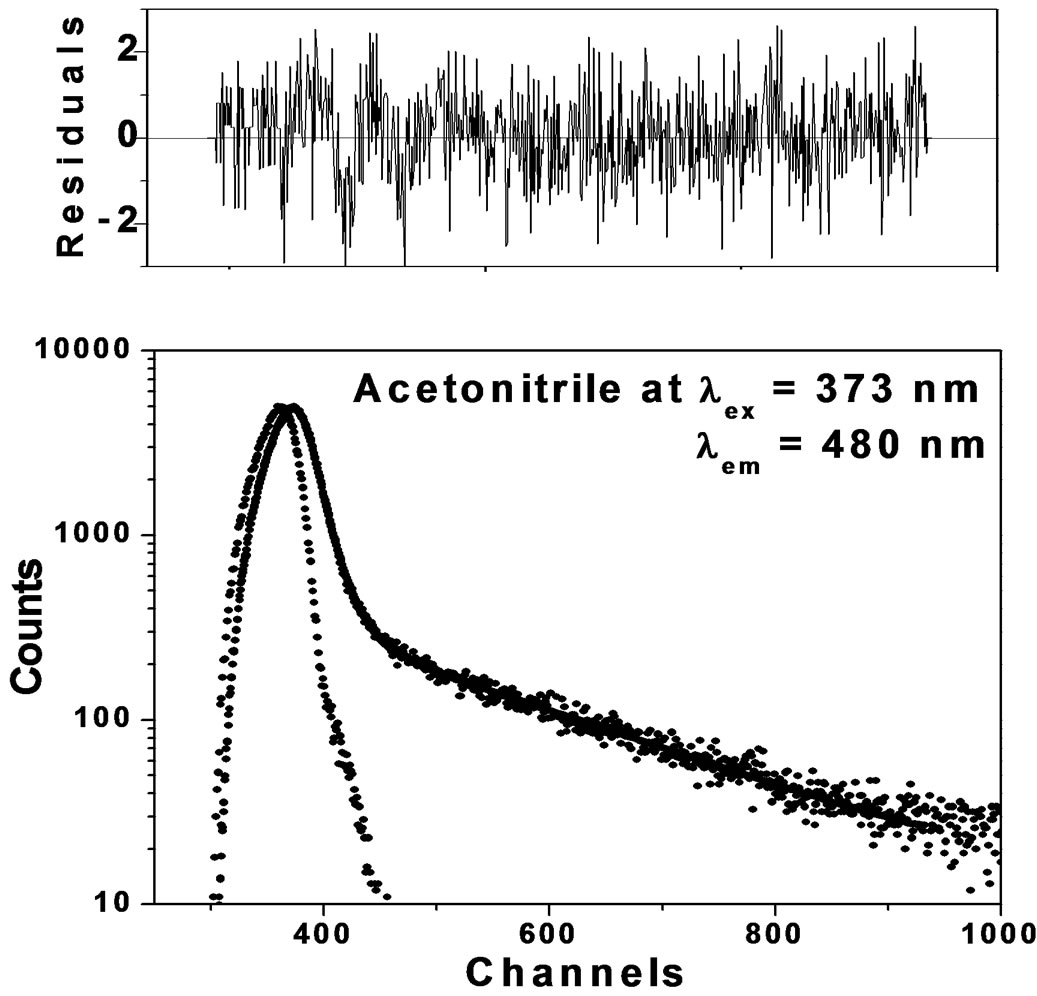 (b)
(b)
Figure 9. (a) Fluorescence decay of Anthrylacrylic ester at λem 400 nm; (b) Fluorescence decay of Anthrylacrylic ester at λem 480 nm.
of different isomers having two excited electronic sates. Based on the experimental results of steady state and time-resolved emission studies, two different types of electronic states of Anthrylacrylic ester in the excited state inferred are the LE state (Trans-isomers) and charge transfer state/isomers (Cis-isomer) having average lifetimes between 3.61 ns to 6.3 ns & 1.64 ns to 5.6 ns respectively.
5. Acknowledgements
One of the authors (Anil B. Naik) thanks to CSIR, New Delhi for awarding Senior Research Fellowship (SRF). The authors would like to thank Prabhat K. Singh from Molecular Photochemistry Section, Radiation and Photochemistry Division, Bhabha Atomic Research Centre (BARC), Mumbai, India for technical help during fluorescence decay measurements. Thanks to Prof. M. V. Kulkarni for fruitful discussions.
REFERENCES
- E. Lippert, W. Ludar and H. Boss., “Advances in Molecular Spectroscopy,” Pergamon Press, Oxford, 1962.
- S. K. Saha, P. Purkayastha, A. B. Das and S. Dhara, “Excited State Isomerization and Effect of Viscosityand Temperature-Dependent Torsional Relaxation on TICT Fluorescence of Trans-2-[4-(Dimethylamino)Styryl] Benzothiazole,” Journal of Photochemistry and Photobiology A: Chemistry, Vol. 199, No. 2-3, 2008, pp. 179-187.
- A. Chakraborty, S. Kar and N. Guchhait, “Photophysical Properties of Trans-3-(4-Monomethylamino-Phenyl)-Acrylonitrile: Evidence of Twisted Intramolecular Charge Transfer (TICT) Process,” Chemical Physics, Vol. 324, No. 2-3, 2006, pp. 733-774. doi:10.1016/j.chemphys.2005.12.032
- R. B. Singh, S. Mahanta, S. Kar and N. Guchhait, “Spectroscopic and Theoretical Evidence for the Photoinduced Twisted Intramolecular Charge Transfer State Formation in N,N-Dimethylaminonaphthyl-(Acrylo)-Nitrile,” Journal of Luminescence, Vol. 128, No. 9, 2008, pp. 1421-1430. doi:10.1016/j.jlumin.2008.01.015
- Z. R. Grabowski, K. Rotkiewicz and A. Siemiarezak, “Dual Fluorescence of Donor-Acceptor Molecules and the Twisted Intramolecular Charge Transfer (TICT) States,” Journal of Luminescence, Vol. 18-19, 1979, pp. 420-424. doi:10.1016/0022-2313(79)90153-4
- J. Catalan, C. Diaz, V. lopez, P. Perez and R. M. Claramunt, “The TICT Mechanism in 9,9’-Biaryl Compounds: Solvatochromism of 9,9’-Bianthryl, N-(9-Anthryl) Carbazole, and N,N’-Bicarbazyl,” The Journal of Physical Chemistry, Vol. 100, No. 47, 1996, pp. 183-192.
- C. Rulliere, Z. R. Grabowski and J. Dobkowski, “Picosecond Absorption Spectra of Carbonyl Derivatives of Dimethylaniline: The Nature of the Tict Excited States,” Chemical Physics Letters, Vol. 137, No. 5, 1987, pp. 408- 413. doi:10.1016/0009-2614(87)80224-5
- K. A. Zachariasse, “Comment on Pseudo-Jahn-Teller and TICT-Models: A Photophysical Comparison of Meta-and Para-DMABN Derivatives: The PICT Model for Dual Fluorescence of Aminobenzonitriles,” Chemical Physics Letters, Vol. 320, No. 1-2, 2000, pp. 8-13. doi:10.1016/S0009-2614(00)00230-X
- A. Sobolewski and W. Domcke, “Charge Transfer in Aminobenzonitriles: Do They Twist,” Chemical Physics Letters, 250, No. 3-4, 1996, pp. 428-436. doi:10.1016/0009-2614(96)00014-0
- L. R. Naik, A. B. Naik and H. Pal, “Steady-State and Time-Resolved Emission Studies of Thioflavin-T,” Journal of Photochemistry and Photobiology A: Chemistry, Vol. 204, No. 2-3, 2009, pp. 161-167. doi:10.1016/j.jphotochem.2009.03.016
- V. R. Gopal., M. Reddy and V. J. Rao, “Wavelength Dependent Trans to Cis and Quantum Chain Isomerizations of Anthrylethylene Derivatives,” The Journal of Organic Chemistry, Vol. 60, No. 24, 1995, pp. 7966-7973. doi:10.1021/jo00129a043
- L. R. Naik and N. N. Math, “Photo Physical Properties of 8-Hydroxy Quinoline,” Indian Journal of Pure & Applied Physics, Vol. 43, 2005, pp. 743-749.
- M. Kumbhakar, S. Nath, T. Mukherjee and H. Pal, “Effect of Temperature on the Dynamics of Electron Transfer in Heterogeneous Medium: Evidence for Apparent Marcus Inversion,” Journal of Photochemistry and Photobiology A: Chemistry, Vol. 182, No. 1, 2006, pp. 7-12. doi:10.1016/j.jphotochem.2006.01.005
- S. A. Rani, J. Sobhanadri and T. A. P. Rao, “Solvent and Concentration Effects on the Steady State Fluorescence of Fluorenone,” Journal of Photochemistry and Photobiology A: Chemistry, Vol. 94, No. 1, 1996, pp. 1-5. doi:10.1016/1010-6030(95)04114-1
- M. Ravi, A. Samanta and T. P. Radhakrishnan, “Excited State Dipole Moments from an Efficient Analysis of Solvatochromic Stokes Shift Data,” The Journal of Physical Chemistry, Vol. 98, No. 37, 1994, pp. 9133-9136. doi:10.1021/j100088a007
- C. Antonious, M. S. Aaron, J. J. Buna, M. Tine, A and L. Cisse, “Determination of the First Excited Singlet State Dipole Moments of Coumarins by the Solvatochromic Method,” Spectroscopy Letters, Vol. 27, No. 4, 1994, pp. 439-449.
- B. Acemioglu, M. Arik, H. Efeoglu and Y. Onganer, “Solvent Effect on the Ground and Excited State Dipole Moments of Fluorescein,” Journal of Molecular Structure: Theochem, Vol. 548, No. 1-3, 2001, pp. 165-171. doi:10.1016/S0166-1280(01)00513-9
- M. P. Haas and J. M. Warman, “Photon-Induced Molecular Charge Separation Studied by Nanosecond TimeResolved Microwave Conductivity,” Chemical Physics, Vol. 73, No. 1-2, 1982, pp. 35-53. doi:10.1016/0301-0104(82)85148-3
- A. Kawaski, “On the Estimation of Excited-State Dipole Moments from Solvatochromic Shifts of Absorption and Fluorescence Spectra,” Zeitschrift für Naturforschung, Vol. 57A, 2002, pp. 255-262.
- L. R. Naik and N. N. Math, “Estimation of Ground and Excited State Dipole Moments of Coumarin 450 by Solvatochromic Shift Method,” Journal of Photosceince, Vol. 12, No. 2, 2005, pp. 57-61.
- R. C. Weast, “Hand book of Chemistry,” 68th Edition, CRC Press, Boca Raton, 1987.
- P. Suppan, “Excited-State Dipole Moments from Absorption/Fluorescence Solvatochromic Ratios,” Chemical Physics Letters, Vol. 94, No. 3, 1983, pp. 272-275. doi:10.1016/0009-2614(83)87086-9
- S. Kumar, V. C. Raoand and R. C. Rastogi, “Excited-State Dipole Moments of Some Hydroxycoumarin Dyes Using an Efficient Solvatochromic Method Based on the Solvent Polarity Parameter, ETN,” Spectrochimica Acta Part A: Molecular and Biomolecular Spectroscopy, Vol. 57, No. 1, 2001, pp. 41-47. doi:10.1016/S1386-1425(00)00330-9
- M. Ravi, T. Soujanya, A. Samantha and T. P. Radhakrishna, “Excited-State Dipole Moments of Some Coumarin dyes from a Solvatochromic Method Using the Solvent Polarity Parameter, ETN,” Journal of the Chemical Society, Faraday Transactions, Vol. 91, 1995, pp. 2739-2742. doi:10.1039/ft9959102739
- R. Giri, S. S. Rathi, M. K. Machwe and V. V. S. Murti, “Solvent and Substituent Effects: Depolarization of Fluorescence of Solutions of 4-Phenyl-6,7-Dimethoxy Coumarin,” Indian Journal of Pure & Applied Physics, Vol. 28, No. 6, 1988, pp. 445-448.
- L. R. Naik, H. M. Suresh Kumar, S. R. Inamdar and N. N. Math, “Steady-State and Time-Resolved Emission Studies of 6-Methoxy Quinoline,” Spectroscopy Letters, Vol. 38, No. 4-5, 2005, pp. 645-659. doi:10.1081/SL-200062818
- A. B. Naik, L. R. Naik, J. S. Kadadevarmath, P. Haridas and V. J. Rao, “Fluorescence Quenching of Anthrylvinyl Acetate by Carbon Tetrachloride,” Journal of Photochemistry and Photobiology A: Chemistry, Vol. 214, No. 2-3, 2010, pp. 145-151.
NOTES
*Corresponding author.