Open Journal of Geology
Vol.05 No.04(2015), Article ID:55846,14 pages
10.4236/ojg.2015.54019
Neotectonics of Tabas Area, Central Iran by Index of Active Tectonics (IAT)
Elahe Javadi Mosavi1, Mehran Arian1*, Manochehr Ghorshi2, Mohammad Nazemi3
1Department of Geology, Science and Research Branch, Islamic Azad University, Tehran, Iran
2Department of Geology, North Tehran Branch, Islamic Azad University, Tehran, Iran
3Department of Geology, Tabas Branch, Islamic Azad University, Tabas, Iran
Email: *mehranarian@yahoo.com
Copyright © 2015 by authors and Scientific Research Publishing Inc.
This work is licensed under the Creative Commons Attribution International License (CC BY).
http://creativecommons.org/licenses/by/4.0/


Received 23 March 2015; accepted 14 April 2015; published 21 April 2015
ABSTRACT
In this research, Tabas area, which is located in central Iran, was selected as the study area and three geomorphic indices were calculated for its structural fronts. Through averaging these three indices, we obtained index of active tectonics (IAT). The values of the index were divided into classes to define the degree of active tectonics. Therefore, relative tectonic activity was calculated and their values were classified and analyzed in two groups. Regions were identified as high and moderate levels. In analyzing data and combining them with tectonic setting, the results were often associated and justified with regional geology. Our results show that the highest value is located along Shoutori fault, which shows 2 class of relative tectonic activity (high level). Also, moderate values are located along Ereshk, Ezmeighan and Jamal faults (moderate level). According to these results, Shoutori fault is the most active fault in the study area and this situation is compatible with its position as a mountain front fault.
Keywords:
Active, Tectonics, Index, Tabas, Central Iran

1. Introduction
The study area is the north part of Tabas area [1] in the east-central Iran basin [2] . Dominant structural trend in east-central Iran province is N-S (Figure 1). From tectonics view, it contains an ancient island arc on the west of the Lut Plain-Gonabad province that has accreted to this along Nayband fault system (western border of the Lut microcontinent) by eastward subduction in Pre-Cambrian [3] .
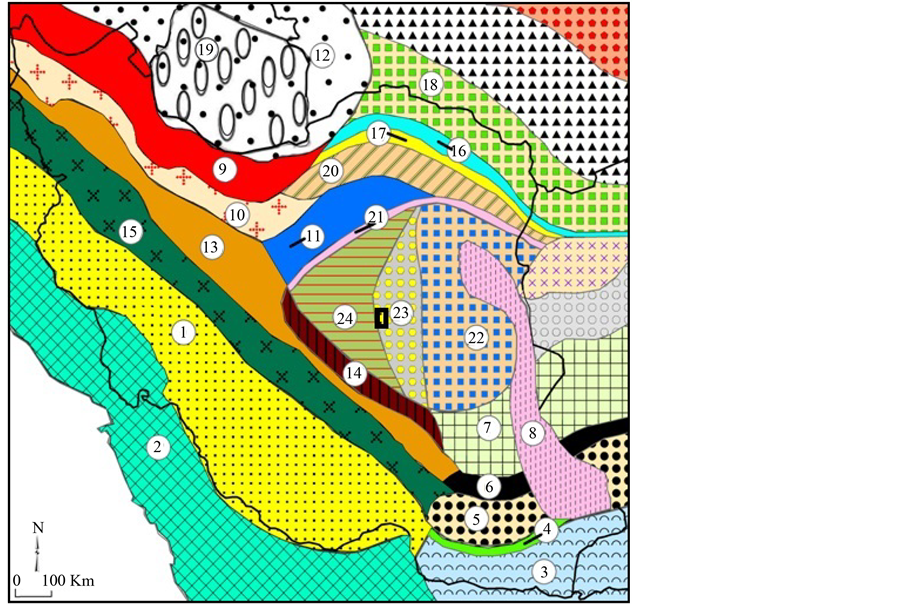
Figure 1. Physiographic-tectonic zoning map of Iran’s sedimentary basins Iran modified from [1] . Numbers in this figure are 1: Zagros-East Taurus hinterland; 2: Persian Gulf-Mesopotamian foreland basin; 3: Makran accretionary prism; 4: Bashagard Mountains; 5: Jazmorian-Mashkel fore arc basin; 6: Shahsavaran-Soltan magmatic arc; 7: South Lut-South Helmand back arc basin; 8: East Iran Mountain belt; 9: West-Central Alborz and lesser Caucasus hinterland; 10: Great Kavir-Nor- thenUrmieh lake foreland basin; 11: South Great Kavirfold and thrust belt; 12: South Caspian-Black sea foreland basin; 13: Urmieh-Dokhtar Magmatic arc; 14: Naien-Kerman retro arc foreland basin; 15: Sanandaj-Sirjanoverthrust belts; 16: East Alborz or Binalod hinterland; 17: Torbat-e am-Neyshabour retro arc foreland basin; 18: KopetDagh hinterland; 19: South Caspian remnant basin; 20: Maiamay- Taibad Inverted back arc basin; 21: Khaf-Kavir Plain Magmatic arc; 22: Lut Plain- Gonabad back arc basin; 23: Tabas hinterland; 24: Yazd-Khour Piggy back basin. The study area is shown in the black rectangle.
In this study, area is divided into 4 structural fronts and the following indices are calculated: stream-gradient index (SL), valley floor width-valley height ratio (Vƒ), and mountain-front sinuosity (Smf). We use geomorphic indices of active tectonics, known to be useful in active tectonic studies [4] -[7] . This methodology has been previously tested as a valuable tool in different tectonically active areas, namely SW USA [8] , the Pacific coast of Costa Rica [9] , central Zagros, Iran [10] .
2. Materials and Methods
The calculated geomorphic indices are suitable for assessment of tectonic activity of the study area. The geomorphic indices such as: stream-gradient index (SL), valley floor width-valley height ratio (Vƒ) and mountain-front sinuosity (Smf) are calculated in Tabas area by using topographic data. On the other hand, the area was divided into four structural fronts and for each one, indices were calculated, then all of the indices were combined to obtain index of active tectonics (IAT) by new method [11] . Therefore, structural fronts can be compared together.
The study area is located between longitudes 55˚50'E-57˚30'E and latitudes 33˚N-34˚N in Yazd province, central Iran. Based on previous work on the salt diapirism [12] -[21] and neotectonics regime in Iran [22] [23] , Zagros in south Iran is the most active zone [24] -[33] . Then, Alborz in north Iran [34] -[68] and central Iran [69] -[76] have been situated in the next orders.
Altitudes in this area reach to 2600 m on Shoutori Mountains, which have about 400 m difference respect to the Tabas plain. Geomorphologically, the ridges and valleys in the area under study are mainly due to the rocks variations in the lithology and assisted by faults presence in the area that offer varying degrees of resistance to the degradation processes. Topographically, the down faulted Tabas plain is Neogene gypsiferous soil covered (Figure 2). Slope wash following occasional rains forming badland topography is mainly observed in the low weathered strikes valleys in the Shotouri Mountains (Figure 3).
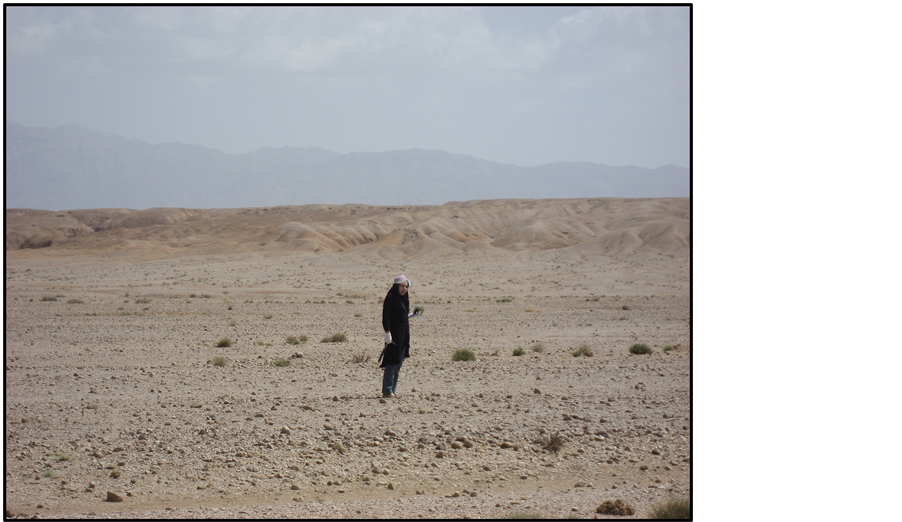
Figure 2. The Tabas plain, view to the east.
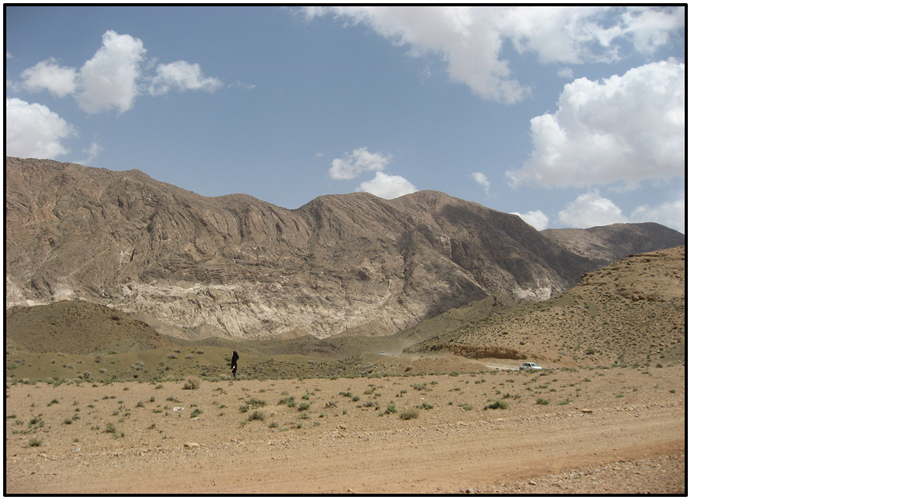
Figure 3. The Shoutori Mountain, view to the northeast.
The Tabas plain has limited to the west by an N-S trending fault and risen in a sequence of N-S trending folds of main Jurassic sandstone shale and marl-gypsum units to a prominent escarpment. In the cores, the folds partly expose Triassic permanent carbonate units, granite extrusion and Ravar Salt intrusion (Infra-Cambrian). In the southern part, the Jurassic marls and evaporate are covered by red beds and Cretaceous shelf limestones. The Tabas plain is filled with Neogene clastics and covered by dasht and playa deposits. It is limited to the E and NE by the Shotori Mountain as a horst. This horst, first uplifted in the Cimmerian tectonic phase, have several 1000 m of Paleozoic-Triassic platform sediments and a cover of Middle-Upper Jurassic limestones, shales and marls [77] .
3. Results and Discussion
To study the indices, there is a formula which we turn to describe each one of indices; it is necessary to have some primary maps to calculate the indices.
3.1. The Stream-Gradient Index (SL)
The rivers flowing over rocks and soils of various strengths tend to reach equilibrium with specific longitudinal profiles and hydraulic geometrics [78] [79] defined the stream-gradient index (SL) to discuss influences of environmental variables on longitudinal stream profiles, and to test whether streams has reached equilibrium. The calculation formula is in this manner:

where (∆H/∆L) is local slope of the channel segment that is located between two contours and L is the channel length from the division to the midpoint of the channel reaches for which the index is calculated. This index is calculated along the master river (Table 1) and then SL contour map is prepared (Figure 4). The SL index can be used to evaluate relative tectonic activity. An area on soft rocks with high SL values can be indicated for active tectonics. Based on [11] , SL value is classified into 3 categories, which are: class 1 (SL > 500), class 2 (300 < SL < 500), and class 3 (SL < 300). The more values of SL is greater than 300, thus there are in 2 and 3 classes.
3.2. Valley Floor Width-Valley Height Ratio (Vƒ)
Another index sensitive to tectonic uplift is the valley floor width to valley height ratio (Vƒ). This index can separate v-shaped valleys with small amounts from u-shaped valleys with greater amounts. The calculation formula is in this manner:

where Vƒw is the width of the valley floor, and Ald, Ard and Asc are the altitudes of the left and right divisions (looking downstream) and the stream channel, respectively. [4] [78] found significant differences in Vƒ between tectonically active and inactive mountain fronts. Also, they found significant differences in Vƒ between tectonically active and inactive mountain fronts, because a valley floor is narrowed due to rapid stream down cutting (Figure 5).
Valleys upstream from the mountain front tend to be narrow and Vƒ is usually computed at a given distance upstream from the mountain front. We set a distance to 1 - 2 km, and within the mountain range. The Vƒ of the main transverse valleys in the study area was calculated by cross-section that was drawn from the topographic map.
Vƒw value is obtained by measuring the length of a line which cuts the river and limits to two sides of a contour through which the river crosses. Values of Ald, Ard, and Asc are measured using the drawn profile (Table 2). Based on [11] , Vƒ values are divided into 3 classes: 1 (Vƒ < 0.3), 2 (0.3 < Vƒ < 1), and 3 (Vƒ > 1). Therefore, all of the valleys are in class 3 and show u-shaped valleys.
3.3. Mountain-Front Sinuosity Index (Smf)
This index represents a balance between stream erosion processes tending to cut some parts of a mountain front and active vertical tectonics that tend to produce straight mountain fronts. Index of mountain front si-

Table 1. Values of stream length-gradient index.
nuosity [3] is defined by:

where Lj is the planimetric length of the mountain along the mountain-piedmont junction, and Ls is the straight-line length of the front. The mountain fronts of the study area are drawn by faults and folds (Figure 6). Smf is commonly less than 3, and approaches 1 where steep mountains rise rapidly along a fault or fold [73] . Therefore, this index can play an important role in tectonic activity. Considering that mountain fronts sites are independent from basins places, and there are four various fronts (Table 3). Values of Smf are readily calculated from topographic maps for 4 mountain fronts in 8 segments.
Based on [11] , Smf values are divided into 3 classes: 1 (Smf < 1.1), 2 (1.1 < Smf < 1.5), and 3 (Smf > 1.5) and in the study area most of the obtained values are between 1.1 to 1.5 (class 2).
4. Results and Discussion
The average of the three measured geomorphic indices (Vƒ, Smf and SL) was used to evaluate the distribution of relative tectonic activity. Each of the indices was divided into 2 and 3 classes (Table 4). Through averaging these three indices, we obtain one index that is known index of active tectonics (IAT). The values of the index are divided into four classes to define the degree of active tectonics: 1-very high (1 < IAT < 1.5), 2-high (1.5 < IAT < 2), 3-moderate (2 < IAT < 2.5), 4-low (2.5 < IAT) [11] . Thus, there are high relative tectonic activities along Shoutori fault and moderate relative tectonic activities along Ereshk, Ezmeighan and Jamal faults.
Table 2. Values of Vf index.
Table 3. Values of Smf index.
Table 4. Relative Tectonic activity classification.
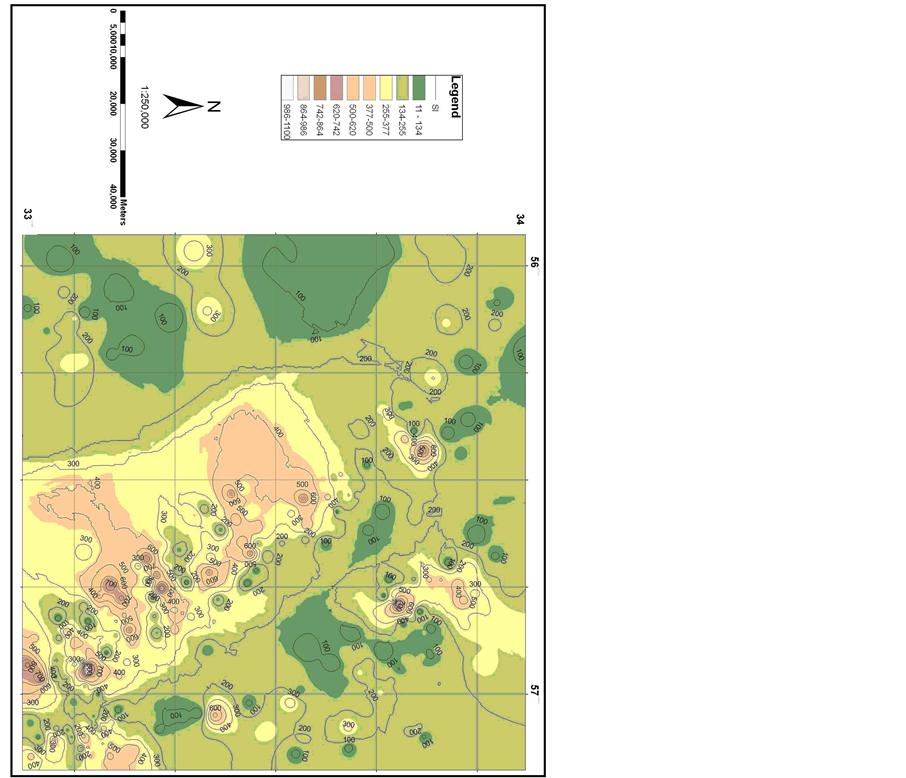
Figure 4. Sl Contour map of study area.
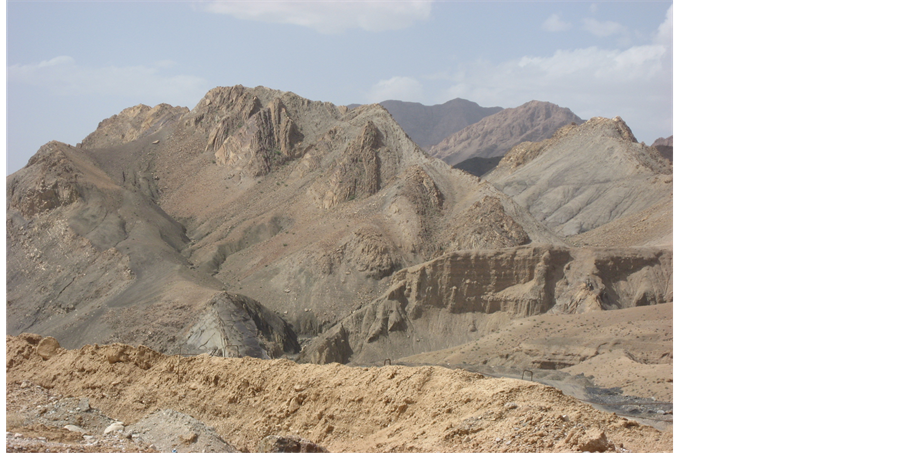
Figure 5. The narrow valleys in the Shoutori Mountain, view to the northeast.
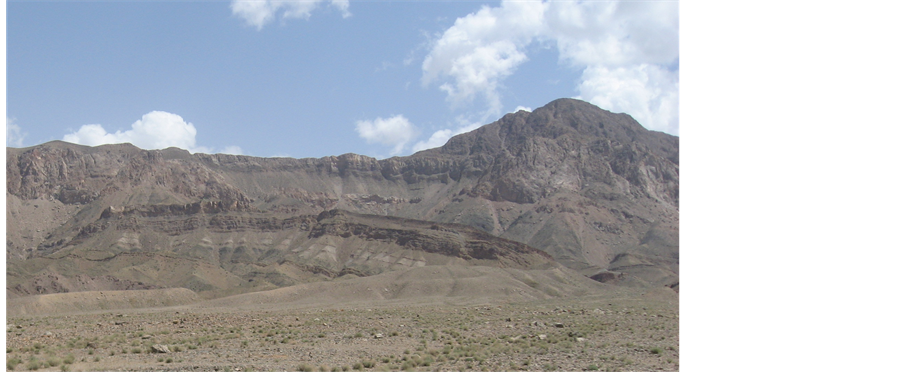
Figure 6. The Shoutori Mountain front, view to the northeast.
Also, based on [23] , this area is a high seismic risk zone with following seismicity parameter: b = 0.90, M max = 7.5. Focal mechanisms of the many earthquakes are dextral strike slip faulting with reverse component in southern part and reverse faulting (Figure 7) with dextral strike slip component in northern part such as Tabas (Ms = 7.4, 1978) and western part such as Zarand (Ms = 6.5, 2004). Tabas area experiences moderate to high earthquakes with low frequency, long repeat time and down to 15 Km focal depth. Intensity of earthquakes is in high levels. The most serious seismic hazards in the study area are landslide in high regions, settlement in plain, surface faulting.
The seismic records and the major structural front traces of study area have shown in Figure 8.
5. Conclusions
The calculated geomorphic indices are suitable for assessment of tectonic activity of the study area. The geomorphic indices such as: stream-gradient index (SL), valley floor width-valley height ratio (Vƒ) and mountain-front sinuosity (Smf) are calculated in Tabas area. Therefore, firstly the area was divided to four structural fronts and for each one, indices were calculated, then all of the indices were divided into 2 classes. Afterwards, 3 measured indices for each front were compounded and a unit index obtained as index of active tectonics (IAT).
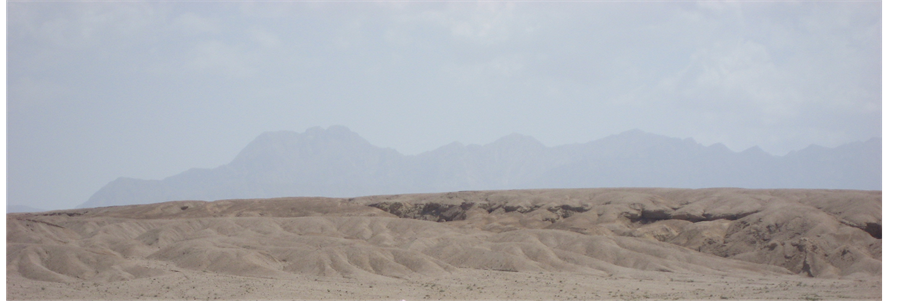
Figure 7. The Tabasfault, view to the east.
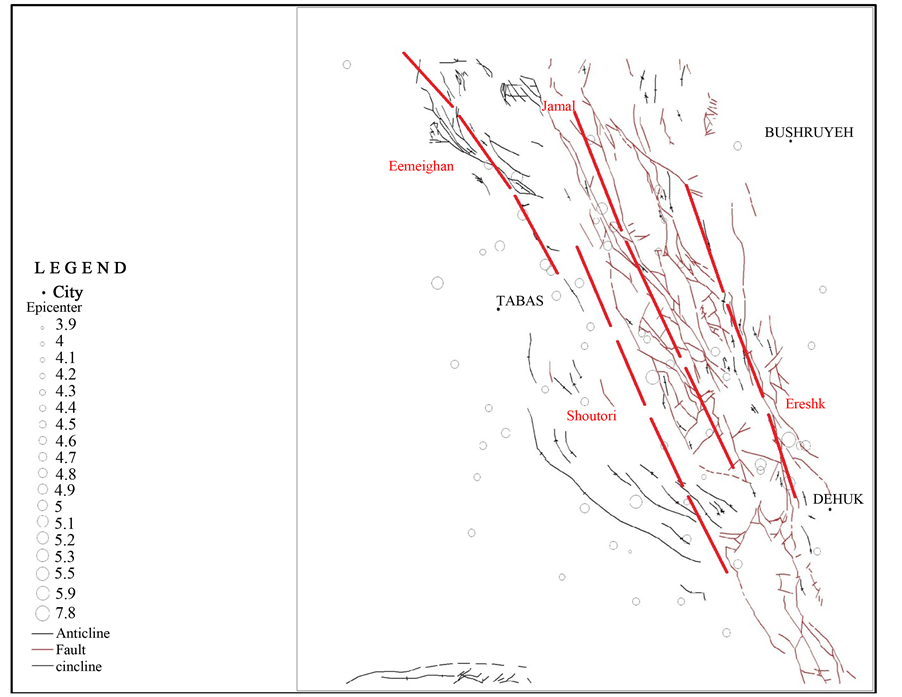
Figure 8. Seismic records and the major structural front traces of study area.
According to these indexes, there are both high and moderate relative tectonic activities levels.
High relative tectonic activities level has been found along Shoutori fault and moderate relative tectonic activities level has been found along Ereshk, Ezmeighan and Jamal faults. It means that Shoutori fault is the most active fault in the study area and this situation is compatible with its position as a mountain front fault.
Acknowledgements
This work has funded by the Department of Geology, Islamic Azad University, Science and Research Branch, Tehran, Iran. Also, special thanks to vice-president for research in Science and Research Branch, Tehran.
References
- Arian, M. (2013) Physiographic-Tectonic Zoning of Iran’s Sedimentary Basins. Open Journal of Geology, 3, 169-177. http://dx.doi.org/10.4236/ojg.2013.33020
- Qorashi, M. and Arian, M. (2011) Tectonics of Iran. Geologic Survey of Iran, Tehran, 336 p.
- Arian, M. (2011) Basement Tectonics and Geology of Iran. Asar Nafis Press, Qum, 300 p.
- Bull, W.B. and McFadden, L.D. (1977) Tectonic Geomorphology North and South of the Garlock Fault, California. In: Doehring, D.O., Ed., Geomorphology in Arid Regions: A Proceedings Volume of the 8th Annual Geomorphology Symposium, State University of New York, Binghamton, 23-24 September 1977, 115-138.
- Molin, P., Pazzaglia, F.J. and Dramis, F. (2004) Geomorphic Expression of Active Tectonics in a Rapidly-Deforming Forearc, Sila Massif, Calabria, Southern Italy. American Journal of Science, 304, 559-589. http://dx.doi.org/10.2475/ajs.304.7.559
- Silva, P.G., Goy, J.L., Zazo, C. and Bardajm, T. (2003) Fault-Generated Mountain Fronts in Southeast Spain: Geomorphologic Assessment of Tectonic and Earthquake Activity. Geomorphology, 50, 203-225. http://dx.doi.org/10.1016/S0169-555X(02)00215-5
- Keller, E.A. and Pinter, N. (2002) Active Tectonics: Earthquakes, Uplift, and Landscape. Prentice Hall, Upper Saddle River, 432.
- Rockwell, T.K., Keller, E.A. and Jonson, D.L. (1985) Tectonic Geomorphology of Alluvial Fans and Mountain Fronts Near Ventura, California. In: Morisawa, M. and Hack, J.T., Eds., Tectonic Geomorphology: Proceedings of the 15th Annual Geomorphology Symposium, Allen and Unwin Publishers, Boston, 183-207.
- Wells, S.G., Bullard, T.F., Menges, T.M., Drake, P.G., Karas, P.A., Kelson, K.I., Ritter, J.B. and Wesling, J.R. (1988) Regional Variations in Tectonic Geomorphology along Segmented Convergent Plate Boundary. Geomorphology, 1, 239-265. http://dx.doi.org/10.1016/0169-555X(88)90016-5
- Dehbozorgi, M., Pourkermani, M., Arian, M., Matkan, A.A., Motamedi, H. and Hosseiniasl, A. (2010) Quantitative Analysis of Relative Tectonic Activity in the Sarvestan Area, Central Zagros, Iran. Geomorphology, 121, 329-341. http://dx.doi.org/10.1016/j.geomorph.2010.05.002
- El Hamdouni, R., Irigaray C., Fernandez, T., Chacon, J. and Keller, E.A. (2008) Assessment of Relative Active Tectonics, Southwest Border of Sierra Nevada (Southern Spain). Geomorphology, 96, 150-173. http://dx.doi.org/10.1016/j.geomorph.2007.08.004
- Arian, M. (2011) A Preface on Salt Diapirism of Iran. Asar Nafis Press, Qum, 309 p.
- Arian, M. and Noroozpour, H. (2015) The Biggest Salt-Tongue Canopy of Central Iran. Open Journal of Geology, 5, 55-60. http://dx.doi.org/10.4236/ojg.2015.52005
- Asadian, F., Pourkermani, M. and Arian, M. (2007) Tectonic Geomorphology of Salt Structures in the Garmsar- Lasjerd Area. Geographical Research, 39, 75-84.
- Pourkermani, M. and Arian, M. (1997) Salt Domes of Central Iran. Journal of Humanities, 3, 29-41.
- Arian, M. (2012) Salt Diapirism and Tectonics. Second Edition, Asar Nafis Press, Qum, 319 p.
- Arian, M. and Noroozpour, H. (2015) Tectonic Geomorphology of Iran’s Salt Structures. Open Journal of Geology, 5, 61-72. http://dx.doi.org/10.4236/ojg.2015.52006
- Asadian, F. and Arian, M. (2009) Identification of Diapiric Provinces of Central Iran through Geological and Geographical Analysis. International Journal of Agriculture Environment & Biotechnology, 2, 3443-3451.
- Arian, M. (2012) Clustering of Diapiric Provinces in the Central Iran Basin. Carbonates and Evaporites, 27, 9-18. http://dx.doi.org/10.1007/s13146-011-0079-9
- Pourkermani, M. and Arian, M. (1998) Tectonic Geomorphology of Salt Domes in West of Zanjan Province, Iran. Iran Journal of Research Geography, 47, 44-53.
- Arian, M. and Feizi, F. (2010) The Significance of Faulting on the Surficial Spreading of Evaporitic Deposits in the Varamin-Semnan Area. Journal of Earth and Resources, 3, 1-20.
- Arian, M. (2011) Middle East Tectonics. Second Edition, Asar Nafis Press, Qum, 236 p.
- Arian, M. (2010) Applied Seismotectonics. Farazamin Press, Tehran, 304 p.
- Arian, M. and Aram, Z. (2014) Relative Tectonic Activity Classification in the Kermanshah Area, Western Iran. Solid Earth, 5, 1277-1291. http://dx.doi.org/10.5194/se-5-1277-2014
- Mashal, M., Kermani, M.P., Charchi, A., Almasian, M. and Arian, M. (2013) Pattern of Structural Geology Underground in Eastern of North Dezfol Embayment. Advances in Environmental Biology, 7, 260-268.
- Pazhoohan, M., Arian, M., Ghorashi, M. and Khosrotehrani, K. (2014) A Study of Drainage Pattern Responses to Active Tectonics in Tadvan Region‚ SW Iran. Geodynamics, 1, 36-41.
- Rahimi, N. and Arian, M. (2014) Tectonic Geomorphplogy of Hamedan-Sosangerd Region, West Iran. Advances in Environmental Biology, 8, 119-124.
- Arian, M. and Hashemi, A. (2008) Seismotectonic Zoning in the Zagros. Journal of Sciences, 18, 63-76.
- Arian, M., Ahmadnia, A., Qorashi, M. and Pourkermani, M. (2002) Structural Analysis of Mengharak Transcurrent Fault System in Zagros, Iran. Special Geo 2002 Conference Issue Geoarabia, 7, 209-210.
- Arian, M., Qorashi, M. Pourkermani, M. and Ahmadnia, A. (2003) Fractal Analysis of Mengharak Transcurrent Fault System in Zagros, Iran. Proceedings of the Fourth International Conference on Seismology and Earthquake Engineering, Iran, 12-14 May 2003, 23.
- Baharvand, S., Pourkermani, M., Ajalloian, R., Arian, M. and Nouryazdan, A.R. (2010) Seymareh Landslide and Its Role in Environmental and Geomorphologic Changes of the Pole-Dokhtar Area. Journal of the Earth, 4, 13-24.
- Abdideh, M., Qorashi, M., Rangzan, K. and Arian, M. (2011) Assessment of Relative Active Tectonics Using Morphometric Analysis, Case Study of Dez River (Southwestern, Iran). Geosciences, 20, 33-46.
- Arian, M., Qorashi, M., Pourkermani, M. and Ahmadnia, A. (2006) The Structural Significance Kareh Bas Transcurrent Fault System in the Zagros Fold and Thrust Belt. Journal of Geosciences, 15, 126-133.
- Arian, M., Maleki, Z. and Noroozpour, H. (2011) Cenozoic Diastrophism and Deformational Events in the East Central Alborz. Journal of Basic and Applied Scientific Research, 1, 2394-2400.
- Feizi, F., Arian, A. and Rahmani, R. (2007) Seismotectonic Zoning in the Eastern Part of the Central Alborz. Journal of Sciences, 17, 151-164.
- Khavari, R., Arian, M. and Ghorashi, M. (2009) Neotectonics of the South Central Alborz Drainage Basin, in NW Tehran, N Iran. Journal of Applied Sciences, 9, 4115-4126. http://dx.doi.org/10.3923/jas.2009.4115.4126
- Arian, M. and Bagha, N. (2012) Active Tectonics of Tehran Area, Iran. Journal of Basic and Applied Scientific Research, 2, 3805-3819.
- Bagha, N., Arian, M., Ghorashi, M., Pourkermani, M., El Hamdouni, R. and Solgi, A. (2014) Evaluation of Relative Tectonic Activity in the Tehran Basin, Central Alborz, Northern Iran. Geomorphology, 213, 66-87. http://dx.doi.org/10.1016/j.geomorph.2013.12.041
- Arian, M. and Feizi, F. (2005) Application of Geomorphic Indices to the Assessment of Relative Tectonic Activity Levels in the Alborz―Central Iran Border Zone. Journal of Sciences, 15, 378-403.
- Arian, M., Bagha, N., Khavari, R. and Noroozpour, H. (2012) Seismic Sources and Neo-Tectonics of Tehran Area (North Iran). Indian Journal of Science and Technology, 5, 2379-2383.
- Moghimi, H., Arian, M. and Sorbi, A. (2015) Fault Movement Potential of Marzanabad Area, North Alborz, Iran. Open Journal of Geology, 5, 126-135. http://dx.doi.org/10.4236/ojg.2015.53012
- Arian, M. and Pourkermani, M. (2004) Tectonic Elements of South Flank in the East-Central Alborz Mountain. Journal of Sciences, Teacher Training University, 4, 359-368.
- Arian, M. and Qorashi, M. (2006) The Movement Potential Evaluation of the Major Quaternary Faults in Alborz-Central Iran Border Zone, from the East of Tehran to the East of Semnan. Journal of Geosciences, Geological Survey of Iran, 15, 184-188.
- Poroohan, N., Pourkermani, M. and Arian, M. (2013) An Assessment of Relationship in F-Parameter and Paleostress Fields in Heterogeneous Lithologies: Roudbar Area (Northwest of Iran). Australian Journal of Basic & Applied Sciences, 7, 933-942.
- Poroohan, N., Poukermani, M. and Aryan, M. (2009) An Assessment on Correlations of Seismotectonic Parameters Preceding and Following Roudbar-Manjil Earthquake (Gilan, North of Iran). Australian Journal of Basic & Applied Sciences, 3, 2643-2652.
- Farrokhnia, A.R., Pirasteh, S., Pourkermani, M. and Arian, M. (2011) Geo-Information Technology for Mass Wasting Hazard Zonation: Central-West Alborz-Iran. Disaster Advances, 4, 24-33.
- Khavari, R., Ghorashi, M. and Arian, M. (2009) Assessment of Relative Active Tectonics, South Central Alborz (North Iran). EGU General Assembly Conference Abstracts, 11, 1137.
- Sorbi, A., Arian, M. and Pourkermani, M. (2009) The Movement Potential Evaluation of the Major Quaternary Faults in Tehran Quadrangle. Journal of the Earth, 19, 176-182.
- Feizi, F. and Arian, M. (2006) The Classification of Thrust Fronts in the Alborz-Central Iran Border Zone from the East of Varamin to the East of Semnan. Journal of Sciences, 16, 75-87.
- Bahiraee, S., Arian, M., Qorashi, M. and Solgi, M. (2005) The Movement Potential Evaluation of the Mosha Fault (the West of Firoozkuh to the Shahrestanak). Geosciences, 24, 123-126.
- Arian, M. and Pourkermani, M. (2004) Structural Significance of North Semnan and Attary Faults in Alborz―Central Iran Border Zone. Journal of Science, 14, 4551-4569.
- Arian, M. and Pourkermani, M. (2005) Cenozoic Diastrophism and Deformational Events in the Southern Flank of Central-East Alborz. Journal of Faculty of Earth sciences, Shahid Beheshti University, 10, 43-51.
- Arian, M., Pourkermani, M., Qorashi, M. and Ghasemi, M.R. (2003) North Semnan Fault System and Its Role on Basin Division. Proceedings of the 8th symposium of Geological Society of Iran, 2, 11-17. (In Persian)
- Pourkermani, M. and Arian, M. (2001) Structural Geomorphology of Northeastern Kurdistan. Journal of Humanities, 7, 37-48.
- Mardani, Z., Ghorashi, M. and Arian, M. (2011) Geomorphic Signatures of Active Tectonics in the Talaghan Rud, Shah Rud and Sefidrud Drainage Basins in Central Alborz, Niran. Geosciences, 20, 159-166.
- Sorbi, A., Arian, M. and Pourkermani, M. (2011) The Application of Geomorphic Indices to the Assessment of Relative Tectonic Activity Levels in Tehran Quadrangle. Journal of the Earth, 6, 1-9.
- Khavari, R., Ghorashi, M., Arian, M. and Khosrotehrani, K. (2010) Geomorphic Signatures of Active Tectonics in the Karaj Drainage Basin in South Central Alborz, N Iran. Geosciences, 19, 67-74.
- Javadi Mousavi, E. and Arian, M. (2015) Tectonic Geomorphology of Atrak River, NE Iran. Open Journal of Geology, 5, 106-114. http://dx.doi.org/10.4236/ojg.2015.53010
- Nouri, R., Jafari, M.R., Arian, M., Feizi, F. and Afzal, P. (2013) Correlation between Cu Mineralization and Major Faults Using Multifractal Modelling in the Tarom Area (NW Iran). Geologica Carpathica, 64, 409-416. http://dx.doi.org/10.2478/geoca-2013-0028
- Nouri, R., Jafari, M.R., Arian, M., Feizi, F. and Afzal, P. (2013) Prospection for Copper Mineralization with Contribution of Remote Sensing, Geochemical and Mineralographical Data in Abhar 1:100,000 Sheet, NW Iran. Archives of Mining Sciences, 58, 1071-1084. http://dx.doi.org/10.2478/amsc-2013-0074
- Nouri, R., Afzal, P., Arian, M., Jafari, M. and Feizi, F. (2013) Reconnaissance of Copper and Gold Mineralization Using Analytical Hierarchy Process in the Rudbar 1: 100,000 Map Sheet, Northwest Iran. Journal of Mining and Metallurgy, 49, 9-19.
- Arian, M. and Nouri, R. (2015) Lineament Tectonics and Mineralizatin in Tarom Area, North Iran. Open Journal of Geology, 5, 115-124. http://dx.doi.org/10.4236/ojg.2015.53011
- Feizi, F. and Arian, M. (2011) The Role of Structural Controllers in Geneses of Copper Deposits in 1:50000 Map of Saiin Qaleh. Journal of Sciences, 21, 1-10.
- Bagha, N., Ghorashi, M., Arian, M., Pourkermani, M. and Solgi, A. (2015) Neotectonic Analysis of Mosha-North Tehran Fault Zone, Based on Morphotectonic Features, Central Alborz, Northern Iran. Geosciences, 24, 41-52
- Arian, M. and Maleki, R. (2008) Neotectonics. Farazamin Research Center, Tehran, 150.
- Pourkermani, M. and Arian, M. (1998) Seismicity of Iran. Shahid Beheshti University Press, Tehran, 212.
- Pourkermani, M. and Arian, M. (1997) Seismotectonics. Dez Ab Consulting Engineers Company Press, Tehran, 270.
- Arian, M. and Pourkermani, M. (2001) Rivers Morphology and Active Tectonic (Reviewing the Current Status of Ghezel Ozon River in the Province of Zanjan). 5th Annual Conference of Geological Society of Iran, Tehran, 556.
- Arian, M., Toudeshki, V.H. and Noroozpour, H. (2011) Active Tectonics of Qezel Ozan River Basin, NW Iran. Journal of Applied Environmental and Biological Sciences, 1, 291-295.
- Housini Toudeshki, V., Pourkermani, M., Arian, M. and Khosrotehrani, K.H. (2011) Influence of Structures on the Ghezel Ozan River. Geosciences, 21, 55-60.
- Housini Toudeshki, V. and Arian, M. (2011) Morphotectonic Analysis in the Ghezel Ozan River Basin, NW Iran. Journal of Geography and Geology, 3, 258-260. http://dx.doi.org/10.5539/jgg.v3n1p258
- Alizadeh, H., Arian, M., Lotfi, M., Ghorashi, M. and Ghorbani, M. (2015) Determination of Porphyry Copper Deposit Locations Using Photo Lineament Factor in Northern Parts of the Dehaj-Sardoiyeh Belt. Geosciences, 24, 247-252.
- Arian, M., Pourkermani, M., Sistanipour, A. and Noroozpour, H. (2011) Kinematic Significance of Fold- and Fault-Related Fracture Systems in the Rafsanjan’s Northeast Highlands (Central Iran). Journal of Basic and Applied Scientific Research, 1, 3398-3406.
- Arian, M., Pourkermani, M., Sistanipour, A. and Noroozpour, H. (2011) Seismicity and Fault Segmentation of Bafq-Baghin Fault System (Central Iran). Journal of Applied Environmental and Biological Sciences, 1, 382-396.
- Javadi Mosavi, E., Arian, M., Ghorashi, M. and Nazemi, M. (2012) Measurements of Geomorphic Indices in Tabas Area. Journal of the Earth, 7, 213-225.
- Arian, M. (2010) Earthquake-Fault Hazard Investigations in the Kerman Quadrangle. Journal of Sciences, 19, 176-182.
- Brönnimann, P., Zaninetti, L., Bozorgnia, F., Dashti, G.R. and Moshtaghian, A. (1971) Lithostratigraphy and Foraminifera of the Upper Triassic Naiband Formation, Iran. Revue de Micropaléontologie, 14, 7-16.
- Bull, W.B. (2007) Tectonic Geomorphology of Mountains: A New Approach to Paleoseismology. Blackwell, Malden. http://dx.doi.org/10.1002/9780470692318
- Hack, J.T. (1973) Stream-Profiles Analysis and Stream-Gradient Index. Journal of Research of the US Geological Survey, 1, 421-429.
NOTES

*Corresponding author.