World Journal of Nuclear Science and Technology
Vol.3 No.3(2013), Article ID:34285,5 pages DOI:10.4236/wjnst.2013.33016
Mössbauer, X-Ray and Magnetic Studies of Black Sand from the Italian Mediterranean Sea
1Albert Einstein Center for Fundamental Physics (AEC), Laboratory for High Energy Physics (LHEP), University of Bern, Bern, Switzerland
2Department of Chemistry and Biochemistry, University of Bern, Bern, Switzerland
Email: *saverio.braccini@lhep.unibe.ch
Copyright © 2013 Saverio Braccini et al. This is an open access article distributed under the Creative Commons Attribution License, which permits unrestricted use, distribution, and reproduction in any medium, provided the original work is properly cited.
Received March 14, 2013; revised April 15, 2013; accepted April 26, 2013
Keywords: Mössbauer spectroscopy; X-Ray diffraction (XRD); energy dispersive X-Ray spectroscopy (EDS); magnetic sands; iron minerals
ABSTRACT
The study of natural magnetic sands is instrumental to investigate the geological aspects of their formation and of the origin of their territory. In particular, Mössbauer spectroscopy provides unique information on their iron content and on the oxidation state of iron in their mineral composition. The Italian coast on the Mediterranean Sea near Rome is known for the presence of highly magnetic black sands of volcanic origin. A study of the room temperature Mössbauer spectrum, powder X-ray diffraction, energy dispersive X-ray spectroscopy, and magnetic measurements of a sample of black magnetic sand collected on the seashore of the town of Ladispoli is performed. This study reveals magnetite as main constituent with iron in both tetrahedral and octahedral sites. Minor constituents are the iron minerals hematite and ilmenite, the iron containing minerals diopsite, gossular, and allanite, as well as ubiquitous sanidine, quartz, and calcite.
1. Introduction
Natural magnetic sands are common in areas of volcanic origin and are composed of several minerals containing iron in different oxidation states. The precise knowledge of the mineral composition is important to investigate their formation mechanisms and the geology of the territory where they are present.
The study of the mineral composition is usually performed by means of different and often complementary methods such as microscopical, X-ray, chemical and spectrographic analyses. For substances containing iron, Mössbauer spectroscopy represents the most precise and predictive method [1]. This is the case of magnetic sands, as reported in studies of sands from the Black Sea [2] and from Costa Rica [3]. Several studies have been published on Mössbauer spectroscopy of volcanic soils (see for ex. [4-7]). Mössbauer spectra have been intensively studied for many iron rich minerals and reference data are available.
The coasts of the Mediterranean Sea are rich of areas of volcanic origin and account for several volcanoes still active nowadays. The Italian region in the proximity of Rome is characterized by several lakes of volcanic origin and by the presence of black magnetic sand on the seashore. In particular, the town of Ladispoli is known for its characteristic black beaches. It is situated on the Mediterranean Sea, 30 km south of Rome and 20 km southwest of the lake of Bracciano.
In this paper, the study of the room temperature Mössbauer spectrum and the magnetism of a sample of black magnetic sand from Ladispoli is presented. The composition of the sand was determined by powder X-ray diffraction (XRD) and energy dispersive X-ray spectroscopy (EDS). The search for traces of radioactive nuclides was also performed.
2. Materials and Methods
A sample of black magnetic sand was collected on the northern sea shore of Ladispoli, near the medieval ruins of Torre Flavia. The sand is composed of regular smooth edged grains with dimensions around 200 µm. The material is highly magnetic, as shown in Figure 1. For the XRD and EDS analyses, magnetic grains were separated by a strong permanent magnet. The magnetic part accounts for 87.4% of the weight, as was determined from a sample of 5 g total mass. The grains of the non-magnetic part were further separated under an optical microscope. Images of magnetic and non-magnetic grains as well as the various constituents are shown in Figure 2.
In order to perform the Mössbauer analysis, a sample has been prepared by depositing one layer of natural grains on a thin circular plastic support of 25 mm diameter. A Mössbauer spectrometer (Fast Com Tec MA-250) equipped with a 5 mCi 57Co source in Rh matrix has been employed. A proportional tube filled with 97% Kr and 3% CO2 at 1 atm pressure and a Be side thin window (LND 45431) was used to detect the 14.4 keV characteristic Mössbauer line. The signals from the detector and from the velocity transducer were digitized and collected by a 1024 channel Multi Channel Analyzer (MCA). More than 105 events per channel have been collected to reduce the statistical uncertainty at a level of less then
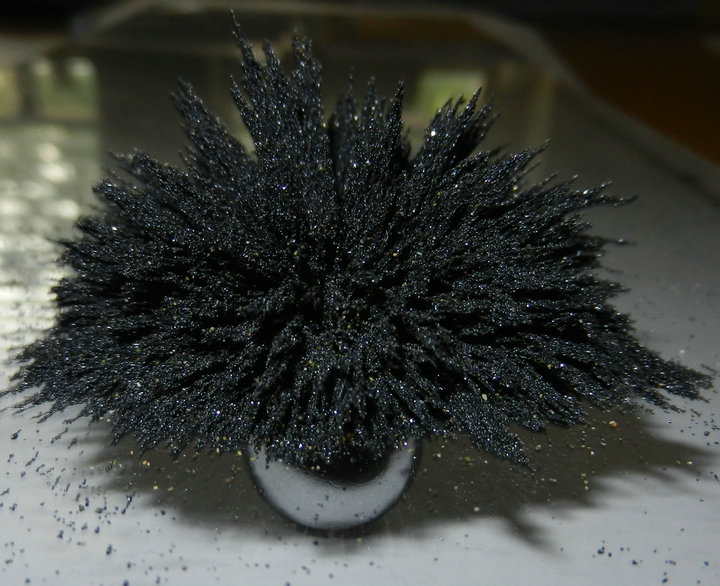
Figure 1. A sample of black magnetic sand from Ladispoli under the action of the magnetic field produced by a spherical permanent magnet located underneath.
3 × 10⁻³ on each channel. The velocity range of the transducer was set to ±10.8 mm/s. During the measurement, the temperature of the room was kept at 20˚C. From the raw data, the transmission spectrum has been obtained and analyzed by means of best fit procedures performed using the Fit; o) program [8].
X-ray investigations were made on a STADIP powder diffractometer (STOE, Darmstadt, Germany) using Cu Ka1 radiation and a position sensitive linear detector with 0.01˚ resolution and 6˚ width. Measurements were done either in reflection (Bragg-Brentano geometry) or transmission (Debye-Scherrer geometry) with samples on a rotating plate powder holder or in a glass capillary, respectively. Data were analyzed by the WinXPow (STOE) and Fullprof [9] software packages.
EDS analyses were made using a liquid nitrogen cooled Si (Li) detector (Noran SIX NSS300) attached to a scanning electron microscope (SEM) (Hitachi S-3000 N). Magnetic measurements were performed with a MPMS-5XL SQUID magnetometer (Quantum design).
To search for the presence of radioactive elements, a sample of non-magnetically separated black sand was measured with a hyper-pure germanium detector (HPGe) for 20 hours in a low background laboratory.
3. Experimental Results
The Mössbauer transmission spectrum is shown in Figure 3 and presents nine distinct minima and a more complicated structure in the central region.
This spectrum is similar to the ones reported in Refs. [2,3]. To analyze the spectrum, fits have been performed starting from the simplest hypothesis of two sextets. The results of this fit are reported in Table 1 (fit 1). For the
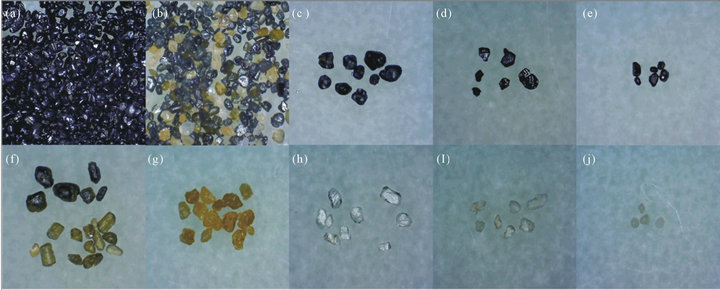
Figure 2. Microscope images of the magnetic part (a) which consists of magnetite and the non-magnetic part (b). The constituents of the non-magnetic part are hematite (c), ilmenite (d), allanite (e), diopsite (f), grossular (g), sanidine (h), α-quartz (i), and calcite (j).
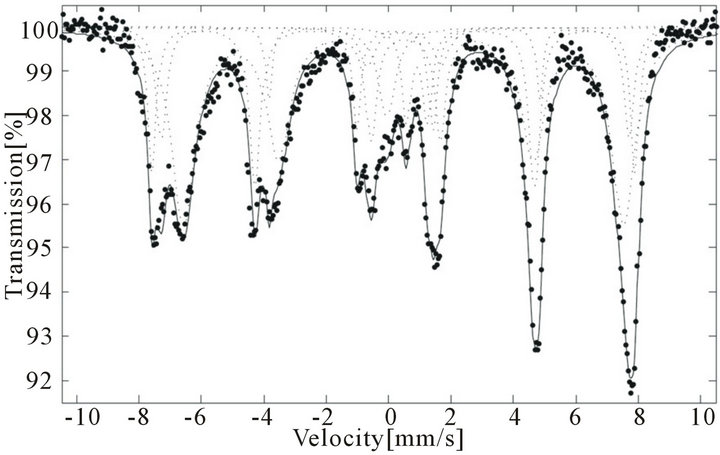
Figure 3. The transmission spectrum together with the second fit (fit 2), shown as a solid line. The dotted lines correspond to three sextets, one doublet and one singlet used to fit the spectrum.
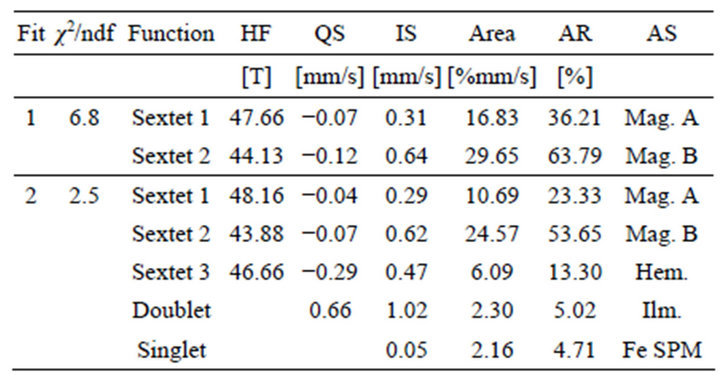
Table 1. Mössbauer parameters of the two fits performed on the transmission spectrum. HF: hyperfine splitting magnetic field, QS: quadrupole splitting, IS: isomeric shift, AR: area ratio, AS: assignment, Mag. A: magnetite with iron on tetrahedral sites, Mag. B: magnetite with iron on octahedral sites, Hem.: hematite, Ilm.: ilmenite, Fe SPM: iron in superparamagnetic phase.
isomeric shift (IS) the data are referred to a-Fe taken as zero. The two sextets can be interpreted as the presence of magnetite in both tetrahedral (magnetite A) and octahedral (magnetite B) sites, in good agreement with the previously published results.
As indicated by the c2 value, the fit with only two sextets is not optimal. In particular, a significant discrepancy is observed in the central region, corresponding to small values of the velocity. This suggests the presence of other minerals containing iron in the sample. A more sophisticated function was therefore searched for in order to better fit the data and to extract further information on the mineral composition of the sample.
The function that best reproduced the data is composed by three sextets, one doublet and one singlet and is shown in Figure 3.The corresponding results (fit 2) are reported in Table 1. Also in this fit, the two sextets of larger area can be interpreted as the presence of magnetite in both tetrahedral (magnetite A) and octahedral (magnetite B) sites, in good agreement with the previous fit 1. Based on previously published results [10,11] and on the data base present in the Fit; o) program [8], the third sextet can be interpreted as due to hematite, a mineral very often present in volcanic soils. The fit indicates also the presence of small fractions of two other minerals. The doublet can be interpreted as due to ilmenite and the singlet to iron in super paramagnetic phase.
In order to support the results from the Mössbauer study, further analyses of the sample composition were done by XRD and EDS. A powder XRD diagram of the magnetic part is shown in Figure 4. It proves magnetite as main constituent. The sample is almost phase pure with few small additional peaks due to a slightly incomplete magnetic separation. An EDS spectrum of a magnetite grain is shown in Figure 5. It reveals a partial substitution of iron by titanium (~6%) and manganese (~2%), as determined from an average over five measurements on different grains. The non-magnetic part contributes about 12.6% of the weight to the sand. Pictures of the
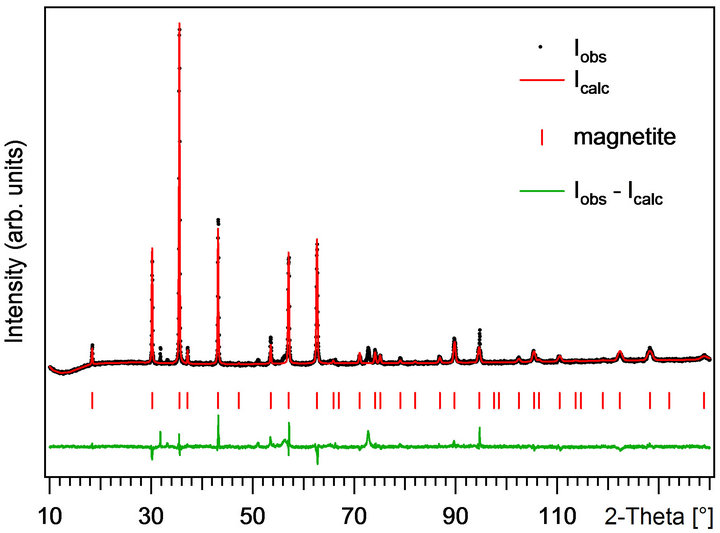
Figure 4. Powder XRD diagram of the magnetic part of the black sand. The Rietveld refinement confirms magnetite as main constituent.
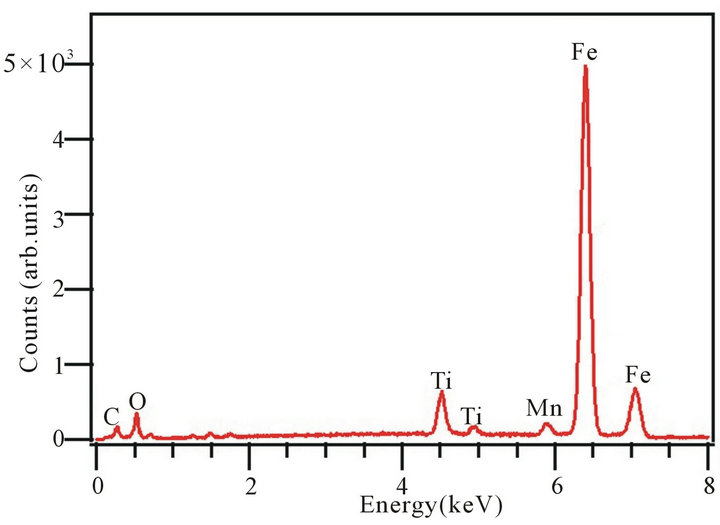
Figure 5. EDS spectrum of a magnetite grain with a partial substitution of Fe by Ti (~6%) and Mn (~2%).
mixture and the individual constituents are shown in Figure 2. It consists of iron minerals, iron containing minerals, and ubiquitous minerals such as sanidine, α-quartz, and calcite. Grains of the different constituents were separated under a microscope and investigated by XRD and EDS.
A powder XRD pattern of the non-magnetic part is shown in Figure 6 together with a pattern matching fit. The relative composition of the non-magnetic part was estimated from Rietveld fits of eight previously identified phases to the XRD pattern. The results are summarized in Table 2. The iron minerals hematite, Fe2O3, and ilmenite, FeTiO3, contribute about 17% and 9%, respecttively. Hematite appears as black porous grains, cf. Figure 2(c). It contains the same admixture of Ti and Mn as the magnetite and can be regarded as an oxidation product thereof. Ilmenite forms black grains with shiny faces,
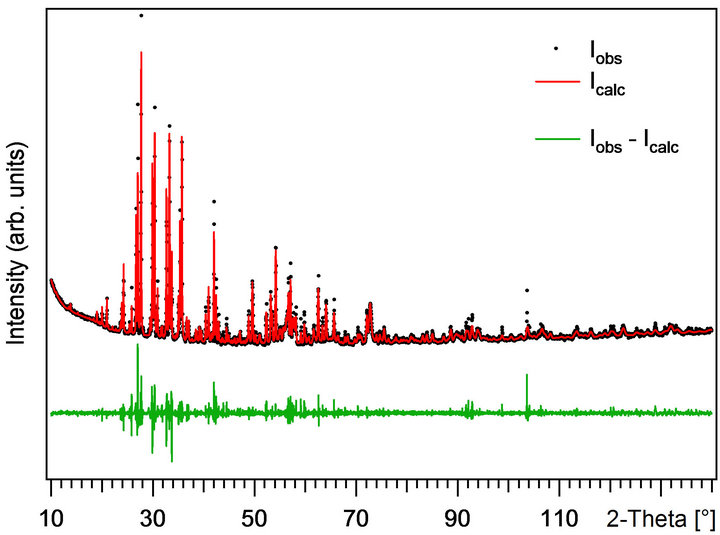
Figure 6. Powder XRD diagram of the non-magnetic part of the black sand. A pattern fitting (red line) shows the total contribution from eight phases. The composition of the nonmagnetic part was determined from Rietveld fits. The results are summarized in Table 2.
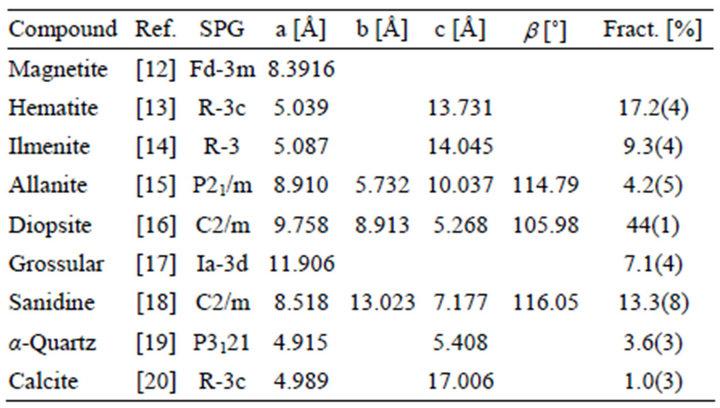
Table 2. Mineral composition of the black sand from magnetic separation and powder XRD. The magnetic part is magnetite (87.4% of the weight). The composition of the non-magnetic part (12.6% of the weight) and the lattice parameters were determined from Rietveld fits. SPG: space group.
cf. Figure 2(d). Further minerals that contain significant amounts of iron localized on Ca, Mg, or Al sites are allanite, diopsite, and grossular. Allanite forms transparent dark red-brown crystals, cf. Figure 2(e), and is a complex mineral from the epidote family. Its formula is (Ca(Ca/RE)) ((Al/Fe)2Al) (SiO4) (Si2O7) O(OH) and Fe replaces about 45% of the Al on the octahedral sites according to EDS measurements. Interestingly, the allanite contains light rare earth elements (RE) such as La, Ce, and Nd, which replace about 1/3 of the Ca. Also diopsite and grossular contain some iron which gives rise to their colors, cf. Figures 2(f) and 2(g). With 44% the diopsite makes up for almost half of the non-magnetic sand. An iron containing diopsite, MgCaSi2O6, where Fe partially substitutes Mg and Ca, is often referred to as augite. With increasing Fe content, the colors of the grains vary from yellow-green to almost black. The grossular, Ca3 Al2(SiO4)3, belongs to the garnet family. According to EDS measurements about 1/3 of the Al is substituted by Fe. The further minerals contain only some traces of Fe as impurities. Sanidine, cf. Figure 2(h), forms colorless lustrous crystals which are easily recognized in the sand and contribute about 13% to the non-magnetic part. It is a potassium feldspar, KAlSi3O8, with a small sodium content. Further minor constituents are α-quartz, cf. Figure 2(i), and rounded pieces of calcite, cf. Figure 2(j), with about 4% and 1%, respectively.
For the magnetic characterization, the magnetization of a 11.91 mg sample from the magnetic part was measured at 2 K, see Figure 7. It shows a small hysteresis of 200 Oe, a saturation in magnetic fields above 2000 Oe, and a saturation magnetization of 58.2 cm3Oe/g. In good agreement with published data on magnetite [21], the sample is a soft ferromagnet.
Traces of radioactive elements were searched for on a
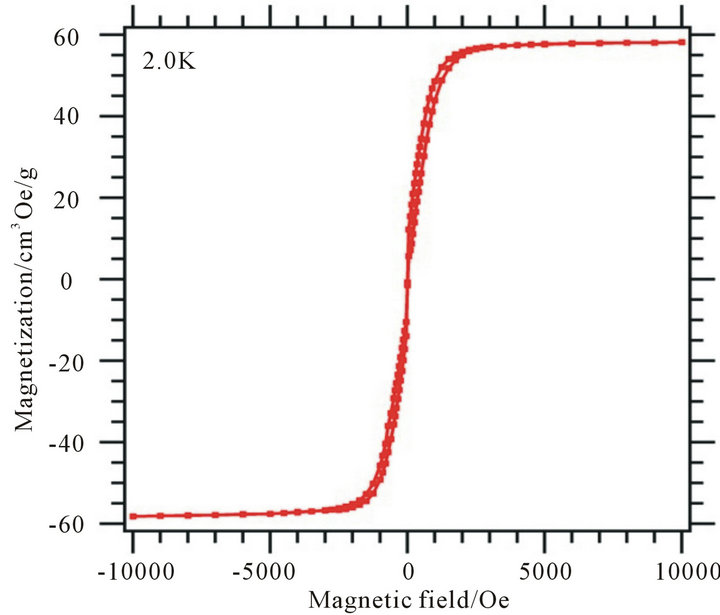
Figure 7. Magnetization measurement at 2 K of a sample from the magnetic part of the black sand.
sample of non-magnetically separated black sand. Naturally occurring radio nuclides of terrestrial origin coming from the 226Ra (46 ± 3 Bq/kg) and 232Th (32 ± 2 Bq/kg) decay chains were found together with 235U (4 ± 2 Bq/kg) and 238U (53 ± 15 Bq/kg). These results are compatible with average natural radioactivity measured in European soils [22].
4. Conclusion
A sample of magnetic black sand from the town of Ladispoli in the Italian Mediterranean Sea has been studied by means of Mössbauer spectroscopy, XRD, EDS, and magnetization measurements. The Mössbauer absorption spectrum presents a complex structure, which has been analyzed by means of best fit procedures. The sand is composed in a large fraction of magnetite with iron in both tetrahedral and octahedral sites. The central region of the spectrum clearly reveals the presence of other minerals. From the fits, the presence of hematite together with small fractions of ilmenite and iron in a super paramagnetic phase can be inferred. A detailed study of the magnetic and non-magnetic part was performed by XRD and EDS. Magnetic measurements and the search for radioactive elements were also performed. These investigations confirm the composition of the black sand with magnetite as main constituent as well as the presence of hematite and ilmenite. Furthermore, diopsite, grossular, and allanite were found which contain Fe on Al, Mg, and Ca sites.
REFERENCES
- E. Murad and J. Cashion, “Mössbauer Spectroscopy of Environmental Materials and Their Industrial Utilization,” Kluwer Academic Publishers, Dordrecht, 2004.
- T. M. Peev, et al., “Mössbauer and X-ray Study of Natural Magnetite Sands,” Journal of Radioanalytical and Nuclear Chemistry, Vol. 190, No. 2, 1995, pp. 357-361. doi:10.1007/BF02040012
- E. Cruz-Sánchez, et al., “Study of Titanomagnetite Sands from Costa Rica,” Journal of Alloys and Compounds, Vol. 369, No. 1-2, 2004, pp. 265-268. doi:10.1016/j.jallcom.2003.09.064
- C. Pizarro, et al., “Some Cautions on the Interpretation of Mössbauer Spectra in Mineralogical Studies of Volcanics Soils,” Boletín de la Sociedad Chilena de Química, Vol. 45, No. 2, 2000, pp. 1-8. doi:10.4067/S0366-16442000000200011
- G. Longworth, et al., “Mössbauer Effect and Magnetic Studies of Secondary Iron Oxides in Soils,” Journal of Soil Science, Vol. 30, No. 1, 1979, pp. 93-110. doi:10.1111/j.1365-2389.1979.tb00968.x
- M. J. Singer, et al., “Mössbauer Spectroscopic Evidence for Citrate-Bicarbonate-Dithionite Extraction of Maghemite from Soils,” Clays and Clay Minerals, Vol. 43, No. 1, 1995, pp. 1-7. doi:10.1346/CCMN.1995.0430101
- A. T. Goulart, et al., “Multiple Iron-Rich Spinel Phases and Hematite in a Magnetic Soil Developing on Tuffite,” Physics and Chemistry of Minerals, Vol. 25, No. 1, 1997, pp. 63-69. doi:10.1007/s002690050087
- J. í. Hjøllum and M. Bo Madsen, “Fit;o,)—A Mössbauer Spectrum Fitting Program,” 2009. http://arxiv.org/abs/0912.0449
- J. Rodriguez-Carvajal, “Fullprof: A Program for Rietveld Refinement and Pattern Matching Analysis,” Abstract of the Satellite Meeting on Powder Diffraction of the XV Congress of the IUCr, Toulouse, France, 1990, p. 127.
- N. N. Greenwood and T. C. Gibb, “Mössbauer Spectroscopy,” Chapman and Hall, London, 1971.
- E. Kuzmann, et al., “A critical Review of Analytical Applications of Mössbauer Spectroscopy Illustrated by Mineralogical and Geological Examples,” Pure and Applied Chemistry, Vol. 75, No. 6, 2003, pp. 801-858. doi:10.1351/pac200375060801
- M. E. Fleet, “The Structure of Magnetite: Symmetry of Cubic Spinels,” Journal of Solid State Chemistry, Vol. 62 No. 1, 1986, pp. 75-82. doi:10.1016/0022-4596(86, pp.90218-5
- R. L. Blake, et al., “Refinement of the Hematite Structure,” American Mineralogist, Vol. 51, 1966, pp. 123-129.
- B. A. Wechsler and C. T. Prewitt, “Crystal Structure of Ilmenite (FeTiO3) at High Temperature and High Pressure,” American Mineralogist, Vol. 69, 1984, pp. 176-185.
- P. Orlandi and M. Pasero, “Allanite-(La) from Buca Della Vena Mine, Apuan Alps, Italy, an Epidote-Group Min,” Canadian Mineralogist, Vol. 44, No. 1, 2006, pp. 63-68. doi:10.2113/gscanmin.44.1.63
- J. R. Clark, et al., “Crystal-Chemical Characterization of Clinopyroxenes,” Mineralogical Society of America, Vol. 2, 1969, pp. 31-50.
- S. C. Abrahams and S. Geller, “Refinement of the Structure of Grossularite Garnet,” Acta Crystallographica, Vol. 11, 1958, pp. 437-441. doi:10.1107/S0365110X5800116X
- M. W. Phillips and P. H. Ribbe, “The Structures of Monoclinic Potassium Rich Feldspars,” American Mineralogist, Vol. 58, 1973, pp. 263-270.
- P. H. Wei, “The Structure of Alpha-Quartz,” Zeitschrift für Kristallographie, Vol. 92, 1935, pp. 355-362.
- R. W. G. Wykoff, “The Crystal Structures of Some Carbonates of the Calcite Group,” American Journal of Science, Vol. 50, 1920, pp. 317. doi:10.2475/ajs.s4-50.299.317
- D. Gatteschi, et al., “Exploring the No-Man’s Land between Molecular Nanomagnets and Magnetic Nanoparticles,” Angewandte Chemie International Edition, Vol. 51, No. 20, 2012, pp. 4792-4800. doi:10.1002/anie.201105428
- Sources of Ionizing Radiation, UNSCEAR, “Report to the General Assembly, Scientific Annexes A and B,” 2008. http://www.unscear.org/unscear/en/publications/2008_1.html
NOTES
*Corresponding author.