World Journal of Nuclear Science and Technology
Vol.1 No.3(2011), Article ID:8173,24 pages DOI:10.4236/wjnst.2011.13013
Direct Determination of Radionuclides in the Body Optimisation of Measurements Parameters and Results Analysis
Belgian Nuclear Research Centre, Belgium
*E-mail: jgenicot@szckcen.be
Received June 16, 2011; revised August 6, 2011; accepted September 12, 2011
Keywords: WBC, in vivo Counting, Internal Dosimetry, Internal Contamination
Abstract
Whole body counting (WBC) benefits from new types of detectors and methodologies. It has found applications in areas such as in medicine, protection of workers and of population. The design of a WBC facility should be tailored to the type of application. Monte Carlo calculations help to improve the reliability of the calibration of a facility, particularly for non-standard measurements (child, etc.), help in optimizing shielding of counting rooms, preventing large systematic errors and lowering detection limits. In vivo counting may be used to evaluate the distribution of radionuclides in organs for metabolic studies with multiple detectors or with a scan of the body. Reduction of detection levels by background reduction is limited. Improved sensitivity can be obtained by adapting the detector type and size to the measured photon energy. The benefit of comparison exercises and training courses are demonstrated. Further improvements in accuracy can be expected from cooperative works with other techniques: indirect methods (urines and faeces) and passive detectors placed correctly on the body can in the case of high levels of contamination can be used to improve the burden assessment.
1. Introduction
The determination of the radioactive burden in a body can be done with the direct methods (in vivo measurements) and with the indirect methods (control of urines, faeces and nose blows). Assessing radioactive body burden by the direct methods requires equipment and techniques to identify and quantify the internal contamination. Results from different working groups have shown that advances in techniques have improved the measurement accuracy and sensitivity with, as a consequence, the widespread of application of in vivo measurements in fields such as nuclear medicine and studies of metabolism. The increasing concern surrounding the absorption of radioactive materials, such as dirty bomb or Naturally Occurring Radioactive materials (NORM) raises the need for increased ability to detect radioactive contaminants in the body.
This report outlines the aspects of measurements which have lead to this improvement and its consequences for the non nuclear industry.
After the intake of radiotoxic substances, whole body counting and organ counting are good techniques to quantify the contamination of a person. In 2003, the International Commission on Radiation Units and Measurements published Report 69 “Direct Determination of the Body Content of Radionuclides” [1] intended for scientists, teams or organizations responsible for installation and/or operation of a whole body counting facility. Quantities and units are defined in reports 51 [2] and 60 [3] of the International Commission on Radiation Units and Measurements. ICRU 46 [4] and ICRU 47 [5] provide tables of numerical values of relevant quantities and conversion coefficients. Information on phantoms are given in ICRU 48 [6]. Finally, ICRU Report 76 [7] provides information and guidance for quality assurance in dosimetry. These reports can be helpful in the design of a WBC facility and of a measurement protocol.
2. Results from International Working Groups
Various international working groups have worked to improve the use of direct measurement methods and the interpretation of results and to define procedures implementing quality assurance. Each group, with specific purposes and methods had the common goal to improve assessment of internal contamination in terms of accuracy and localization of the burden. Three working groups were supported by the European Commission:
OMINEX (Optimization of Monitoring for Internal Exposure) provides guidance on design of internal dose monitoring programmes to optimize the available resources: monitoring methods, measurement techniques, monitoring intervals to optimize the accuracy and to minimize the detection limits especially, for alpha-emitting radionuclides. New detector technologies and calibration methods were examined. The project concerned the counting of low-energy emitters (241Am, 210Pb, 238U, 235U, 238Pu and 239,240Pu via 17 keV Pu X rays) in organs. OMINEX organized a training course in Paris summarizing the lessons learned from its work [8].
IDEAS (Internal Dose Equivalent Assessment) analyses several international comparison exercises to compile a database on cases of internal contamination. It examined special cases on acute inhalation of 60Co, 90Sr and plutonium [9]. The results demonstrated discrepancies with several orders of magnitude. A conclusion was the need to develop guidelines for dose evaluation procedures and promote harmonization of assessments between organizations for professionals.
IDEA (Internal Dosimetry-Enhancements in Application) [10] aimed to improve the accuracy of internal exposure monitoring with better in vivo and bioassay techniques. The room-temperature semiconductors (Silicon and CdZnTe) are identified as promising detectors for low-energy photons. Optimization of crystal dimensions and of geometry of germanium crystal was investigated to reduce background and increase efficiency and sensitivity. Quality assurance operational procedures were also considered.
3. Technical Issues and Developments
3.1. Detector Efficiency and Limit of Detection in Case of Low Energy Photons
The efficiency of a detector system for a specific radionuclide, η, is the number of counts collected per unit time and unit activity, expressed in s–1 Bq–1. This efficiency is sometimes defined as nuclide specific efficiency.
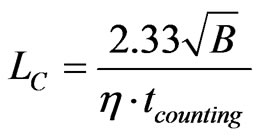
The limit of detection (Bq) is the lowest activity of a radionuclide that can be measured. Operationally, it leads to two concepts: the a priori “detection limit” LD and the a posteriori “critical level” LC [11]. The a priori detection limit, LD, made before counting the person, determines the minimum acquisition time needed to detect a given activity of a radionuclide [12,13]. The a posteriori critical level LC (or decision level), calculated after counting, evaluates the highest limit of the activity of a radionuclide that has not been clearly detected in a photopeak zone.
For a given counting time (tcounting) LC and LD (Bq) depend on two parameters: the detector efficiency (η) and the background value B (counts):
 and
and 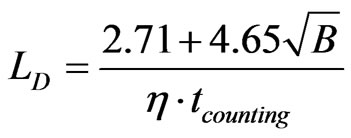 (1)
(1)
As an example, for 137Cs, if no photopeak above background is detected in a spectrum (with η = 10–3 s–1.Bq–1, B = 20 counts, tcounting = 2000 s), LD = 12 Bq and LC = 5. The 137Cs burden in the body, if present, is less than 5 Bq. These calculations are made on the basis of measurements with a 1σ confidence level.
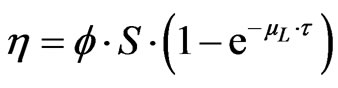
The efficiency can be approximated by an exponential function of the detector thickness τ (expressed in m):
 (2)
(2)
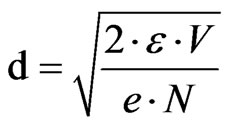
where φ is a proportionality coefficient (s–1.Bq–1.m–2), S is the detector area (m2) and µL is the linear absorption coefficient (m–1). This formula shows that an asymptotical value of the efficiency appears when the thickness increases. This has been verified experimentally (Figure 1) [14]: the bias voltage of a 20-mm thick HPGe detector has been reduced from the recommended 3500 V to 0 V during the measurement on the gamma photons emitted by a 241Am source (59.5 keV). The measured peak area remains constant until 300V. Below this value the efficiency decreases to 0. The bias voltage modifies the depleted thickness according to:
 (3)
(3)
where d = thickness of the depleted zone (m), ε = the dielectric constant of semiconductor (F·m–1), e = the electric charge (C), N = dopant concentration (m–3), V = Detector bias voltage (V).
This effect has been confirmed by Monte Carlo simulations. For these calculations (Figure 2), a BOMAB phantom is simulated with a 241Am source homogeneously diluted [15]. The HPGe detector, with an increasing thickness, is placed 10 cm above the torso. If the detector is laterally shielded, a saturation of the efficiency is reached with a thickness of about 5 mm. If the detector is not laterally shielded, the efficiency continues to increase slowly because of a side effect. This is not the case in the experimental result presented in Figure 1 obtained with a point source placed in the axis of the detector crystal where no side effect appears. The same calculations with a 137Cs source [15] show saturation for higher thicknesses of the detector in a steel casing (Figure 3). A silicon PIN diode,

Figure 1. Measured effect of the detector bias voltage on the photopeak area Detector used: HPGe, 20 mm thick, 50 mm diameter. Radioactive source: 241Am point source [14].
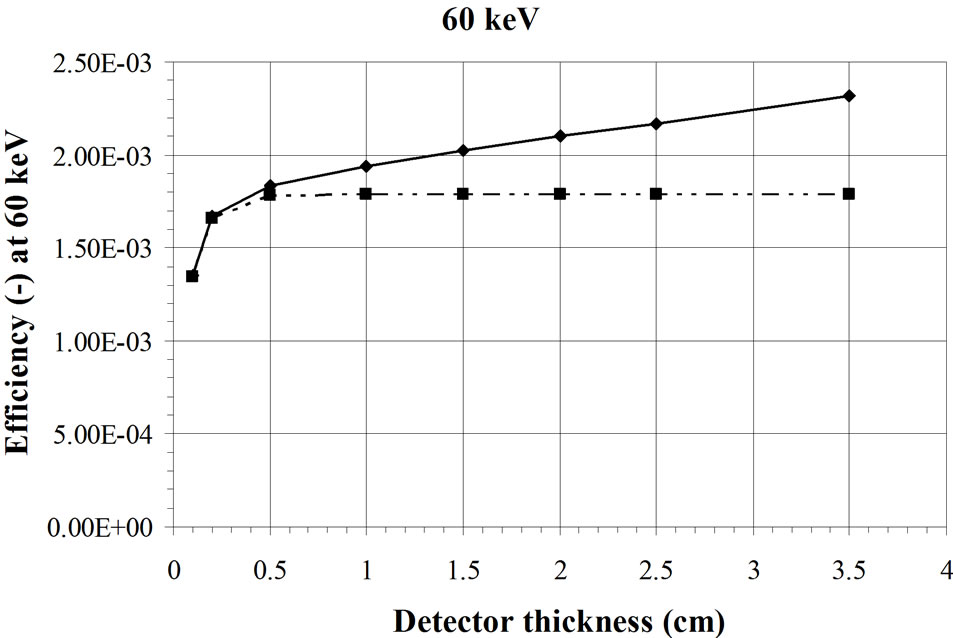
Figure 2. Calculated effect of the detector thickness on the efficiency for measurement of a 241Am source fully distributed in a BOMAB phantom. The mix curve represents the detectors in a casing [15].
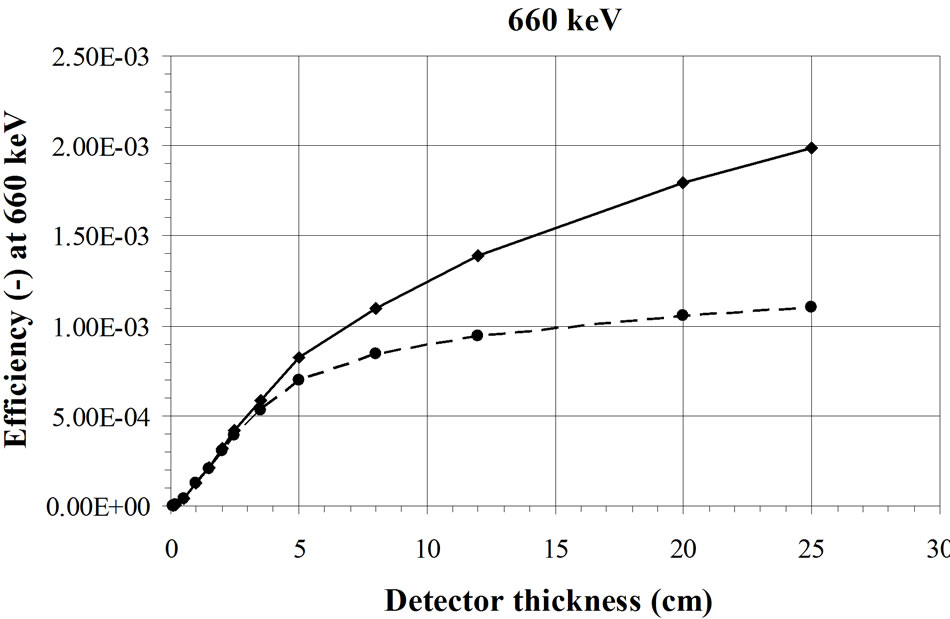
Figure 3. Calculated effect of the detector thickness on the efficiency for measurement of a 137Cs source fully distributed in a BOMAB phantom. The dashed line represents a detectors in a steel casing [15].
with an intrinsic zone of 500 µm, can detect low energy γ-rays in the photovoltaic mode (without bias voltage) and shows a small photopeak at the same position in the energy spectrum than with a bias voltage.
The experiments and the calculations show that, in the low energy region, the efficiency of a detector saturates rapidly. The background on the other hand, grows proportionally with the volume of the detector. This proportionality of B with the detector volume, in the low energy zone (below 300 keV) has been measured in the continuum of different detectors and compared to the active volume of the detector. A volume ratio of two HPGe detectors VI/VII = 1.31 presents a ratio of the background area of SI/SII = 1.31 (σ = 0.038). These backgrounds are measured in zones of the spectrum free of photopeak. Figure 4 shows the spectra collected with the two HPGe detectors considered here [14]. For two silicon diodes (500 µm and 200 µm thick), VI/VII = 2.01 and SI/SII =2.1 (σ = 0.038). For two NaI(Tl) detectors (a 30 cm × 10 cm and a 20 cm × 10 cm), VI/VII = 2.25 and SI/SII = 2.2 to 2.5, a value depending on which portion of the spectrum is analysed. Each experiment was made under the same background conditions.
The graphic on the left of Figure 5 summarizes this
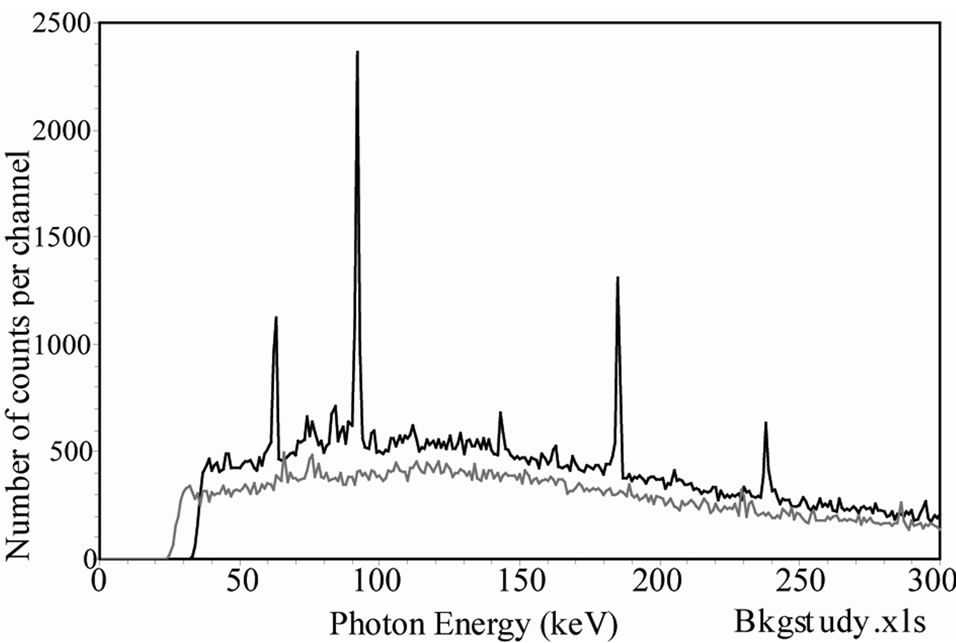

Figure 4. Comparison of background spectra measured with two different HPGe detectors in the same measurement condition. The top curve shows the energy zone 0 - 300 keV and the bottom curve the full range 0 - 2000 keV [14].


Figure 5. Evolution of efficiency and background of a detector with increasing thickness. Evolution of the critical level LC for the measurement of the 60 keV photons when the thickness of a HPGe detector is increased. For this detector, the best LC is obtained for 1.2 mm thickness.
effect: the efficiency increases with the thickness of the detector, until saturation. The continuum part of the background increases linearly with the detector thickness (straight line). For extremely large detectors, the background should saturate also by self-shielding but this case is out of the scope here. The problem is to find the optimum thickness for the lowest critical level, LC. Numerical calculations with actual absorption coefficients are required.
In the search for the lowest LC, we may assume that the background is proportional to the thickness τ if the detector area S is kept constant:
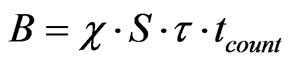 (4)
(4)
where χ (m–3·s–1) is a proportionality coefficient.
The thickness of the detector, τ, can be optimized to minimise LC:
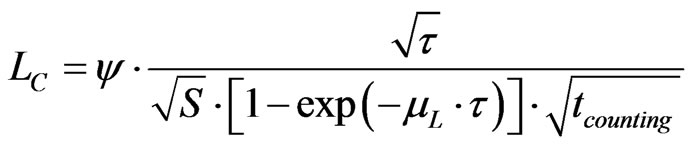 (5)
(5)
where: S is the detector area in m2, τ is the detector thickness in m, µL is the linear absorption coefficient in m–1, ψ (Bq. m1/2·s1/2) is a coefficient characterising the material of the detector at the considered energy and includes the factor 2.33 mentioned in the definition of LC.
The relation is simplified for a same counting time and a same detector area:
 (6)
(6)
where ω (Bq. m–1/2) includes all the constant parameters, not relevant here.
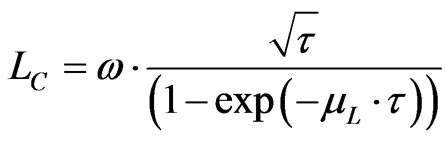
Germanium detectors (HPGe) with a linear absorption coefficient of 1.07·103 m–1 at 60 keV (241Am) has an optimum thickness at 1.2 mm (right side in Figure 5).
Figure 6 presents the evolution of LC with the photon energy for silicon at 60 keV and for NaI (Tl) at 20 and 60 keV [14]. The optimal thickness to measure the 60 keV photons with a silicon detector is 13.3 mm.
In practice, detectors of different types and sizes are needed depending on the applications. Some detectors like the HPGe are currently manufactured in standard dimensions so that special configurations are difficult to obtain. In contrast, thin silicon diodes are easier to purchase. And several companies are building silicon detectors of different thicknesses. This paper shows that it is theoretically possible to select the best detector thickness for a specific application even if most of the time, a compromise is required for different applications in a WBC laboratory. Also, when several small detectors are used instead of a single large detector, the detection limit can be reduced, after counting, by discarding the signals from the detectors distant from the contaminated region and thus not able to collect relevant information about
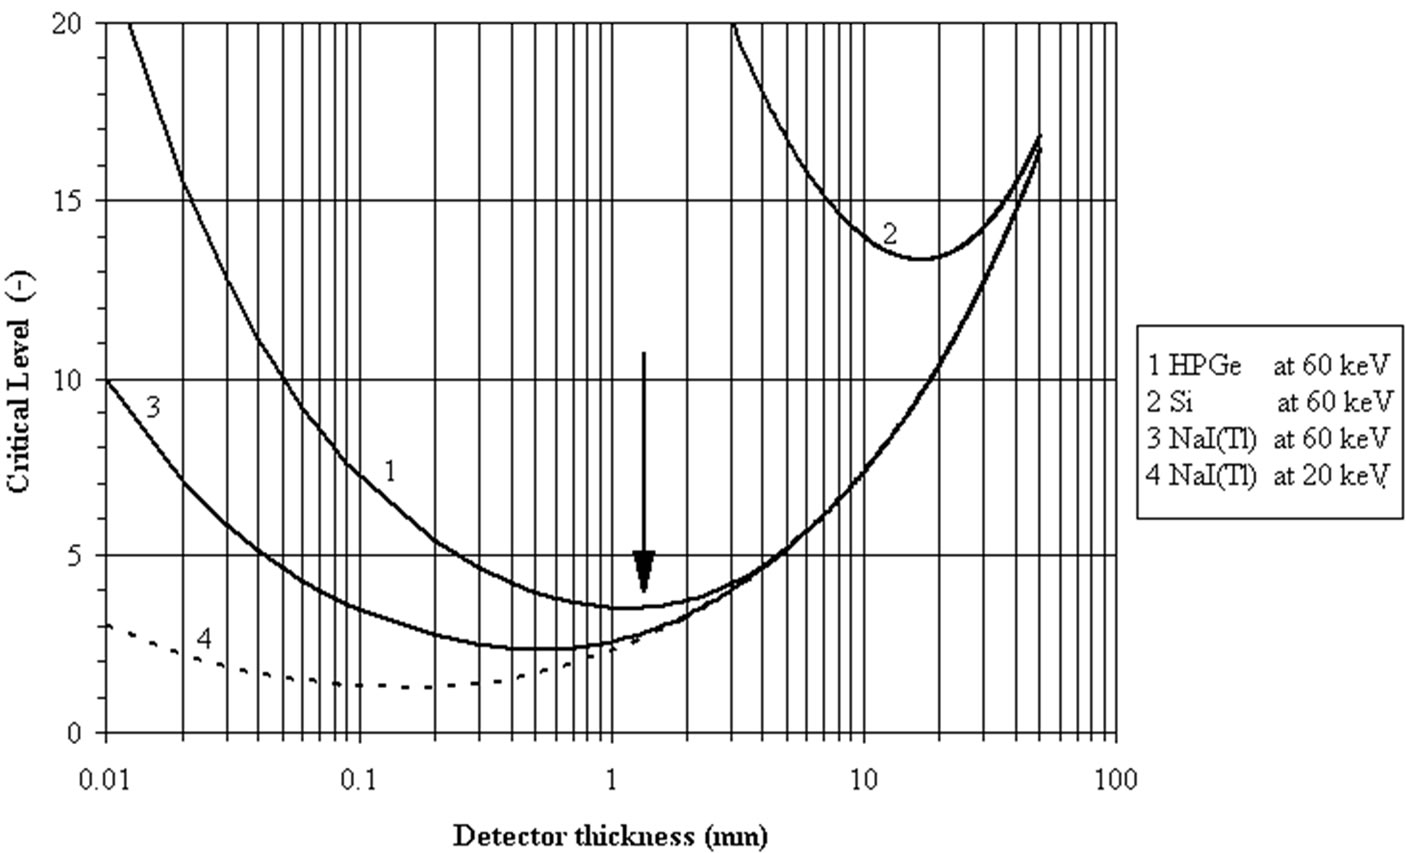
Figure 6. Dependence of critical level LC (Bq) on detector thickness (mm). The optimal thickness of a detector can be found from this graphic to minimize the critical level at a given energy of the measured photon. The Fig. shows the evolution of the LC (in Bq) versus the detector thickness for HPGe and Silicon at 60 keV and for NaI(Tl) at 60 keV and 20 keV [8,14]. To measure the 60 keV from 241Am, the optimum thicknesses are 1.2 mm for HPGe, 15 mm for silicon and 0.6 mm for NaI(Tl).
the nuclide burden [16,17]. These tailored detectors can, in certain cases, be associated with other detection devices to work in anti-coincidence to reduce again the detection limits. But if the detector is not tailored (too thick for the examined energy) the anti-coincidence detector will not work. This is the case when a 20 mm thick HPGe detector is used with anticoincidence detectors for the measurement of 241Am.
3.2. Shielded Room for the Measurements of Internal Contamination
Room shielding is used to reduce the effect of background radiations on the quality of the spectrum. This background is due to natural radionuclides in the surroundings and to cosmic radiation. The secondary cosmic radiation (muons, neutrons, electrons, protons and pions) interact with the shielding material and generate neutrons and radionuclides (26Al, 36Cl, 10B and 7Be). Some of these nuclides (mainly 7Be) can modify the spectrum. Natural radionuclides, especially radon, found in ground and in dwellings also contribute to the background. Well designed room shielding can reduce the background by a factor between 102 and 103 (in terms of counts in the energy range between 100 keV and 2 MeV). The utility of the shielding depends on the purpose of the measurements carried out in the room (i.e. required limit of detection). Background can be reduced by different ways as shown in Figure 7 [14]. A low background laboratory (UDO), is build in a salt mine in Asse, Germany, 925 m below the ground level, equivalent to 2100 m under
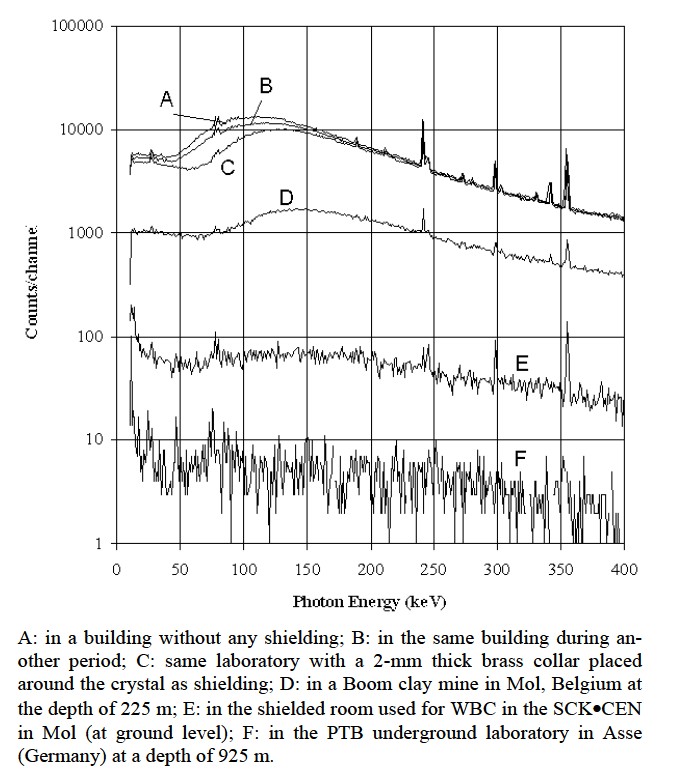
Figure 7. Background spectra in different shielding conditions: Measurements done with a 2 cm thick and 5 cm diameter HPGe detector (counting time is 40000s) [14].
water [18]. The earth reduces the secondary cosmic continuum by absorbing the µ-mesons. The muon level in this laboratory is around 4 × 10⁴ m–2a–1 whereas it is of 2 × 10⁷ m–2 a–1 in the laboratory of HADES (at SCK·CEN in Mol), 2.5 × 10³ m–2 a–1 in Grand Sasso (Italy), 103 m–2 a–1 in Homestake (U.S.A.) and in Fréjus (France) and between 3 × 10⁹ m–2 a–1 and 6 × 10⁹ m–2 a–1 at ground level.
a) Main shielding.
The most common type of room shielding depends on the use of high Z materials to attenuate the photon flux. Lead cannot be used alone because of its poor structural strength. If used, lead should be free of 210Pb (T1/2 = 22.3 a). More commonly, steel is used as the outer shielding wall to provide the major background reduction. A layer of steel of 20 cm reduces the gamma flux by 1 or 2 decades. The steel should be selected from old ships or from abandoned railways because the steel manufactured after 1945 is often contaminated with 60Co. Cobalt-60 is used to measure the thickness of the lining in furnaces. A sheet of “aged” lead, 1 or 2 mm thick placed inside the steel shielding can further reduce the spectrum continuum. Cosmic radiations generate K-fluorescence peaks in lead in the 70 - 90 keV zone, absorbed by 1 - 2 mm metal sheets with lower Z (Sn or Cu). When copper is used, electrolytic copper is preferred because (for its low contamination). Purity of electrolytic copper is higher than Sn. However, since the Cu sheet enhances the continuum of the spectrum between 90 keV and 150 keV (Figure 8), it should be removed when this part of the spectrum is examined [14,19]. This remark is valuable for other lining sheets placed inside the steel room. This means that each measurement case could be examined separately to optimize the detection limits as explained in the next paragraph.
b) Selection of counting room interior materials and furniture materials.
The effort expended in the design of an efficient shielded room can be lost by the introduction of inappropriate materials in the room. These problems, often negligible when fission and activation products are measured, could be significant for radionuclides requiring low detection limits (239Pu, 241Am). Any materials introduced

Figure 8. Effect of the addition of a cupper layer (3 mm) on the continuum portion of the spectrum in the low energy range (< 150 keV) [14,63].
into the counting room chair, detector supports, cameras, ventilation devices should be 1) absolutely necessary, and 2) selected for their low activity and low volume. Papers, books, etc. should be avoided during the measurement since the inks and colours can be contaminated and not only for intentional purpose as mentioned by Gardiner [20]. Uranium has been found in counting chair materials [21]. The painting of the walls of the counting room must be avoided for its capacity to attach radon daughters and progressively increase the background radiation level inside the counting room. Wood used inside must be counted as part of the selection process because it could have been contaminated by fallout or rains after the Chernobyl accident [18].
In a germanium detector, an indium foil, establishing an ohmic contact with the detector, is activated by cosmic radiations and generates perturbing photopeaks. For scintillation detectors, the photomultiplier tubes are often made of glass containing potassium (with 40K). The background then is difficult to control. However some companies develop low background photomultiplier tubes for nuclear metrology.
A numerical study [15] showed clearly that a steel plate placed behind a BOMAB phantom, filled with a solution of 137Cs, generates in the spectrum, by backscattering, an significant peak between 60 keV and 100 keV. Another study [22] showed that a beryllium entrance window of an HPGe detector is advantageously replaced by an ultrapure aluminium window.
c) Special considerations on the use of a shielded room.
Gamma spectrometry of human body and γ-spectrometry of samples are completely different procedures:
• The volume of the counting room is different in shape and size from a lead castle for γ-spectrometry on samples. A room for in vivo counting is generally much larger.
• The volume of the person is much larger than the volume of a sample and is variable (and seldom equal to the volume of the calibration phantom). A systematic error is almost always present (but can be considered for corrections).
• The distribution of the radioactivity in the body is never known but only assumed. This is also a source of systematic errors. Generally the calibration is done so that the results are conservative.
• The volume of the person generates, by Compton interactions, a continuum variable from person to person. This is another source of systematic error.
• The air inside the counting room is pulsed for health and comfort reasons. Radon or other radioactive sources can be introduced in the room. This problem can be avoided if “old” or purified air is used. Figure 9 shows 41Ar present in the spectrum

Figure 9. Analysis of WBC spectrum with the “Least Square Fitting” (LSF) method. A 8" × 4" NaI (Tl) detector is used. The counting time is 2000 s. The residual spectrum (presented at the top at the same scale as the spectra) is the difference between the measured global spectrum and the sum of the calculated spectra of each radionuclide known to be present. The measured spectrum results from the known presence of 40K (1.46 MeV), 60Co (1.17, 1.33 MeV), 137Cs (661 keV) and 41Ar (in the counting room). The presence of 59Fe is possible and has to be confirmed by other investigations.
of a person measured at the SCK•CEN. 41Ar is produced by the BR1, a 3 MW nuclear reactor used for research, working with natural uranium, moderated with graphite and cooled with air. Its photopeak at 1.29 MeV can be high and disturb the quantification of 40K.
• Generally the counting time in a shielded room is limited to one hour for the measurement of person. There is no limit for the measurement of samples.
• The presence of 40K in the human body prevents a further reduction of the background below some limit, depending on the examined energy zone [23].
The last point is the cause of the most important difference between γ-spectrometry for samples and WBC because of the 40K activity in the body (3000 to 5000 Bq) cannot be eliminated [14]. The accuracy of an in vivo counting (see below) is always worse than that of a sample and the LC for low energy photon (LEP) emitters is always higher.
Figure 10, top curve, shows the effect on the γ-spectrum of different scattering materials and of radioactivity inside the shielded room used for WBC:
1) γ-spectrum inside the empty shielded room.
2) γ-spectrum inside the shielded room with a water BOMAB phantom.
3) γ-spectrum inside the shielded room with the water
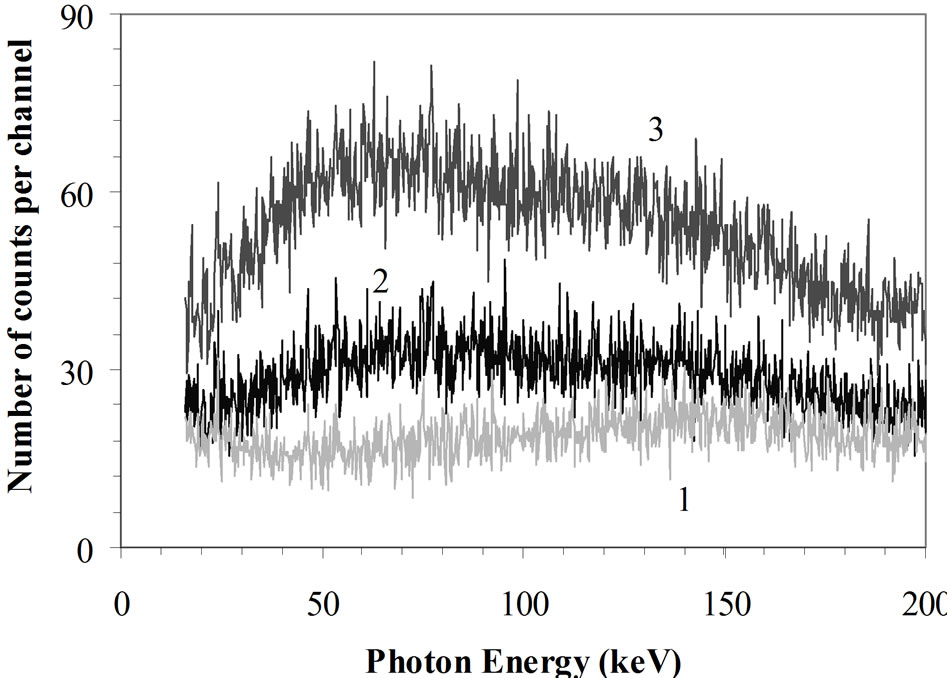
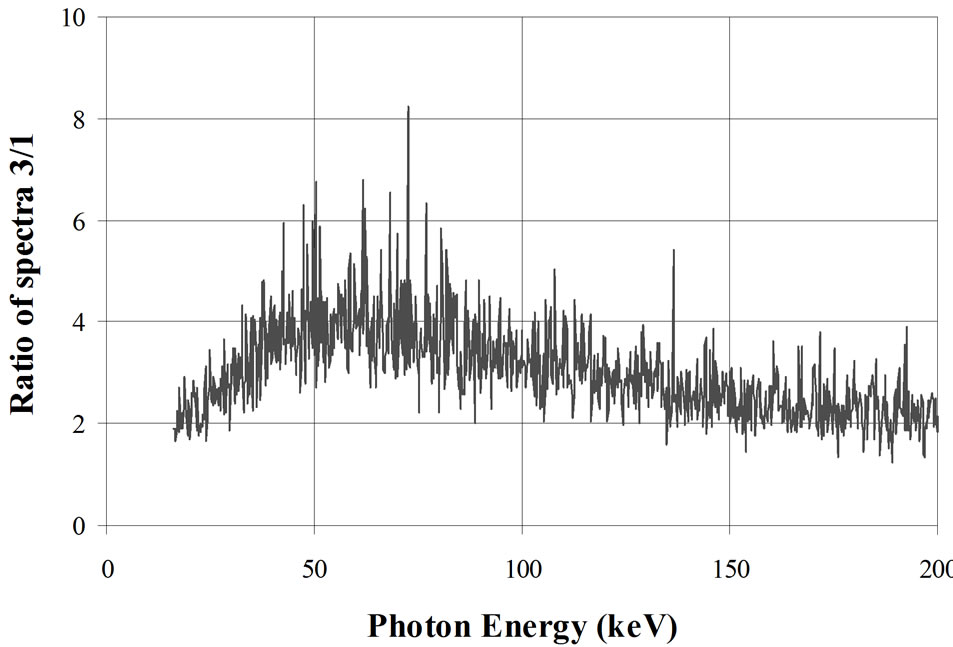
Figure 10. Effect of a water phantom or a water phantom filled with potassium in the counting room. Graphic at top: 1: γ-spectrum inside an empty shielded room designed for WBC measurements; 2: γ-spectrum inside the same shielded room with a water BOMAB phantom; 3: γ-spectrum inside the same shielded room with the phantom containing 4000 Bq 40K. Graphic at bottom: Ratio of curves 3/1 [14,63].
phantom containing 4000 Bq of 40K homogeneously diluted to simulate a human body.
The measurements are made with a 20 mm thick HPGe detector in the spectrum range between 15 and 200 keV (Figure 10). The bottom curve in this figure shows the ratio of the curves 3 to 1. This one indicates a maximum effect of the potassium in the 60 keV range. At this energy, the continuum is four times higher than in an empty room.
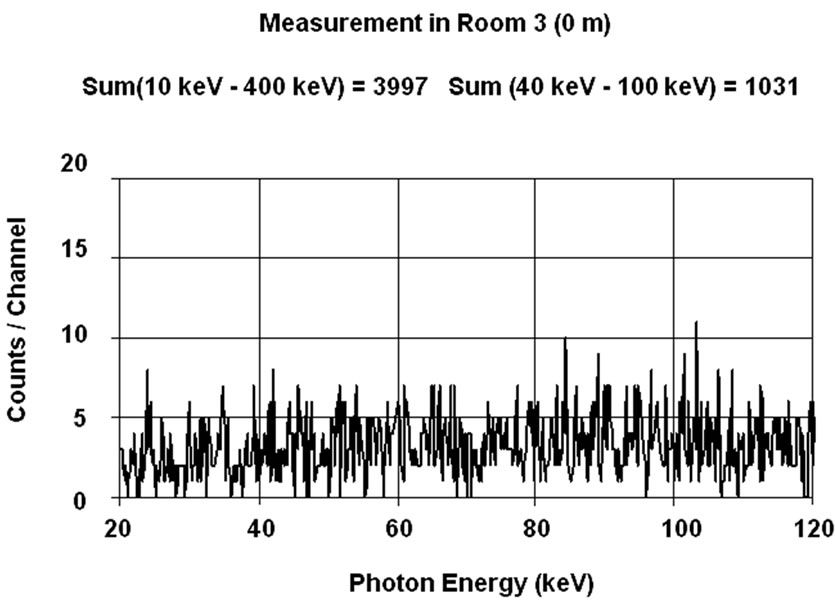
These experimental results invite to determine at which level of background a shielded room for in vivo counting is necessary. For this purpose, a person has been measured in the range 20 - 120 keV (corresponding to the assessment of 241Am lung burden) inside two different shielded rooms under standard conditions (50 minutes counting time) with a single 20 mm thick HPGe detector placed on the right lung. The first measurement (Figure 11(a)) was made inside the shielded room of the SCK• CEN at Mol used for the experiment described in Figure 10. The background in this room empty is given in Figure 7, curve E. The second count (Figure 11(b)) was performed in the UDO laboratory in the mine of Asse described before. This is a NaCl mine with very low content of 40K (KCl) and radon. The background in this room empty is given in Figure 7, curve F [23]. The third curve, Figure 11(c), is the ratio “channel to channel” of
 (a)
(a) (b)
(b)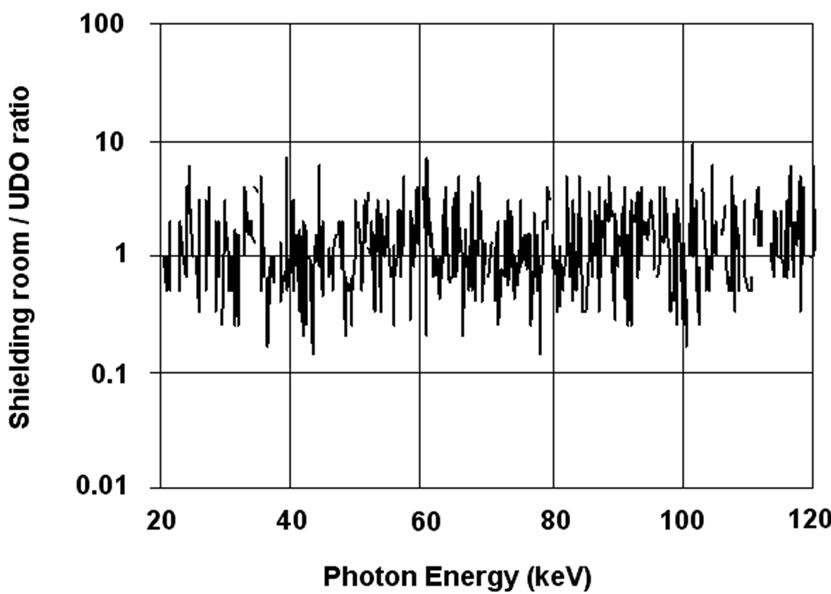 (c)
(c)
Figure 11. Measurement of right lung (20 mm HPGe detector) in shielded room(a) and in UDO (b). Ratio of spectra (c) [14].
the two γ-spectra. This ratio, equal to one, indicates that the 40K in the body (the photopeak of which is not visible on this part of the spectrum) increases, by Compton scattering and Bremsstrahlung, the continuum in the low energy region to the same level in both shielded rooms, destroying the advantage of a very low background laboratory. As mentioned in Figure 10, the continuum is 4- time higher in both laboratory than in the empty shielded room of the SCK•CEN (Figure 7, curve E) for the energy range 50 keV - 80 keV.
Therefore, a conjecture can be established that the measurement of the 60 keV from 241Am in the lungs or of other radionuclides with lower energy photon emission (125I) could be performed outside of a shielded room if precise rules are observed in the protocol of the measurement. This may seem unrealistic but this point of view is based on the heuristic fact that the spectrometry in the low energetic γ-ray range is not the same as in the middle or in the high energetic γ-ray range and that following rules can be considered:
• This type of measurement can be applied for specific radionuclides, emitting low energy photons, and concentrated in small part of the body: wound, lung or knee contaminated with 241Am and thyroid with 125I. Iodine-125 emits principally Kα2 at 27.2 keV, Kα1 at 27.42 keV, Kβ1 at 31.1 keV, Kβ2 at 31.3 keV and one γ-ray at 35.5 keV [24].
• The room, which can be an infirmary in a hospital, a cold laboratory in a research centre, an office in a nuclear power plant, must be selected and controlled for a low background (low radon concentration in the room, low activity level in the walls), without other sources in the room, no cathode-ray tube (TV or computer screen) and far from radioactive sources (contaminated persons in a hospital).
• In this case, the counting time is not limited to one hour but can be extended to several hours or even an 8-hour working day period to reach the required detection limit. For this reason and in the case of torso measurements (lungs, trachea, thyroid, axillary or mediastinal lymph nodes), a detector jacket [25] is an advantage: An array of several small detectors, working and analysed separately, allow the elimination of the irrelevant spectra after measurement reducing by this way the detection limit. The silicon diodes seem to be more appropriate for this type of measurements. A detector jacket containing several diodes can also localize the contamination in the body.
• The detector thickness must be tailored, in size and thickness, according to the emitted photon energy as previously described. Small detectors are practically insensitive to high-energy photons, and the low energy photons, absorbed by ordinary walls do not reach the detectors.
• A shield on the back of the person backscatters the photons emitted by the 40 K in the body and generates an important peak in the examined energy range, 50 to 100 keV (see Figure 2 in [15]). When this range is examined, a shielding room can be avoided to reduce the continuum of the background.
• The use of an array of small, thin detectors allows an a posteriori selection of active detectors, eliminating the noise and reducing the LC.
d) Experimental Analysis.
In a previously published paper [26], a series of measurements were made with a home made torso phantom (containing an actual human thoracic cage) with homogeneously contaminated lungs (45420 Bq 241Am). The purpose of these tests was to compare different silicon PIN diodes used as low energy photon detectors:
1) S3590-01 (Hamamatsu) 10 mm × 10 mm, 200 µm thick
2) S3590-05 (Hamamatsu) 9 mm × 9 mm, 500 µm thick
3) PD-16-300-AB PIPS (Canberra) 450 mm2, 300 µm thick
4) SFH217 (Siemens) 0.985 mm × 0.985 mm, 200 µm thick.
The diode SFH217, designed for television remote control, is an inexpensive diode, able to measure a γ-ray with a resolution of about 7% at 60 keV.
For measurements outside a shielded room, the best detection limit for the measurement of the phantom was obtained with the diode 2 (500 µm depleted thickness, polarized at 120 V) with a measured efficiency of 2.12 10–6 (s–1. Bq–1)) for the mentioned torso phantom: 1460 Bq for a counting time of 3000 s, 942 Bq (7200 s) and 283 Bq for 80,000 s.
Comparing the results with this diode, we can interpolate an LC of 400 Bq (241Am) for an 8-hour counting time. If the thickness of the diode is increased from 0.5 mm to 13 mm (Figure 6), this LC is reduced to 118 Bq and to 84 Bq if the counting time is extended to 80000 s (about one day). The number of diodes can be increased to reach a total detection area of 81 cm2 (10 × 10 diodes) and bring the LC to 8 Bq. These calculations show that an array of diodes can measure LEP emitters with the required critical level (10 Bq for 241Am).
The same calculation for counting inside the shielded room indicates 300 Bq for a 3000 s counting time. If the thickness of the diode is increased from 0.5 mm to 13 mm (Figure 6), this LC is reduced to 89 Bq for a counting time of 3000 s. The number of diodes than can be increased to a total detection area of 81 cm2 to reach an LC of 9 Bq for a counting time of 3000 s.
It is not the purpose of this section to deny the utility of a shielded room in WBC but to mention that, for low energy photon emitters, better detection limits can be obtained with a long counting performed outside of a shielded room, than with short counting inside the shielding. Outside a shielded room, the background generally can be some orders of magnitude higher than inside. This is not true for every detectors and for all energy ranges (Figure 8) and the LC of any detector for in vivo counting, outside the shielding is not necessarily significantly higher than inside. For the measurement of low energy photons from samples, silicon detectors have been designed to work outside a shielded room. An example is given in Figure 12. In this case, because of its thickness, the silicon diode is cooled with liquid nitrogen but a Peltier cell could let the detector work with the same leakage current.
The specificity of WBC with respect to other γ-spectrometry measurements is the presence of 40K as perturbing radionuclide. This paper wants to show that counting out of a shielded room, already applied in different cases (wound counting for instance), can be extended to more difficult measurements with an extension of the counting time and the use of appropriate detectors.
When the peak area analysis is used, the detection limit can also be lowered by improving the energy resolution. HPGe offers the best available resolution (1.5% - Table 1) but requires cooling to ~90 K (with liquid nitrogen or Stirling cooler). Room temperature detectors (CdZnTe, GaAs, CdTe, ) have been developed with a resolution approaching that of the HPGe detectors but their electric signal, because of the different mobility of the charge carriers, requires more appropriate electronic treatment before analysis. Their sensitivity to high energy photons (due to their high Z) is also a handicap. Silicon diodes seem to be the best approach to measure low energy photons. Today, the electronics can furnish microcontroller arrays in a single integrated circuit, allowing the

Figure 12. Silicon diode for the measurement of low energy gammas from samples used outside a shielding room.

Table 1. Resolution and working mode of different γ-ray detectors. (for CdZnTe, GaAlAs and Silicon detectors, resolution is given only for low energy photons (< 100 keV).
development of the waistcoat detector array described before.
3.3. Plutonium Detection
Detection and quantification of 239Pu presents a very difficult challenge. This α-emitter with a half-life of 24,100 years is found with high concentration in irradiated fuel assemblies, in fresh mixed oxide fuel assemblies and in nuclear reactor wastes.
Plutonium-239 in the body can be measured directly by two of the weakly penetrating L X-rays emitted by its daughter 235U during internal conversion: 17.0 and 20.4 keV. The other X-rays - 11.6 and 13.6 keV are completely absorbed by tissues in case of lung contamination but could be used in case of surface wound contamination. The detection limit for the two high energy photons with the direct method is too high to comply with most of the protection regulations.
Plutonium-239 is accompanied by 241Pu, a beta-emitter (T1/2 = 14.4 y) with 241Am (T1/2 = 432.6 y) as daughter. Americium-241 is present in the mixed reactor fuel at 1 or 2 % of the 239Pu activity concentration and emits a 36% intensity 59.5 keV γ-ray that can be used as a 239Pu tracer. In accidental intakes of mixed oxide fuel particles, it is accepted that 239Pu and 241Am, parts of a same insoluble matrix, follow the same metabolism. 241Am can be detected using a double HPGe detector (2 cm thick, active area = 5800 mm2). This technique is able to detect 6 or 7 Bq 241Am in the lungs after a 50-minute counting time in a shielded room [27]. This method requires the knowledge of the concentration of each radionuclide to make the dose calculation. This concentration is generally known in each process unit or can be measured by mass spectrometry. This technique could be replaced by the technique described in the section 2.c.
3.4. Advantages and Limitations of Scintillation Detectors
Although solid state detectors are now commonly used for routine monitoring, scintillation detectors still have value for special applications because of their characteristics:
• Thallium activated sodium iodide, NaI (Tl), is easy to use and offers high sensitivity.
• Scintillators have acceptable energy resolution― FWHM/E0 ³ 7% (Table 1).
• Scintillators operate without the need for coolingl When least square fitting analysis method (LSF) [28] is used for these detectors, lower detection limits can be obtained, compared to HPGe with peak area method.
• NaI (Tl) is hygroscopic and requires control to avoid spectrum degradation due to the intrusion of water vapour if there is a leak in the detector cladding. When more than 5% of the surface of the crystal is humid, the detector must be cleaned with MethylEthyl-Ketone in a dry air environment. An example of treatment of a NaI (Tl) degraded by humidity and treated with this product is given in Figure 13.
• Bismuth germanate (Bi4Ge3O12) and CsI (Tl), used in medical imaging, are not hygroscopic.
• The wavelength of maximum light emission is 410 nm for NaI (Tl) and 530 nm for CsI (Tl).
• NaI (Tl) scintillators require one or more photomultiplier tubes depending on their size with a high voltage bias (> 700 V), while the CsI (Tl) works better with one or several silicon photodiodes biased at 10 V and are more stable.
• The low density (3.67 g·cm–3) and the atomic number (ZNa = 11) of Na makes NaI (Tl) a weaker gamma absorber than CsI (Tl) (4.51 g·cm–3 and ZCs = 55) [29].
• CsI (Tl) has a better light yield than NaI (Tl) (65 photons/keVγ versus 38 photons/keVγ) [29-33]. The association CsI (Tl)-photodiode has a better global efficiency than NaI (Tl)-PMT.
• When the detector-photomultiplier combination is not sealed, the high viscosity silicone grease, ensuring the
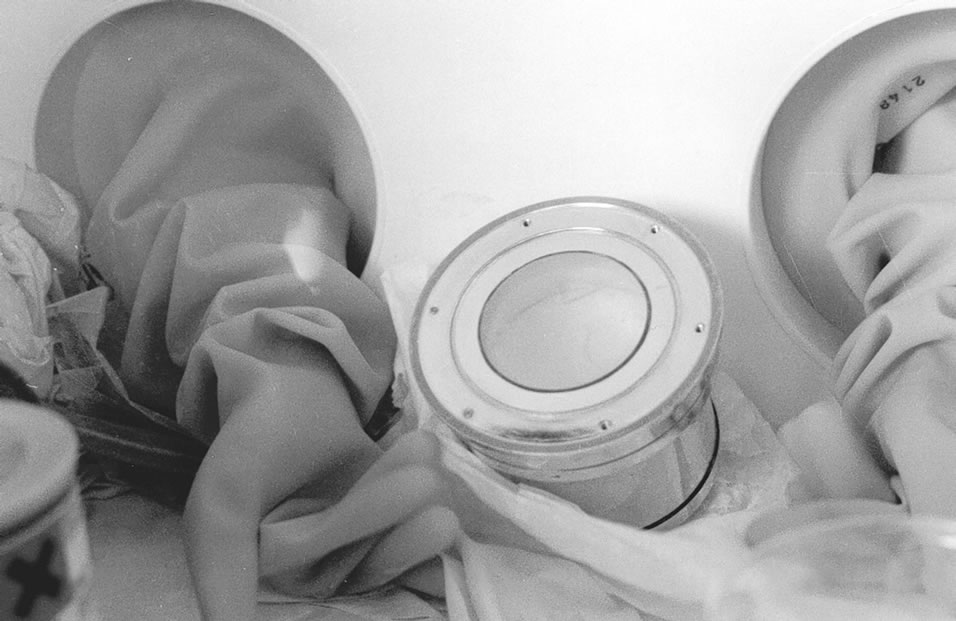
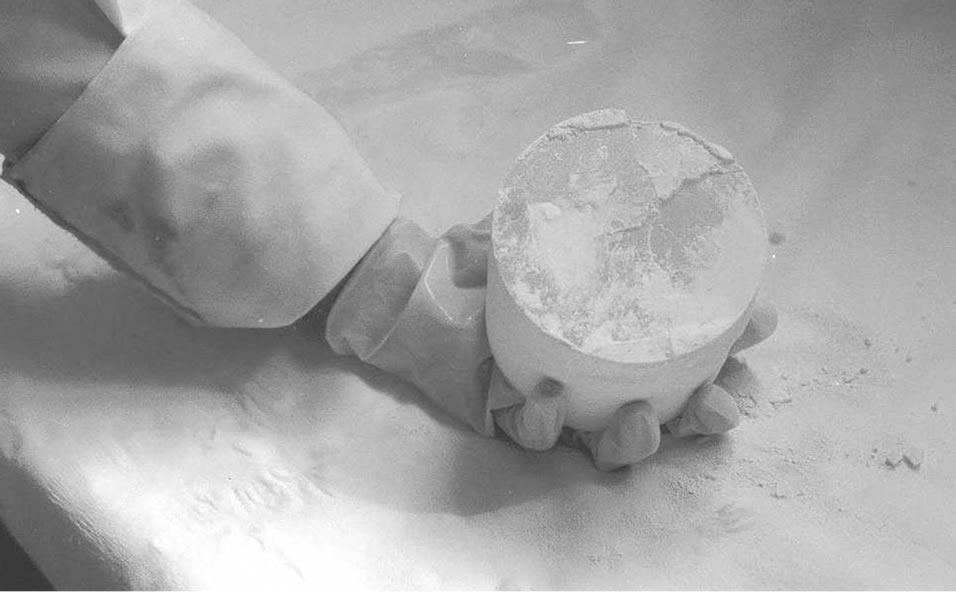
Figure 13. NaI (Tl), out of his casing and humid has lost its transparency. After chemical treatment in a dried glove-box and re-encapsulation in its casing, the transparency and measurement qualities are recovered.
optical coupling between the detector and the photomultiplier, may dry and would have to be replaced every five years. This problem does not appear with sealed scintillation modules where the PMT-NaI (Tl) assembly is airproof. The deterioration of the silicone grease is visible with the examination of a background spectrum: parasitic peaks similar to photopeaks appear.
• When several PMTs are used on the same scintillation crystal, the focus of the photocathode of each tube must be adjusted periodically. The light from a scintillator is indeed distributed into the different PMTs according to the position in the crystal where the γ-ray is absorbed. The sum of the signals must be treated by a multichannel analyzer instead of the signal from each photomultiplier individually. After adjustment of the focus of the different PMTs to the same position in the spectrum (Figure 14), the resolution of the detection device is optimized. When focus is not adjusted, erratic peaks can be generated in the spectrum.
• A photomultiplier tube has peak sensitivity wavelength varying between 185 nm (if special UV glass is used) and 1600 nm [33]. A silicon photodiode has a peak sensitivity at 880 nm so that only CsI (Tl) or BGO can be associated with it.
 (a)
(a) (b)
(b)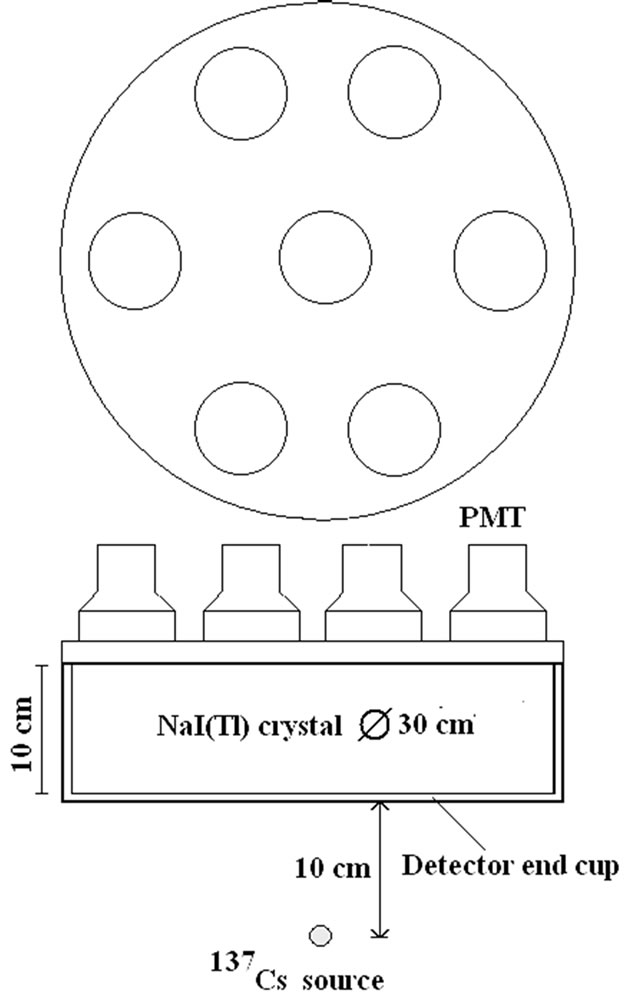 (c)
(c)
Figure 14. Spectra collected (before (A) and after (B) focus adjustment) by each individual PMT in a 30 cm × 10 cm NaI(Tl) scintillation device using 7 PMTs. The source used is 137Cs, point source placed at 10 cm from the detector endcup on the symmetry axis of the crystal.
New scintillation detectors also appear on the market. Among them the LaBr3 (Ce) is a good one [34]: it has a excellent light yield (~90,000 photons/MeV) and a better resolution (3% at 662 keV) than NaI (Tl) from 50 keV till 2.0 MeV. But it shows photo-peaks due to the natural radioactivity of 138La, the most important is the photopeak at 1.436 MeV which could perturb the measurement of 40K. At high count rates, the better peak resolution and counting efficiency are an improvement over NaI (Tl) detectors. It should find a good application in association with external solid state detectors described further in chapter VII.
3.5. Spectrum Analysis Software
An energy spectrum of in vivo counting is, after extraction of the background, composed of two parts:
1) the continuum, generated by interactions of photons with the detectors and the surrounding materials (including Bremsstrahlung and Compton scattering)
2) the photopeaks from discrete photons emitted by the radioisotopes present in the body and surrounding materials.
The spectrum, therefore, can be analyzed by two approaches: photopeak analysis, and full spectrum analysis by the least square fitting (LSF) [28]. Least square fitting presents the following advantages over photopeak analysis:
• LSF is better to analyze poor resolution spectra.
• Offers lower detection limits. For example 7 Bq of 137Cs can be detected with LSF compared to 50- 100 Bq with the photopeak analysis and even 20-30 Bq for the lowest value mentioned in literature [24].
• Can be used to analyze spectra obtained with CdZnTe (CZT) diodes.
• Can be used to analyze spectra generated by pure beta emitters (without photopeaks) like 32P or 90Sr. The Bremsstrahlung radiations generated in the body are producing a spectral signature allowing the quantification of the radionuclide when this is identified by another method. This is not possible with the photopeak methods.
• In the case of WBC, the calibration spectra are obtained with phantoms assuming a known distribution of the contamination in the body (generally homogeneous). LSF helps to detect non-uniform contamination because the spectral shape will differ from the calibration spectrum.
• LSF software corrects for gain shifts which are frequent with the NaI(Tl) detectors, even when energy calibration is performed twice a day or automatically.
• LSF detects and analyses spectra perturbed by “parasitic” radionuclides (Figure 9) Peak analysis also depends on calibration (difference between calibretion and subject geometries and different contamination distributions). With the LSF method, a residual different from a statistical noise means that a radionuclide has been omitted in the analysis or that a wrong radionuclide has been selected. In the case presented in Figure 9, the LSF method can detect the presence of 41Ar which would not have been detected with the peak analysis. Peak area is just a numerical value whatever the difference of contamination distribution between the phantom and the subject. The shape of the spectrum, however, can alert discrepancies between calibration and subject geometries, inhomogeneous distribution of contamination, wrong selected radionuclide or different size between person and phantom. The LSF method has many advantages in terms of accuracy and can reveal information impossible to obtain from the peak area method.
• For the peak area analysis, a good method, based on the analysis of variance, has been developed by H. Spitz [35] to distinguish true photopeaks from statistical noise.
The most frequent critics made again the LSF method are that the shape, size and contamination distributions of the phantom and of the person are different and that the spectra will be different too. This applies to both methods but only the LSF detects these differences. Most of laboratories now use HPGe detectors and peak area analysis. But laboratories still using NaI (Tl) detectors should not select the peak area technique. 90Sr and 32P require LSF for quantification.
4. Accuracy in the Evaluation of the Radioactivity and Distribution in the Body
4.1. Sources of WBC Inaccuracy
Several sources of systematic errors in WBC have been mentioned above. The large mass of the body, its shape and size and the fact that the distribution is seldom uniform and never known, makes WBC more complex and difficult than the counting of samples. Several factors are responsible:
• Limited counting time contributes to random errors.
• The distribution of the radionuclides in the body is unknown. Monte Carlo simulations on a phantom in supine position with a uniform contamination distribution can calculate the contribution of the different parts of the body to the total measured signal. An example is given in Table 4 and Figure 15 for two positions of the detector above a phantom in supine position. These calculations present the contribution of each part of the body for two positions of the detector. The table presents the volume of each body part (both calves together, both thighs together, the gut, the thorax, the neck, the head and the total). For each part, the calculated contribution to the total count rate (s-1.Bq-1) is given. This count rate depends on the volume of the body part so that the specific count rate (count rate divided by the volume) is also given. This last value is more appropriate to show the effect of the position of the detector on the result. When the detector is positioned above the thorax, the contribution of the neck is more important than the contribution of the thighs and the calves together. Other positional effects can be calculated by the Monte Carlo simulations.
• The presence of 40 K in tissues limits the reduction of the background and increases the detection limit in the low energy range.
• Large room size and pulsed air ventilation can increase the radon content. The use of outside air lowers the radon level (except in case of temperature inversion when the radon accumulates at the level of the ground).
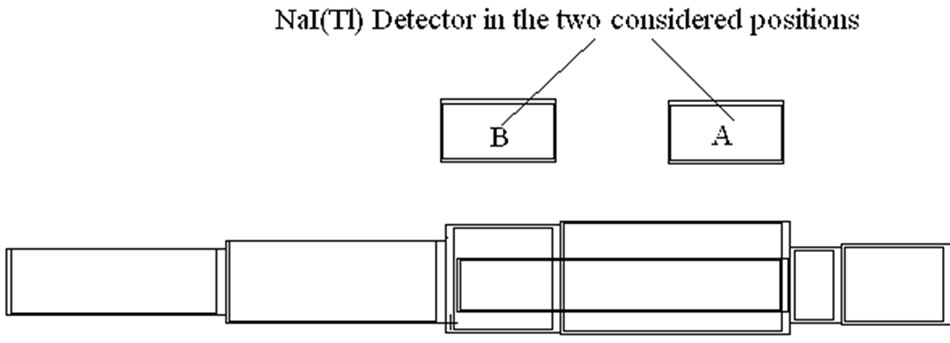
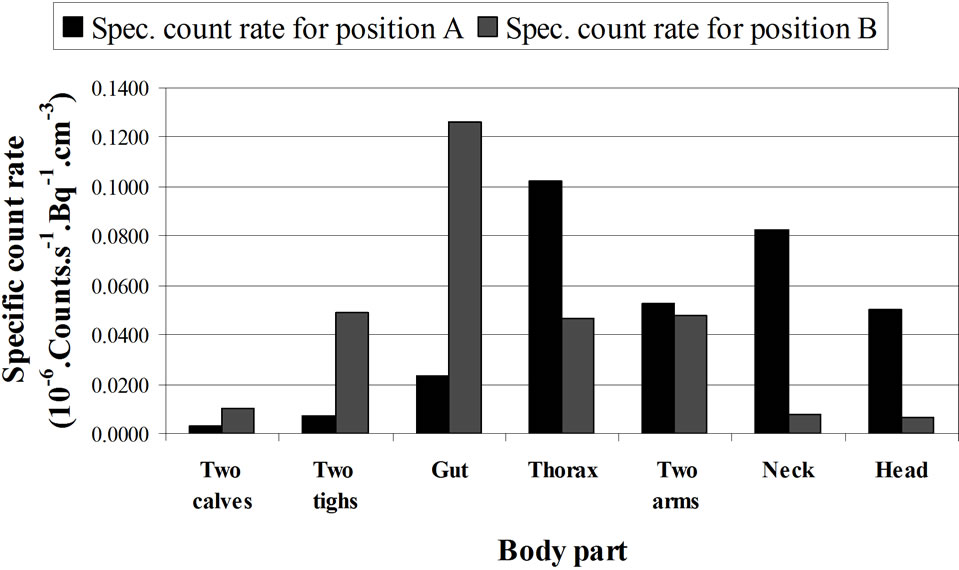
Figure 15. Computed contribution of the activity contained in the different body parts to the total activity (given by Organ count rate/Vo) where Vo = Organ Volume) Calculations made for 1.46 MeV (40K homogeneously distributed in the phantom) and with a 20 cm × 10 cm NaI (Tl) detector, located above the thorax (A) and above the abdomen (B) of a full adult BOMAB phantom in a supine position and for a same counting time. The calculations are made with MCNPX code. The data relative to this histogram are given in Table 4. See the text.
• The spectral shape depends on the location of radionuclides in the body and on the position of the detector with respect to the body. The reduction by inverse square distance, absorption and scattering in the tissues influences the measurement in case of anisotropic detector response and unknown distribution of contamination (Figure 16). The knowledge of the angular response is useful in the localization of a contaminant in the body, in an organ or in a wound.
The calibration of the measurement devices with anthropomorphic phantoms is subject to inaccuracies when the shape, type and size of the phantom differ from the measured person [15,36]. When a calibration is made with a torso phantom (containing 40K), the detection limit derived from this calibration will be underestimated because the 40K in the full body and the cosmic radiation will both generate, by interaction in the body, a continuum higher in the region of interest than with a torso phantom alone. This effect is still more important for the calibration of a knee phantom or of a thyroid phantom. A comparison exercise, partially supported by the European Commission [37], mentions an under-estimation of the scattered contribution between peaks below 30 keV. This conclusion does not mention that the calibration is made with the knee phantom only and that the continuum generated by the whole body will increase the continuum in a wider energy range. The detection limits obtained with the measurement of a person would produce higher detection limits.
4.2. Calibration Phantoms
Next to the BOMAB used for whole body calibrations,
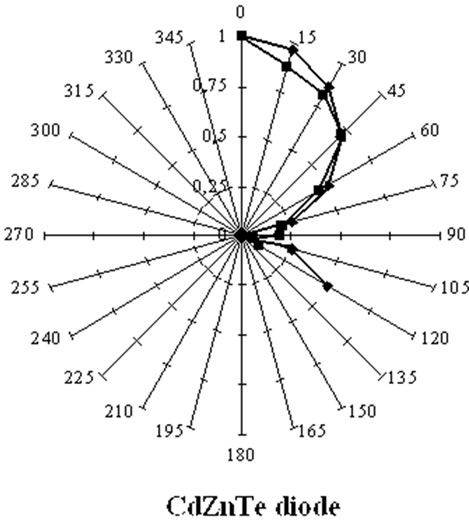
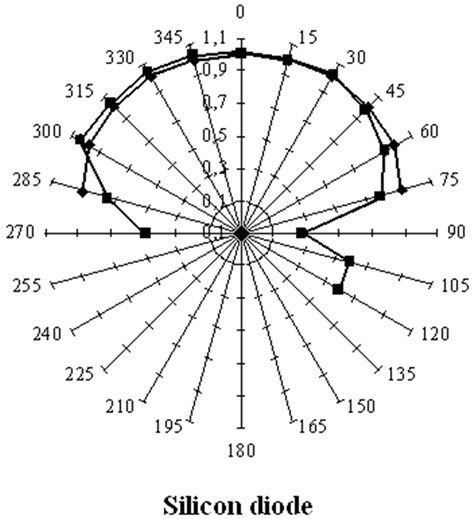
Figure 16. Angular response of a silicon PIN diode and of a CdZnTe diode for the 60 keV photons from a 241Am point source placed at different positions around the detector by keeping the distance between the source and the geometrical centre of the detection crystal constant. This Fig. compares the measured (red) and computed (blue) angular responses of the silicon detector (left) and the CZT diode (right). The silicon diode, with a lower absorption coefficient is more isotropic than CZT [17,64].
simple plastic (Polymethyl-metacrylate) phantoms like the REMCAL Transfer Phantom (RMC) may be sufficient. RMC phantoms are easy to use but limited to WBC in supine position and not intended for low energy measurements.
Different types of phantoms have been designed to represent morphologies of the different measurement applications, sex, age and ethnic background:
• The Lawrence Livermore Laboratory torso was developed for calibration of lung and transuranium nuclide counting in the adult Caucasian trunk and abdomen. This phantom is more adapted for populations with high chest wall thickness (CWT).
• The JAERI phantom was developed for eastern Asian populations. This phantom, on the opposite, is adapted to population with thin chest wall.
• A new promising phantom is the sliced BOMAB phantom developed by Kramer [38]. Similar to the conventional BOMAB, it is made of high density polyethylene slices (2 cm thick) and uses radioactive planar sources between the slices. The phantom has no risk of leakage; the activity level can be modified easily without waste and the problem of transport is reduced; the phantom can be modified to represent different body sizes, both sexes and a range of ages.
The development of home-made phantoms is not encouraged because the number of parameters involved in a WBC measurement is important. A unique phantom is best suited for comparison exercises.
4.3. When Should the Accuracy Be Improved in A WBC Measurement?
The distribution of the contamination in the body varies nearly always with time and is never precisely known. The uncertainty on a measurement in a whole body counting propagates to the dose calculation and the reduction of this uncertainty is essential. A comparison program, organized by the European project IDEAS [9] between different laboratories shows that differences in measurement procedures on one hand and assumptions adopted for dose calculation on the other hand can lead to discrepancies of several orders of magnitude in the final dose assessment. This is, in part, due to different phantoms used for the calibration and to different classes chosen for the contaminants in the calculation of doses. The report 60 of the International Commission of Radiological Protection [39] defines three classes of contaminants: the fast, middle and slowly eliminated contaminants. They have different metabolisms and, consequently, different burden distributions in the body [8]. The need for a phantom as similar as possible to an organ, in shape and size is considered as well established. The thyroid, for instance, is a small gland. Its measurement can be easily done with a small detector placed near to the gland. But, Kramer [40] notes activity discrepancies of 40% to 50% when the thyroid phantom differs in shape and size from the measured gland. A detector placed differently during calibration and measurement leads to still higher bias because of the short distance detector-organ. Other comments on the measurement of this organ are given later (§4.d).
In the lung burden measurements, systematic errors of up to a factor 7 are found in the assessment of actinides for unknown burden distribution [41].
4.4. Methods to Improve in vivo Counting Accuracy
4.4.1. Detector Size, Detector Assemblies, and Detector Placement
It was noted that, for specific applications, a shielded room is not necessary when the measurement device is designed for low energy photons.
An example has been shown in the use of the detector jacket [8,14,26].
In an experimental test, three silicon PIN diodes (500 µm thick, 1 cm2 area each) were placed in a copper box carefully designed to protect them from the electromagnetic radiations (Figure 17). This arrangement shows the possibility to quantify and precisely localize small radioactive particles in contaminated wounds. Another experiment has been made with the same device: A source behind an absorber simulates a torso phantom with local

Figure 17. Silicon-diode array in a shielded box for in-vivo measurement of low-energy photon-emitters. The diodes are 500 µm thick and 1 cm² in area each. They are separated from the power supply (left part) with a mounting eliminating the electrical noise around the diodes. These detectors are very well adapted for portable devices [14,65].
contamination (hot spot). The three detectors “see” the source and presented the following measured detection limits (LC) after one day counting (86400 s): 98 Bq, 40 Bq and 22.2 Bq outside a shielded room. If the three resulting spectra are combined (summed), the LC becomes 21.8 Bq. This shows that when the three detectors measure the activity (with a photopeak), the combined result is always better than the detectors individually. If a shield is placed in front of detector 1, the result will become, after re-calibration, 48600 Bq, 40 Bq and 22.2 Bq with 25 Bq if the three spectra are summed. This indicates that it is better to eliminate the detector which does not see the activity to reduce the detection limit. This result already was mentioned in literature for the measurement of uranium in the lungs [16]. The elimination of a part of a detection device is only possible with a mosaic of detectors. As shown previously, the use of silicon diodes with larger thickness (13 mm) will produce better results in terms of detection limits.
The use of the single 3 mm × 3 mm, 100 µm thick silicon PIN diodes (BPW34 or BP104), designed for the infra-red receiver in remote control systems, provides an inexpensive way to localize and measure 241Am particles in a wound or 125I in the thyroid. The anisotropic response of special detectors like the CdZnTe mentioned above can also be used to localize the contamination. This high-Z detector makes it sensitive to a wide photon energy range even in small volume [10,23].
The effect of the position of the detector above a BOMAB phantom with the tilted chair geometry is presented in Figure 18: the error due to a longitudinal shift of the

Figure 18. Variation of counting rate for a radioactive source vs. position of the detector. Detector: 20 cm × 10 cm NaI(Tl) scintillator. Geometry: the tilted chair is adopted. Phantom: Same as phantom used in Fig. 5. Examined photon Energies: 661 keV (137Cs), 1460 keV (40K) and 60 keV (241Am). For clarity the ordinate has been multiplied by 20 for 241Am [15].
detector is negligible if the detector stays in a zone of about 30 cm centred on the calibration point [15].
The optimum size (thickness) of a detector will reduce the effect of other sources of signals (including 40K and other radionuclides in the body) on lung counting by reducing its sensitivity to high energy photons, the only ones able to reach the detectors.
4.4.2. Morphological Parameters: Chest Wall Thickness and Lung Volume
The CWT and the lung volume influence the whole body counting result for low energy photons. Empirical formulas have been used to determine the CWT from the height, weight and age of a person [42]. CWT can be measured with ultrasound, MRI or CT scans (adding a dose to the subject) [43]. The volume of the lung can be measured with splethysmograph or N2-He dilution. Uncertainties in the lung volume can lead to discrepancies of 60% at 17 keV and of 41% at 60 keV when a 55 mm HPGe detector is used [44]. The calculation of the attenuation in the tissues with the aid of computer simulations may improve the measurement accuracy. For the calibration with phantoms, sliced lung sets provide an inexpensive alternative to the homogeneous lung sets but discrepancies of ±10% are possible, depending on the photon energy [38].
4.4.3. Determining the Counting Time versus MDA
Various working groups in different laboratories use counting times between 10 and 3000 seconds depending on the required detection limit and the assayed radionuclide. A 10 second counting is enough for the assessment of most of the iodine isotopes in the thyroid [24]. The measurement of 241Am in the lungs with a HPGe double detector requires 3000 seconds to reach an MDA of 4-8 Bq [24,27]. In the domain of research, a 2000 s counting time for fission products assessment was adequate to precisely measure the ecological half-life of 137Cs in Belgium after the Chernobyl accident [45], a task not intentionally foreseen for WBC.
4.4.4. The Use of Virtual Phantoms for Calibration
The improvement of the accuracy is one of the objectives in R&D works. Generally, a homogeneous contamination is assumed and this leads to conservative results. More detailed information is needed when high contamination levels are involved and additional calibration phantoms with different sizes are required. The accuracy can also be improved with computer simulations based on two approaches to photon transport calculation: 1) deterministic and 2) Monte Carlo methods. The deterministic method solves the linear Boltzmann equations numerically. It is best suited to solve very deep penetration problems [46]. Deterministic codes calculate the photopeak attenuation without generating the full spectrum [47]. The Monte Carlo method simulates the stochastic particle migration through the whole body volume and is more appropriate to treat complex problems. The emergence of the Monte Carlo codes, such as MCNP, VMC [48], EGS4 [49], GEANT, MORSE, PENELOPE, TRIPOLIS, etc. allows a priori and a posteriori analyses for dissimilar calibration and measurement conditions. Large or small morphologies, heterogeneous distribution of radioactive burdens, effect of the detector position during the measurement and anisotropy of some detectors can be taken into account without implying conservative assumptions.
Virtual calibration using Monte Carlo can be used to compare different types of collimators without the expensive time and materials needed for physical measurements. Figures 19-22 (from unpublished data obtained during a collaboration work with E. Carinou and V. Koukouliou

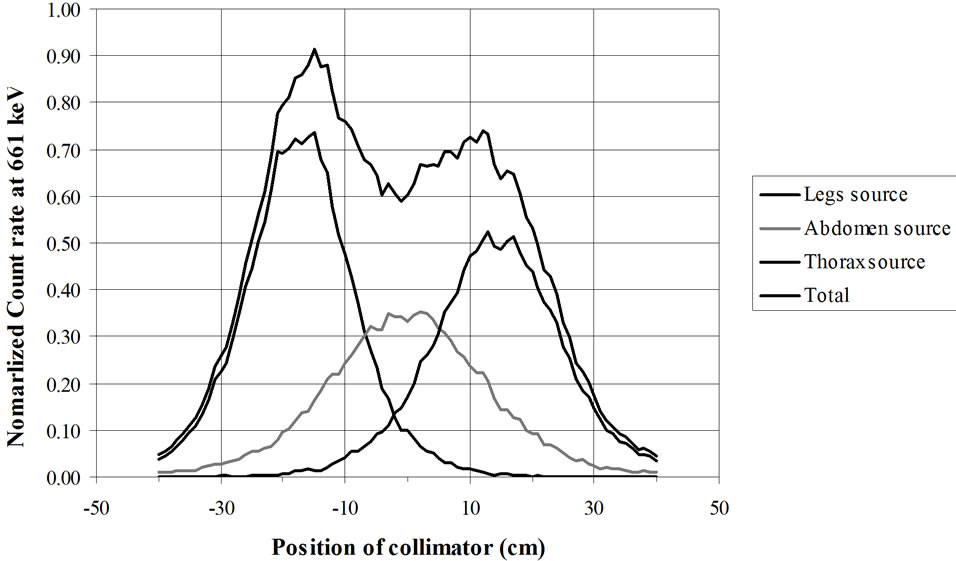
Figure 19. RMC (REMCAL Transfer Phantom) measured with collimated HPGe detector. Lead collimator 2 cm thick (Slit = 2 cm).


Figure 20. RMC (REMCAL Transfer Phantom) measured with collimated HPGe detector. Collimator: material = Lead, thickness = 8.4 cm, slit = 2 cm. Photon Energy = 1.46 MeV.
from GAEC, Athens, Greece) show examples of the utility of virtual calibration. In these examples, a RMC phantom is measured with a collimated HPGe detector. The contribution of three radioactive sources is measured. These are located at the simulated level of the legs, abdomen and thorax. The comparison of the three figures shows that a collimator, made of four tungsten plates allows a precise localization of the burdens. This RMC phantom is not adapted for calibrations of measurement devices used with body scan but allows a much better vision of the effect of collimations.
However, for homogeneously distributed radionuclides (such as 40K), this phantom will lead to underestimations of the body burden. In summary, the use of Monte Carlo codes contributes to the optimization of a detector selection, shielding material, counting geometry and counting room design. It also can provide valuable information on the effect of metabolism. Although virtual

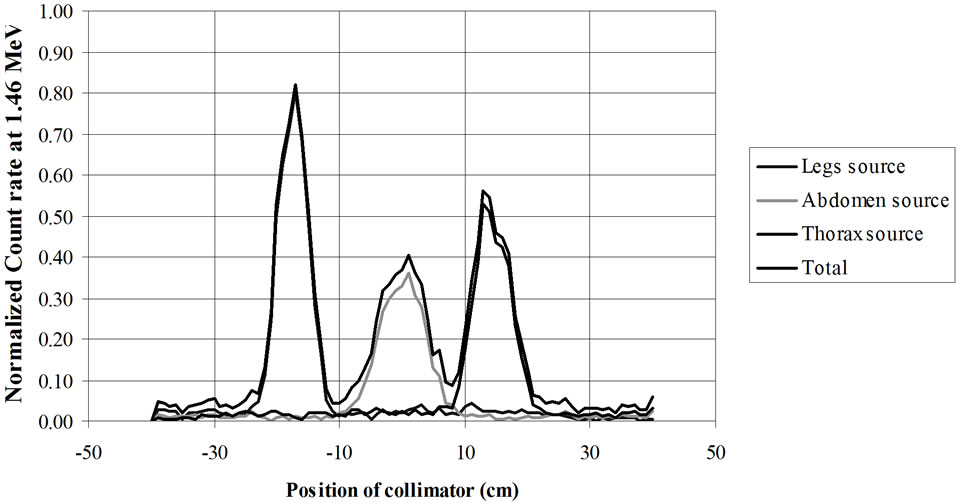
Figure 21. RMC (REMCAL Transfer Phantom) measured with collimated HPGe detector. The collimator, made of four tungsten plates allows a precise localization of the radioactive burdens. Collimator slit = 2 cm. Photon Energy = 1.46 MeV.
calibration will not replace measurements with physical phantoms, it is extremely useful for the interpretation of measurement results, and correction for body size differences, effect of hot spots, contamination position control, excretion studies, etc.
The use of Monte Carlo for WBC simulation must be done by keeping in mind its limitations. It is true that an increase of the detector volume can improve the efficiency of a measurement (38) but after a detector thickness value, variable with the measured photon energy, the MDA will again increase (Figures 5 and 6), a parameter difficult to master with virtual calibrations [14,21] because the continuum and the resolution of the detector are possible but difficult to predict with these calculation codes.
4.4.5. The Shielding Room Can Be Optimized for Each Application
The design of the shielded room has been discussed in §III.2. It has been shown that, at the level of the ground, where natural radiations exist, the shielding must be optimized and that extra shielding can be detrimental in the reduction of the continuum level. Especially in the very low energy photon domain (below the 70 keV), it has been shown in Figures 8, 11 and 12 and in §III.2.c and §IV.4.a that it is better to work without shielding. This is seldom the case for sample measurements. An adaptable shielding room with movable lining would the best solution.
5. in vivo Measurement Applications
Developments in whole body counting can be grouped into two categories: design of new hardware and development of better software for the analysis of the measured spectra. New hardware can be examined for specific tasks: CdZnTe, GaAlAs detectors and silicon PIN diodes should be selected depending on the nuclide energy range and the type of application (low background, low detection limits, localization of the contaminant, etc). Portable devices comprising a silicon diode array or a NaI(Tl) crystal, the electronic units and a portable computer are now available in very small sizes (Figures 23 and 24). Among the portable devices, the detector jacket allows metabolic studies of low energy emitters (Table 2). The main characteristics of the detectors are summarized in Table 3 [50] which is intended to facilitate their optimal selection for each type of application.
WBC is used for the control of internal contamination in workers, public accidental exposure and natural contaminations. The number of radionuclides used in medical applications (therapy, imaging and metabolic studies, etc) has significantly increased and many of them emit low energy photons. Labelled molecules are used for metabolic studies: 59Fe for blood volume measurement, blood transfusion and iron metabolism study, 60Co is used as tracer and 99Tc is the most widely used radioisotope in medical imaging. 212Pb (T1/2 = 10.6 h) is now used in radio-immunotherapy. As an example, the metabolism of 99Tc in the knee is shown in Figure 24. The calibration with a knee phantom was done by keeping the same position that used for the subject measurement. The comparison of the two spectra (with 6 hours interval) indicates that the marked molecule is not biologically eliminated. The knee phantom has been developed by H. Spitz from the University of Cincinnati [51].
The potassium body content in normal and pathological conditions (muscle or renal diseases, obesity) is assessed by measuring the 1.46 MeV photon emitted by 40K. The measurement is precise and fast (2 minute) with plastic scintillators and the LSF method [52]. An accurate measurement requires a shower and special clothing because the potassium can migrate in the clothes by transpiration.

Figure 22. Scan of a BOMAB phantom at 60 keV and 660 keV with a HPGe detector collimated with a tungsten collimation device. Calculations made using the MCNPX Monte Carlo code. The phantom is an adult BOMAB in supine position. The detector device is moving from the feet to the head (arrow). The two extreme positions of the displacement path are shown. The horizontal and vertical dimensions are in mm.
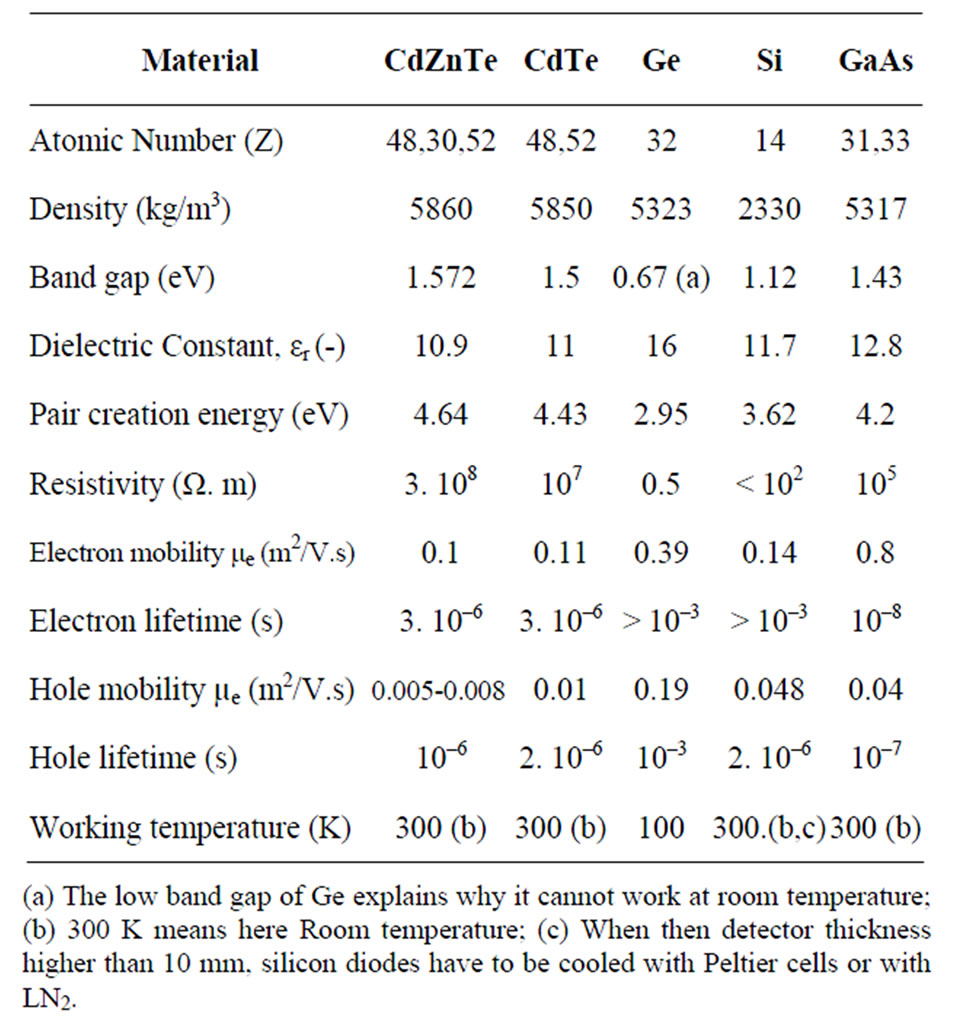
Table 2. Properties of semiconductors for detectors fabrication.

Figure 23. Complete facility for remote in vivo measurements: NaI (Tl) detector, module with high voltage power supply, amplifier, analog-digital converter and multichannel analyzer and the portable computer. The device is battery operated.
For the measurement of contamination, the shower also helps to avoid confusion between internal and external contamination with important consequences when de-corporation treatments are used.
WBC can be used to assess the validity of decorporation procedures after accidental contamination [53]. Optimizing the type, shape and size of the detector improves the
 (a)
(a)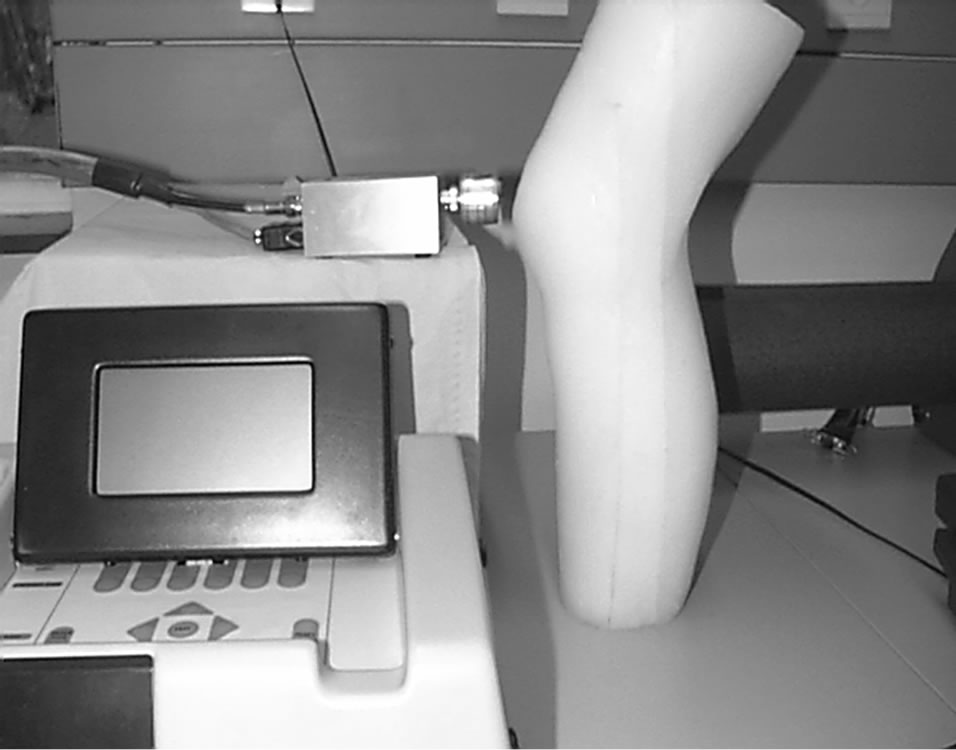 (b)
(b)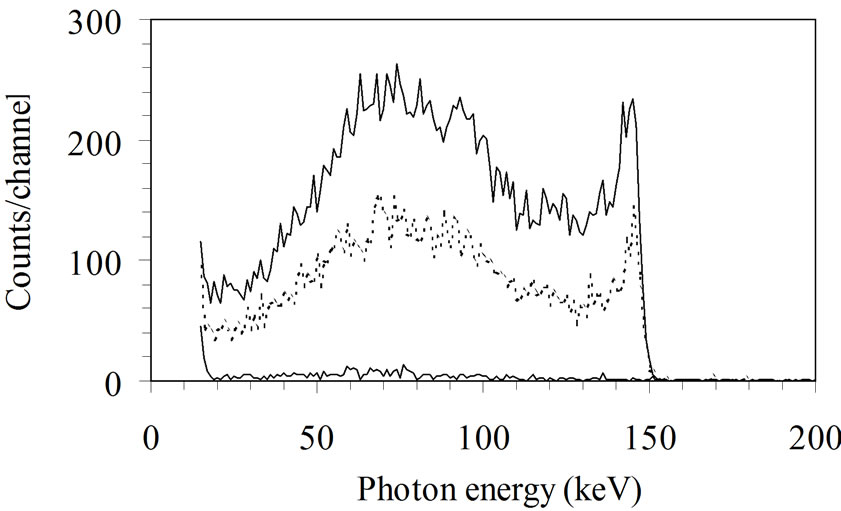 (c)
(c)
Figure 24: Measurement of the knee. a) Knee phantom is disassembled to show the different bones; b) Knee phantom measured with a CZT detector to calibrate a patella measurement; c) Spectrum of 99mTc from the patella of a patient: the two spectra are measured at interval of 6 hours to study the metabolism. The background is shown in red.
control of decorporation on long periods [54]: a small detector (or a collimated one) can be used to localize the contaminant and a large one will measure the radioactive burdens.
Methods for measuring stable lead in the bone using X-ray fluorescence have existed for a long time and can be now considered more accurately with the aid of Monte Carlo simulations [55].
6. Specific Problems Raised by Radon and Natural Radionuclides
Three radioactive families are encountered naturally: uranium (238U), actinium (235U) and thorium (232Th). Industrial processes may alter the parent-daughter series

Table 3. Properties of semiconductors and scintillators for detectors fabrication.
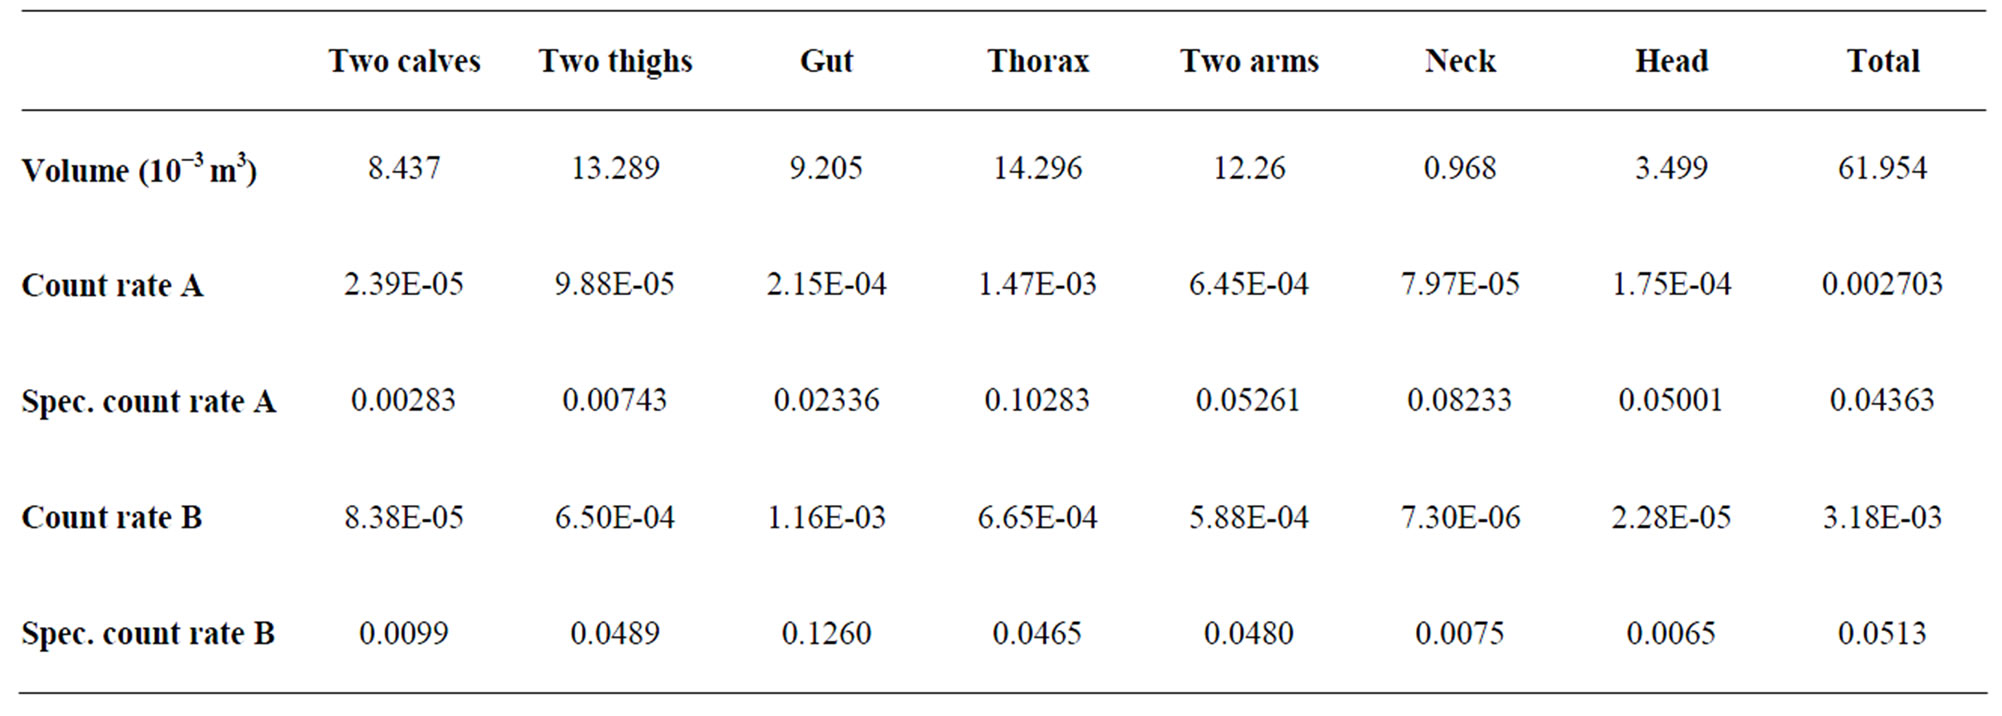
Table 4. Volume or the different body parts of a BOMAB phantom and specific count rates (s–1.Bq–1). For the detector place above the thorax (A) and above the abdomen (B) (see text).
and the relative concentration of specific daughters. The internal exposure from these natural sources is now becoming a matter of concern and regulation.
Radium (226Ra) which is readily separated from 238U, is quantified by measuring of the 186.2 keV gamma ray. However, other progenies (214Pb and 214Bi) are more easily quantified, but the fraction of exhaled radon (222Rn) has to be considered in the calculation. Another daughter of 238U, 210Pb (T1/2 = 22.3 years) accumulates and remains in the bones. It emits a 46.5 keV photon that can be quantified in thin bones like the patella and the skull. Radium was used in painting of “glow-in-the-dark” dials, in medical applications and in oil pipelines.
Radon is present in open air at concentrations between 4 and 20 Bq/m3 but it concentrates in confined places (uranium mines and houses) and its daughters are the largest source of natural irradiation with 1.3 mSv per year, worldwide average dose [56,57].
Thorium (Thorotrast) has been used in the past as contrast medium in radiology. Thorium is still used in industry: in Welsbach gas mantle, high pressure light tubes, flashbulbs for cameras and vehicles, in Tungsten-Inert -Gas welders and in high refractory lenses.
7. Operations with Techniques Used in External Dosimetry
Generally, there are seldom links between experiment in internal and external dosimetry even if their results are used together to calculate the doses according to the regulation. Very few foot monitors will not detect 60Co external contamination at levels of 1 kBq whereas the WBC will see it in a measurement of a few seconds. These techniques could be associated for cases with high body burdens. Some experiments have already been done at the very beginning of the dosimetry. In 1953, Daniels et al. administered a crystal of LiF (a thermoluminescent detector) for a person to swallow which received a therapeutic dose of 131I. After passage through the digestive tract, the detector was recovered and measured to determine the radiation dose received [66]. The very small detectors used in thermoluminescent dosimetry (TLD) and in optically stimulated luminescence dosimetry (OSLD) have also been used internally to follow the metabolism of radionuclides or the dose in organ during brachytherapy. These detectors could be placed inside the body at specific locations to measure the doses in different organs following the displacement of radionuclides after inhalation or injection in case of metabolic studies [58]. This is a medical procedure which could be used in extreme necessity but which is feasible. However, placing the detectors on the skin is very easy, does not require medical intervention and can be fruitful in results. Comparing the in vivo counting results with the doses measured with TL/OSL detectors and the calculated predictions will be of great interest for metabolic studies.
The passive detectors (TLD or OSLD) will integrate the radiations emitted by the radionuclides during the measurement. The comparison of the results furnished by the different detectors will allow establishing a profile of the distribution of the radionuclide in the body. After a while, the passive detectors will be out of sensitive range but the in vivo counting will continue to examine the migration of the radionuclide in the body. Using electronic passive detectors (EPD) on the body will allow following more precisely the metabolism or the displacement of the radionuclides in the organs. This technique, which is only applicable to high level of contamination (in metabolic studies), will furnish the information necessary to calculate correctly the results of in vivo counting to assess the burden. The EPD does not furnish the spectrum but the radionuclides will be identified by the in vivo counting.
8. Conclusions: The Future of the in vivo Counting Techniques
WBC has considerably improved its measurement capabilities with the aid of new technologies (detector types, detector materials, detector size, computers and numerical methods). The improvements described in this paper also have been observed elsewhere [59] and from indirect methods (analysis of urines, faeces and nose blows). Still discrepancies exist in the in vivo measurements especially due to calibration procedures [60]. In the future, WBC techniques could be extended through application of techniques used in external dosimetry with simultaneous use of TLD and OSL detectors. In the classical WBC techniques, the tilted chair remains the best geometry for a good accuracy in the measurements. Natural radiation being still an important possible source of contamination [61], the control of worker for professional contamination remains a complex task specially in routine procedures. The in vivo measurement of internal contaminations makes use of γ-spectrometry in a special way with constraints different from those observed in the spectrometry of samples. This point always has to be kept in consideration during the design of a measurement facility. The optimisation of the detector size has been previously made on the basis of the detector area [62]: a 20 mm thick HPGe detector shows already an increase of LC when the area is higher than 120 mm2 whereas a 500 µm silicon diode does not show an increase of the LC before 600 mm2 because the low Z of silicon makes it less sensitive to high energy photons. The study developed here showed that the detector thickness can be advantageously considered to reduce the LC of an in vivo counting and, in the low energy range spectrum, silicon could be advantageously used in place of HPGe.
9. Acknowledgements
We want to thank here Dr. V. Koukouliou and Dr. E. Carinou from G.A.E.C. in Athens for their collaborations in the numerical calculations.
10. References
[1] International Commission of Radiation Units and Measurements, “Direct Determination of the Body Content of Radionuclide,” ICRU Report 69, Journal of the ICRU, Nuclear Technology Publishing, Vol. 3, No. 1, 2003.
[2] International Commission of Radiation Units and Measurements. “Quantities and Units in Radiation Protection Dosimetry,” ICRU Report 51, Journal of the ICRU, Nuclear Technology Publishing, 1993.
[3] International Commission of Radiation Units and Measurements, “Fundamental Quantities and Units for Ionizing Radiation,” ICRU Report 60, Journal of the ICRU, Nuclear Technology Publishing, 1998.
[4] International Commission of Radiation Units and Measurements, “Photon, Electron, Proton and Neutron Interaction Data for Body Tissues,” ICRU Report 46, Journal of the ICRU, Nuclear Technology Publishing, 1992.
[5] International Commission of Radiation Units and Measurements, “Measurement of Dose Equivalents from External Photon and Electron Radiations,” ICRU Report 47, Journal of the ICRU, Nuclear Technology Publishing, 1992.
[6] International Commission of Radiation Units and Measurements, “Phantoms and Computational Models in Therapy, Diagnosis and Protection,” ICRU Report 48, Journal of the ICRU, Nuclear Technology Publishing, 1992.
[7] International Commission of Radiation Units and Measurements, “Measurement Quality Assurance for Ionizing Radiation Dosimetry,” ICRU Report 76, Journal of the ICRU, Nuclear Technology Publishing, Vol. 6, No. 2, 2006.
[8] G. Etherington, C. Cossonnet, D. Franck, J. L. Genicot, C. Hurtgen, J.-R. Jourdain, B. Le Guen, T. Rahola, S. Sovijärvi, G. N. Stradling, E. Ansoborlo and P. Bérard, OMINEX, “Optimisation of Monitoring for Internal Exposure,” The National Radiological Protection Board, NRPB-W60, Oxford, 2004.
[9] H. Doerfel, A. Andrasi, M. Bailey, V. Berkovski, C. -M. Castellani, C. Hurtgen, J. -R. Jourdain and B. LeGuen. “IDEAS, Guidance on Internal Dose Assessments from Monitoring Data,” Radiation Protection Dosimetry, Vol. 105, No. 1-4, 2003, pp. 645-647.
[10] C. Schmitzer and A. Brandl, “Internal Dosimetry: Enhancements in Application,” Update on the IDEA Project, Radiation Protection and Dosimetry, Vol. 105, No. 1-4, 2003, pp. 649-652.
[11] L. A. Currie, “Limits for Quantitative Detection and Quantitative Determination. Application to Radiochemistry,” Analytical Chemistry, Vol. 40, No. 3, 1968, pp. 586-593. doi:10.1021/ac60259a007
[12] B. Altshuler and B. Pasternak, “Statistical Measures of the Lower Limit of Detection of a Radioactivity Counter,” Health Physics, Vol. 9, 1963.
[13] C. Hurtgen, S. Jerome, M. Woods. “Revisiting Currie― How Low Can You Go?” Applied Radiation and Isotopes, Vol. 53, No. 1-2, 2000, pp. 45-50. doi:10.1016/S0969-8043(00)00171-8
[14] J. L. Genicot, I. Geboers, A. Damen, D. Franck and L. de Carlan, “The Reduction of Limits of Detection on in vivo Counting of Low Energy Photon Emitters by Optimizing the Shape and Size of Detectors,” Radiation Protection Dosimetry, Vol. 105, No. 1-4, 2003, pp. 457-462.
[15] J. L. Genicot, V. Koukouliou and E. Carinou, “Monte Carlo Calculations Applied to the Parametrical Studies in a Whole Body Counter,” Radiation Protection Dosimetry, Vol. 128, No. 1, 2008, pp. 49-61. doi:10.1093/rpd/ncm242
[16] Ph. Bérard, O. Pourret, J. P. Aussel and E. Rongier, “Treatment of the X and Gamma Rays Lung Monitoring Spectra Obtained by Using HP-Ge Detectors in Case of Exposures to Uranium,” I.R.P.A. 9, International Congress on Radiation Protection, Vienna, 14-19 April 1996.
[17] J. L. Genicot, S. Pommé and J. P. Alzetta, “In Vivo Measurement of Low Energy Photon Emitters: Room Temperature Semiconductor Diodes versus Large Scintillators and Germanium Crystals,” Health Physics, Vol. 76, No. 3, 1999, pp. 288-299. doi:10.1097/00004032-199903000-00010
[18] S. Neumaier, D. Arnold, J. Bohm and E. Funck, “The PTB Underground Laboratory for Dosimetry and Spectrometry,” Applied Radiation and Isotopes, Vol. 53, No. 1-2, 2000, pp. 173-178. doi:10.1016/S0969-8043(00)00129-9
[19] P. Vojtyla and P. P. Povinec, “A Monte Carlo Simulation of Background Characteristics of Low Level HPGe Detectors,” Applied Radiation and Isotopes, Vol. 53, No. 1-2, 2000, pp. 185-190. doi:10.1016/S0969-8043(00)00131-7
[20] J. E. Gardiner, “A Radioactive Marking Ink,” Nature, Vol. 197, No. 414, 1963.
[21] G. H. Kramer, S. A. Allen and D. Groff, “Problems Encountered during the Calibration of the New Cameco Mobile Lung Counter: Detector Size or Phantom Limitation?” Health Physics, Vol. 85, No. 6, 2003, pp. 751-758. doi:10.1097/00004032-200312000-00021
[22] R. A. Guilmette, G. R. Laurer, M. D. Hover and M. D. Snipes, “Customizing the LRRIIn Vivo Bioassay Facility for Measuring 210Pb as a Biomarker for Exposure to Radon Progeny,” Radiation Protection Dosimetry, Vol. 89, No. 3-4, 2000, pp. 333-338.
[23] J. L. Genicot and S. Pommé, “Attenuation Calculation of Low Energy Photons: Application to In-Vivo Spectrometry Using Multi-Diode Systems,” Radiation Protection Dosimetry, Vol. 81, No. 2, 1999, pp.113-122.
[24] M. A. Lopez, J. W. E. van Dijk, C. M. Castellani, L. Currivan, R. Falk, P.Olko and C.Wernli, “Individual Monitoring for Internal Exposures in Europe: Conclusions of an EURADOS Action,” Radiation Protection Dosimetry, Vol. 118, No. 2, 2006, pp. 176-181. doi:10.1093/rpd/ncl016
[25] J. -L. Genicot, “Room Temperature Semiconductor Detectors for in-vivo Monitoring of Internal Contamination,” Environmental Health Perspectives, Vol. 105, No. S6, 1997, pp. 1423-1426.
[26] J. L. Genicot and J. P. Alzetta, “New Technique Using Room Temperature Diodes for the Direct Assessment of Internal Contamination by Low Energy Gamma-Ray Emitters,” Applied Radiation and Isotopes, Vol. 48, No. 3, 1997, pp. 349-358.  doi:10.1016/S0969-8043(96)00222-9
[27] J. L. Genicot, J. P. Culot, F. Hardeman, J. P. Alzetta and H. Vanmarcke, “The Measurement of 241Am in the Body with a Double Low Energy Germanium Detector System,” I.R.P.A. 9, Vienna, 14-19 April 1996.
[28] L. Salmon, “Analysis of Gamma-Ray Scintillation Spectra by the Method of Least Square,” Nuclear Instruments and Methods in Physics Section A, Vol. 14, No. 2, 1961, pp. 193-199.  doi:10.1016/0029-554X(61)90071-4
[29] G. F. Knoll, “Radiation Detection Measurement,” 3rd Edition, John Wiley and Suns, 1999.
[30] C. J. Crannell, R. J. Kurz and W. Vishmann, “Achieving High Rates with CsI(Tl)-Photomultiplier Detectors,” Nuclear Instrumentations and Methods, Part A, No. 115, 1974, pp. 253-361.
[31] Saint-Gobain Ceramics and Plastics, Inc., “NaI(Tl) and Polyscin® NaI(Tl) Sodium Iodine Scintillation Material,” Vol. 3103, 2005.
[32] Saint-Gobain Ceramics and Plastics, Inc., “CsI(Tl) CsI (Na) Cesium Iodine Scintillation Material,” Vol. 3104, 2007, pp. 05-07.
[33] Hamamatsu Photonics K. K. Editorial Committee, “Photomultiplier Tubes―Basic and Applications,” 3rd Edition, Word Technical Writing, Inc. Hamamatsu Photonics K. K, 2006.
[34] C. W. E. van Eijk, “Radiation Detector Developments in Medical Applications: Inorganic Scintillators in Positron Emission Tomography,” Radiation Protection Dosimetry, Vol. 129, No. 1-3, 2008, pp. 13-21. doi:10.1093/rpd/ncn043
[35] H. B. Spitz, R. L. Bushbaum, G. A. A. Rieksts and H. E. Palmer, “A New Method for Analyzing High-Resolution Spectra from Hole Body Counter in-Vivo Measurements,” Health Physics, Vol. 49, No. 6, 1985. doi:10.1097/00004032-198512000-00004
[36] E. Carinou, V. Koukouliou, M. Budayova, C. Potiriadis and V. Kamenopoulou, “The Calculation of a Size Correction Factor for a Whole-Body Counter,” Nuclear Instrumentsand Methods in Physics Section A, Vol. 580, No. 1, 2007, pp. 197-200. doi:10.1016/j.nima.2007.05.083
[37] J. M. Gómez-Ros, et al., “Monte Carlo Modeling of Germanium Detectors for the Measurement of Low Energy Photons in Internal Dosimetry: Results of an International Comparison,” Radiation Measurements, Vol. 43, No. 2-6, 2008, pp. 510-515.
[38] G. H. Kramer and B. M. Hauck, “The Sliced BOMAB Phantom: A New Variant for Intercomparison,” Health Physics, Vol. 90, No. 2, 2006, pp. 161-166. doi:10.1097/01.HP.0000176672.86806.89
[39] International Commission on Radiological Protection, “1990 Recommendation of the International Commission on Radiological Protection,” Publication 60, ICRP, Vol. 21, No. 1-3, 1991.
[40] G. H. Kramer and P. Crowley, “The Assessment of the Effect of Thyroid Size and Shape on the Activity Estimate Using Monte Carlo Simulation,” Health Physics, Vol. 78, No. 6, 2000, pp. 727-738.
[41] G. H. Kramer, “Considerations in Assigning Dose Based on Uncertainties from In Vivo Counting,” Environmental Health Perspectives, Vol. 105, No. S6, 1997, pp. 1393- 1395.
[42] T. J. Summerling and S. P. Quant, “Measurements of the Human Anterior Chest Wall by Ultrasound and Estimates of Chest Wall Thickness for Use in Determination of Transuranic Nuclides in the Lung,” Radiation Protection Dosimetry, Vol. 3, No. 4, 1982, pp. 203-210.
[43] N. Pierrat, L. de Carlan, D. Cavadore and D. Franck, “Application of Monte Carlo Calculation for the Virtual Calibration of a Low-Energy in vivo Counting System,” IEEE Transactions on Nuclear Science, Vol. 52, No. 5, 2005, pp. 1353-1358. doi:10.1109/TNS.2005.858249
[44] G. H. Kramer and K. Capello, “Effect of Lung Volume on Counting Efficiency: A Monte Carlo Investigation,” Health Physics, Vol. 88, No. 4, 2005, pp. 357-363. doi:10.1097/01.HP.0000152112.80491.86
[45] J. L.Genicot and F. Hardeman, “A Measurement of the Ecological Half-Life of 137Cs in Belgium,” Health Physics, Vol. 67, No. 6, 1994, pp. 669-670.
[46] J. K.Shultis and R. E. Faw, “Radiation Shielding Technology,” Health Physics, Vol. 88, No. 4, 2006, pp. 297- 322.
[47] J. L. Genicot, F. Hardeman and F. Waetermans, “Deterministic Analytical Method for the Calibration of Semiconductor Detectors in Gamma Ray Spectrometry,” Radiation Protection Dosimetry, Vol. 61, No. 1-3, 1995, pp. 141-144.
[48] J. G. Hunt, B. M. Dantas, M. C. Lourenço and A. M. G. Azeredo, “Voxel Phantoms and Monte Carlo Methods Applied to In Vivo Measurements for Simultaneous 241Am Contamination in Four Body Regions,” Radiation Protection Dosimetry, Vol. 105, No. 1-4, 2006, pp. 549- 552.
[49] W. R. Nelson, H. Hirayama and D. W. O. Rogers, “The EGS4 Code System,” Stanford University, Stanford, 1985.
[50] A. Perez-Andujar and L. Pibida, “Performance of CdTe, HPGe and NaI(Tl) Detectors for Radioactivity Measurements,” Applied Radiationand Isotopes, No. 60, 2004, pp. 41-47.
[51] H. B. Spitz and J. Lodwick, “Design, Fabrication and Evaluation of a New Calibration Phantom for in Vivo Measurement of Bone-Seeking Radionulcides,” Radiation Protection Dosimetry, Vol. 89, No. 3-4, 2000, pp. 275-282.
[52] P. Delwaide, W. G. Verly, J. Colard and R. Boulenger, “The Assay of Total Potassium in the Human Body,” Health Physics, Vol. 9, No. 2, 1963, pp. 147-152. doi:10.1097/00004032-196302000-00003
[53] R. Wood, C. Sharp, B. Le Guen, G. N. Stradling, D. M. Taylor and M. H. Hengé-Napoli, “Decorporation Treatment-Medical Overview,” Radiation Protection Dosimetry, Vol. 87, No. 1, 2000, pp. 51-57.
[54] H. Métivier, A. Kaul, H. -G. Menzel and J. W. Stather, “Intakes of Radionuclides: Occupational and Public Exposure. Editorial: Intakes of Radionuclides,” Radiation Protection Dosimetry, Vol. 79, No. 1-4, 1998.
[55] J. Lodwick and H. B. Spitz, “Monte Carlo Simulation of an Anthropometric Phantom Used for Calibrating In Vivo K-XRF Spectroscopy Measurements of Stable Lead in Bone,” Health Physics, Vol. 95, No. 6, 2008, pp. 744- 753. doi:10.1097/01.HP.0000324203.54983.27
[56] United Nations Scientific Committee on the Effects of Atomic Radiation (UNSCEAR), “Sources and Effects of Ionizing Radiation,” UNSCEAR Report to the General Assembly, 2007.
[57] United Nations Scientific Committee on the Effects of Atomic Radiation (UNSCEAR), “Sources of Radiation and Effects of Exposure,” 55th Session, Vienna, 21-25 May 2007.
[58] R. Pötter, E. VanLimbergen and A. Wambersie, “Reporting in Brachytherapy: Dose and Volume Specification,” European Society Therapic Radiology and Oncology, Brussels, 2002.
[59] R. C. Suarez, M. Gustafsson and K. Mrabbit, “Present and Future Activities of the IAEA on Internal Dosimetry: Lessons Learned from International Intercomparisons,” Radiation Protection Dosimetry, Vol. 105, No. 1-4, 2003, pp. 433-435.
[60] S. Pommé, J. Uyttenhove, B. Van Waeyenberge, J. L. Genicot, J. P. Culot and F. Hardeman, “Radiocesium Contamination in Belgium,” Journal of Radioanalytical and Nuclear Chemistry, Vol. 235, No. 1-2, 1998, pp. 139- 144. doi:10.1007/BF02385952
[61] M. Eisenbud, “Environmental Radioactivity.from Natural, Industrial and Military Sources,” ACADEMIC Press, Inc., 1987.
[62] D. Franck, P. Pihet, P. Burger, M. Keters, M. Rouger, F. Lugier and C. Mazur, “Investigation of Silicon Detectors to Improve in vivo Monitoring of 239Pu after Accidental Intake,” Radiation Protection Dosimetry, Vol. 89, No. 3- 4, 2000, pp. 321-324.
[63] J. L. Genicot, “The In Vivo Detection of Low Energy Photon Emitters in Radiation Protection and in Nuclear Medicine. A New Philosophy for New Needs in In Vivo Counting,” Radiation Protection Dosimetry, Vol. 89, No. 3-4, 2000, pp. 339-342.
[64] P. Pihet, P. Burger, D. Franck, Ph. Berard, L. Le Noir de Carlan, D. Paul and N. Razafindralamdo, “Perspective of Silicon Detectors for X and Low Energy Gamma Ray Spectrometry in Whole-Body Counting,” Radiation Protection Dosimetry, Vol. 61, No. 1-3, 1995, pp. 149-152.
[65] J. M. Cardoso, V. Amorim, R. Bastos, R. Madeira, J. BasílioSimões and C. M. B. A. Correia, “Very Low-Cost Portable Multichannel Analyzer,” Instrumentation Center of the Physics Department, University of Coimbra-P3004 516, Coimbra, 1999.
[66] J. R. Cameron, N. Suntharalingam and G. N. Kenny, “Thermoluminescent Dosimetry,” The University of Winconsin Press, 1968.